
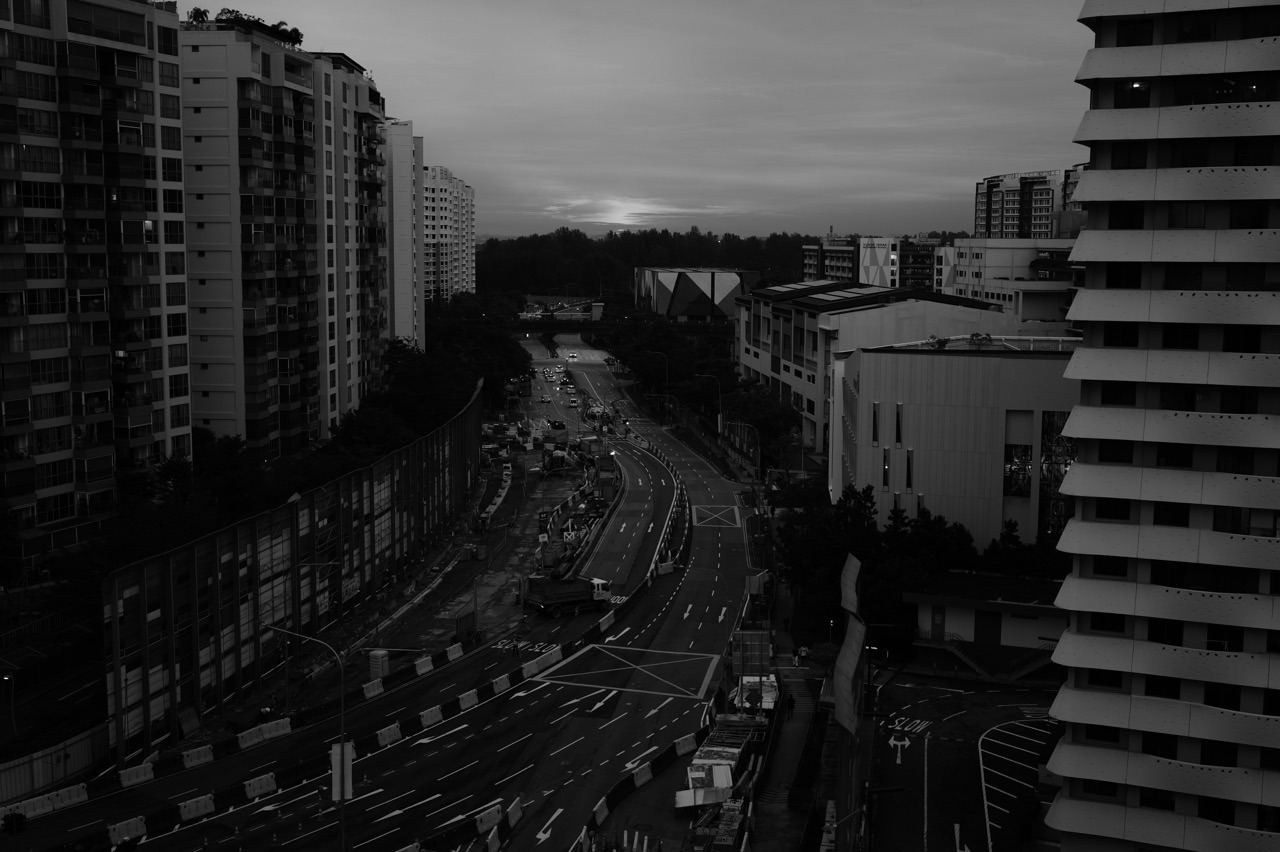
How do you read a Punggol haze chart without mixing up the numbers? First check what is measured, the units, the region, the averaging period and the timestamp. One-hour PM2.5 is a concentration measured in micrograms per cubic metre, while Singapore’s 24-hour PSI is an air-quality index calculated from several pollutant measurements. Neither number is a reading from a sensor inside your HDB flat. For Punggol, the official reporting region is North.
If you are looking for Punggol PM2.5 graphs, Singapore haze PSI data, Sumatra hotspot maps, Kalimantan smoke satellite images or how to interpret wind direction during haze, this guide teaches the evidence-reading skills that matter. Use NEA’s live haze service for decisions today. Use the original Punggol haze check if you only need the short indicator choice. This longer article explains how to judge charts, calculations and maps.
The 30-second test for any haze screenshot
Before forwarding a dramatic image or a rising line graph, look for six things: source, date, time, region, pollutant and averaging period. If one is missing, your confidence should fall. If several are missing, the image may be useful as a conversation starter but is not adequate evidence for a current health-sensitive decision.
For example, a screenshot marked “83” could mean a 24-hour PSI value, a one-hour PM2.5 concentration, an AQI calculated by another country or even a sensor reading indoors. These numbers are not interchangeable. Without the label and units, “83” says remarkably little.
A practical information habit is to copy the source link as well as the number. A live official webpage lets other family members check whether the information is still relevant. It is much better than a screenshot stripped of the caption.
The two measures most Punggol residents actually need
Singapore’s National Environment Agency reports one-hour PM2.5 concentration as an indication of more immediate conditions and the 24-hour PSI as a rolling index. During the haze season, the 24-hour PSI forecast and corresponding health advisory are used for planning ahead, while the one-hour PM2.5 band and personal guide inform activities starting soon.
PM2.5 is particulate matter with an aerodynamic diameter of 2.5 micrometres or less. The concentration can be expressed in μg/m³—micrograms of particles per cubic metre of air. PSI has no such mass-per-volume unit because it is an index rather than the mass of one pollutant.
The PSI incorporates monitored pollutant measurements, including PM10, PM2.5, sulphur dioxide, nitrogen dioxide, ozone and carbon monoxide. During transboundary haze, NEA says PM2.5 is typically the predominant concern. However, “PM2.5 is important” does not mean you can divide a concentration by a fixed number to recover the official PSI.
For an outdoor run or school activity, consult the latest official health guidance instead of inventing your own conversion formula.
Why Punggol is North, not its own official PSI zone
NEA publishes outdoor air-quality results for five regions: North, South, East, West and Central. Its official reporting-region table specifically includes Punggol and Sengkang in North. This is an administrative reporting geography, not a promise that two housing blocks have exactly identical personal exposure.
A resident might notice stronger wind near Northshore, more shelter at a void deck and different views along the Waterway. Those real local differences do not automatically produce official separate PSI values. The North reading comes from NEA’s air-monitoring network and regional reporting arrangements.
When comparing Punggol with a relative in Hougang, note that NEA lists Hougang in East, not North. This matters if someone casually says the two places have the same reading because they are both in the northeast of Singapore. The published air-quality reporting regions do not follow every intuitive neighbourhood label.
A chart should always use the reporting geography actually defined by the data provider.
Units matter: μg/m³ is not PSI
Imagine that a one-hour PM2.5 reading displays 80 μg/m³. The “80” is a concentration, and the symbol tells you that each cubic metre of sampled air contains a measured mass of fine particles. The same numeral on a 24-hour PSI display would be a different type of information entirely.
A common mistake is to add a PSI number to a PM2.5 number or to plot them on one vertical axis without clearly distinguishing the scales. That may create a visually impressive diagram with no physical meaning.
If you need to graph different indicators together for teaching, label the axes separately and explain that they are not the same measure. Never draw a line that suggests a PSI of 80 equals 80 μg/m³.
This is a general rule for environmental data: identify the variable before you perform arithmetic.
The current PM2.5 band labels
Singapore’s Ministry of Health published the one-hour PM2.5 personal guide with these bands: Band 1 Normal (0–55 μg/m³), Band 2 Elevated (56–150 μg/m³), Band 3 High (151–250 μg/m³) and Band 4 Very High (251 μg/m³ or above). Those labels refer to one-hour PM2.5, not 24-hour PSI.
If a hypothetical hourly measurement rises from 54 to 56 μg/m³, the displayed band crosses from Normal to Elevated. That change is meaningful for the published guidance, but it does not prove that the air suddenly became qualitatively different in every room the instant the numerical boundary was crossed.
The correct decision comes from the official personal guide, which distinguishes healthy people and vulnerable groups and considers the timing of the activity. The band is information, not a personal diagnosis.
The 24-hour PSI uses categories such as Good, Moderate, Unhealthy, Very Unhealthy and Hazardous, with different ranges and health instructions. Do not paste the PM2.5 band names over PSI thresholds.
Worked example one: read a four-hour line graph correctly
Consider this fictional educational series for the North reporting region: 9am: 40 μg/m³, 10am: 72 μg/m³, 11am: 110 μg/m³, 12pm: 86 μg/m³. These are not actual measurements for Punggol on 17 October 2026.
From 9am to 10am, the concentration increases by 32 μg/m³. Between 10am and 11am it increases another 38 μg/m³. Between 11am and noon it decreases by 24 μg/m³. The highest displayed value is 110 μg/m³ at 11am; the lowest is 40 μg/m³ at 9am.
The simple arithmetic mean of these four values is (40 + 72 + 110 + 86) ÷ 4 = 77 μg/m³. That is the average of four invented hourly concentrations. It is not the official 24-hour PSI and is not even a true 24-hour PM2.5 average.
Why is the distinction crucial? Because a mean computed from four hours does not represent an entire 24-hour measurement period. Nor does the PSI calculation equal the plain average of PM2.5 concentrations. This is how plausible-looking figures become misinformation.
Worked example two: percentage changes can sound more dramatic than they are
Using the same hypothetical series, the increase from 40 to 72 is 32. Expressed as a percentage of the original value, the increase is 32 ÷ 40 × 100 = 80%. That is a valid percentage-change calculation for the selected two points.
But a headline saying “Punggol haze surged 80%” without identifying the variable, times and source would still be misleading. It does not say the health risk rose by 80%, the PSI rose by 80% or that everyone inhaled 80% more particles.
A scientific sentence looks like this: “In the fictional dataset, the measured one-hour PM2.5 concentration increased from 40 to 72 μg/m³ between 9am and 10am, an increase of 80%.” It is longer than the headline but far more precise.
When the numbers are real, state their real timestamp and link the primary source. Good charts are careful about language as well as arithmetic.
Worked example three: rate, slope and the trap of forecasting a straight line
Suppose a graph moves from 50 to 80 μg/m³ over one hour. Its average change over that interval is 30 μg/m³ per hour. Students can draw the two points and find the slope. That is a description of the observed interval only.
It would be a mistake to project the same slope for another six hours and announce that pollution will reach 260 μg/m³. Smoke transport, wind, rainfall, emissions and the background atmosphere can change. A two-point slope is not a validated atmospheric forecast.
The educational lesson is powerful: a line can describe observed values without explaining their causes or predicting future values. The structure of a graph does not replace a meteorological model.
A family should use NEA’s issued forecast and personal guide, not a child’s linear extrapolation, for health-sensitive planning.
Why a rolling 24-hour measure responds differently
Imagine a high concentration for only one hour followed by many hours of lower values. An hourly graph can show the sharp peak quickly. A rolling 24-hour measure includes other hours as well, so its behaviour is generally smoother. It can remain elevated after the worst hourly peak has passed.
That is not a flaw. A shorter and a longer time window answer different questions. The one-hour indicator helps with a near-term activity; the 24-hour PSI represents a longer exposure-related index.
A rolling window is continuously updated as older observations leave the period and new ones enter. It is not simply a midnight-to-midnight calendar day unless the provider expressly says so. Label your chart accurately.
When comparing data, ask whether two values belong to the same reporting period. Otherwise a real difference in time aggregation may be mistaken for disagreement between monitoring systems.
How to read a satellite hotspot map
The ASEAN Specialised Meteorological Centre uses satellite-derived hotspot information to observe potential fire activity across the region. A hotspot represents a possible active fire detected by a sensor, not a confirmed count of individual fires or an estimate of precisely how much smoke has reached Punggol.
A map with ten hotspot icons does not necessarily mean ten separate large fires. Satellite passes, cloud cover, detection resolution, temperature and data processing influence what appears. Some active fires may be missed. ASMC explicitly warns that cloud conditions and incomplete satellite coverage limit detection.
Always read the map’s date and whether observations were taken during day or night. A hotspot summary from Monday cannot prove that an individual fire is still active on Thursday, and a blank section of map may reflect missing observation conditions.
The most responsible explanation uses the word detected, not proved, unless additional evidence is available.
Why the wind arrows do not point to your balcony
ASMC’s regional haze map describes its wind arrows as model-analysis winds around 2,500 feet. That is well above a pedestrian path beside Punggol Waterway. An arrow is a representation of wind at a model level, not a direct measurement of the air moving past your window.
A southeasterly wind blows from the southeast toward the northwest. Getting the naming convention backward can lead to exactly the wrong inference about a plume’s likely direction.
At different altitudes, wind strength and direction can differ. Terrain, buildings and afternoon weather influence conditions near the ground. A correct atmospheric interpretation must consider the level of the wind data, not merely the nearest icon on the screen.
Regional wind maps are useful for understanding plausible transport paths. They do not give an exact parcel-by-parcel history of every inhaled particle.
Putting hotspots, smoke and local readings together
There are three evidence layers. Source: satellites or ground reports detect possible burning. Transport: meteorological observations and models describe where smoke might move. Exposure: Singapore’s air monitoring network measures pollution present in its reporting regions.
Strong interpretation uses all three. A cluster of fires without winds toward Singapore does not by itself establish a Punggol haze episode. Winds pointing broadly toward Singapore without observed relevant smoke do not prove the origin either. An elevated local PM2.5 measurement establishes an air-quality observation but does not uniquely identify the exact fire responsible.
NEA’s dated situation updates combine these forms of evidence and describe uncertainty. For example, the October 2026 haze episodes included discussions of fires in parts of Sumatra and Kalimantan with changing prevailing winds. Such a statement should carry the date of the update.
A neighbourhood message that skips straight from one red hotspot dot to “this exact fire is poisoning our block right now” overstates the available evidence.
Reading smoke layers versus clouds and rain
Satellite imagery can show plume-like features, but cloud cover and atmospheric moisture complicate interpretation. ASMC notes that hotspot detections may be missed under clouds. A photograph of a grey sky can show smoke, humid haze, clouds or a mixture.
NEA explains that visibility is not a reliable proxy for the level of pollution because water vapour and particles that absorb moisture can scatter light. Smell is also an incomplete indicator. Some odour-causing gases are not the same substances used to calculate the official PSI.
Therefore, two independent questions remain: What does the atmosphere look or smell like? and What do the instruments measure? Both can be interesting, but only one is an official quantitative air-quality reading.
This is especially relevant for sunset photos and high-floor skyline comparisons in Punggol, where humidity, backlighting and camera settings change the appearance substantially.
A simple chart audit for students and parents
Check the title: does it say ‘North PM2.5’ or only ‘Punggol haze’? Check the horizontal axis: is it hours, dates or forecasts? Check the vertical axis: is it μg/m³, PSI or another index? Check the plotting scale: does the axis begin at zero, and if not, is the truncation clear?
Next inspect missing data. An absent reading should not automatically be plotted as zero. Zero means a measured value of zero; a missing observation means no trusted value is supplied. Those are different categories.
Then examine any trend line. Is it merely showing past data, or does someone use it to predict the next day? A forecast requires relevant modelling and uncertainty, not just drawing a straight line beyond the right edge of the graph.
Finally, read the update time. A beautiful chart is not useful for immediate health decisions if its latest point is yesterday afternoon.
Comparing North and East without inventing a neighbourhood ranking
A resident might ask whether Punggol is less hazy than Hougang. NEA’s regional table places Punggol in North and Hougang in East. The published readings may differ, but a regional comparison does not tell you the exact concentrations at two particular bedrooms or bus stops.
Suppose a fictional North hourly PM2.5 value is 65 μg/m³ and an East value is 71 μg/m³. The difference is 6 μg/m³ for those two hypothetical regional readings. The numbers say nothing on their own about the precise cause or an individual’s total exposure.
A fair comparison requires the same timestamp, pollutant, unit and averaging period. Comparing North’s one-hour PM2.5 with East’s 24-hour PSI would be like comparing a temperature with a rainfall total.
If a parent is travelling from Punggol to Hougang, check the correct region and actual activity instead of publishing a list of ‘safest estates’ based on one moment.
Forecast uncertainty: a range is not a failure
Meteorological forecasts are conditional estimates. Wind direction, rainfall and fire activity may change between the forecast’s issue time and the next day’s activities. An advisory that gives a possible range communicates uncertainty rather than incompetence.
The sensible response is a flexible plan. A school may prepare an indoor CCA alternative, a family may decide whether to reschedule a long cycle, and an outdoor employer may prepare breaks or modified duties. The forecast helps them plan; the latest readings help them update the decision.
Do not turn the top of a forecast range into a guaranteed observed reading. Likewise, do not dismiss a precaution taken before a forecast improves later. Decisions are judged by the evidence available at the time and the consequences they were intended to avoid.
The Punggol 48-hour haze preparedness guide shows this distinction as a family workflow.
Low-cost monitors and crowd-sourced maps
An inexpensive indoor PM2.5 sensor can sometimes show patterns such as a spike during cooking or a decline after filtration, but performance depends on sensor technology, humidity, calibration, maintenance and location. It should not be treated as identical to NEA’s certified outdoor monitoring network.
Crowd-sourced air-quality maps may use different algorithms or indices. NEA specifically cautions that foreign AQI measures cannot be compared directly with Singapore’s 24-hour PSI. A device might report PM2.5 in μg/m³, an AQI from another national framework, or a proprietary wellness score.
When comparing an indoor sensor with an outdoor official reading, remember the setting is different. A closed, filtered bedroom will not necessarily track regional outdoor concentration point-for-point. This discrepancy alone does not prove one instrument is faulty.
For clinical or public-health decisions, use the authoritative advisory and relevant medical guidance rather than a single unverified gadget reading.
Build a useful haze diary in five columns
A student or parent can create a small observation table with date/time, official region, indicator and units, reading or band, and decision or observation. For example: “17 Oct, 4pm; North; 1-hour PM2.5, μg/m³; [look up the real value]; reviewed park plans.” Do not copy a fake sample number into a live diary.
Add a sixth optional column for source URL or screenshot filename with the original timestamp preserved. Keep personal medical information out of a class spreadsheet and avoid sharing identifiable family routines online.
After several days, the family can look for patterns but should not jump to causal conclusions. A perceived correlation between one person’s cough and a reading does not by itself establish a diagnosis; changes in weather and daily activities also matter.
For students, this is a useful way to learn data provenance, graph literacy and environmental science without taking unnecessary outdoor measurements during poor air quality.
Ten chart mistakes worth remembering
- Mixing PSI with PM2.5 concentration on a single unlabelled scale.
- Calling a four-hour mean the official 24-hour PSI.
- Treating an ASMC hotspot symbol as a confirmed active fire of known size.
- Reading a 2,500-foot wind arrow as the actual wind at a Punggol bus stop.
- Ignoring cloudy satellite detection conditions.
- Treating a blank data point as a zero.
- Comparing North and East readings taken at different times.
- Using a linear extension of two observed points as a forecast.
- Assuming a visually clear skyline proves a low PM2.5 concentration.
- Forwarding an attractive screenshot with no date, units or official link.
These are not minor presentation mistakes. Some can change the decision a parent or worker makes. Good data literacy begins with accurate labels.
Frequently asked questions
Is the Punggol PSI a separate value from Sengkang?
Both Punggol and Sengkang are in NEA’s North reporting region. The official data is regional and does not claim a different certified reading for every town or block.
Can I convert 1-hour PM2.5 directly into a 24-hour PSI?
No. The indicators use different units, averaging periods and computation methods. A simple constant multiplier is not valid.
Why can the 1-hour PM2.5 fall while 24-hour PSI stays high?
A shorter observation window can respond quickly to recent changes, while a rolling 24-hour index incorporates earlier conditions and other computation details. They need not move together.
Does each satellite hotspot equal one fire?
No. ASMC hotspots are satellite indications of possible fire activity, subject to detection limits. Cloudiness, sensor passes and processing matter.
Does an arrow pointing northwest mean wind blows from the northwest?
Not necessarily. Meteorological naming distinguishes the direction a wind comes from. A southeasterly wind travels toward the northwest. Always check the map legend.
Is a low-cost sensor more accurate than NEA because it sits beside my window?
A nearby sensor measures a different micro-environment but does not automatically have better accuracy. NEA’s official monitoring equipment and reporting methods are designed for the public air-quality service.
Can I estimate tonight’s PM2.5 by extending a graph?
A straight-line extrapolation is not a reliable atmospheric forecast. Use the latest issued forecast and recheck when plans are due.
Why can my sunset photo look hazier even when a reading falls?
Light angle, humidity, visibility, camera exposure and particle properties influence appearance. Photographs are not calibrated particle monitors.
What is the best data source for an urgent outdoor decision?
For Punggol, use the latest official NEA North-region one-hour PM2.5 band and personal guide; consult the official forecast and advisory when planning ahead. If someone feels unwell, seek individual healthcare advice.
Continue through the eduKate haze ecosystem
The short Punggol Haze Check answers which indicator to use. Why Is Punggol Hazy? explains the atmospheric causes. This page is a data-reading tutorial, focusing on charts, units, measurements and interpretation.
For everyday choices, use the Punggol Haze Outdoor Activities Guide and Punggol Haze at Home. For broader curriculum ideas, see eduKateSG: Why Mathematics? Air Quality, PSI and Particulate Matter and Why Science? Air Quality and Reading Environmental Data.
Official sources and data-use note
Reviewed on 17 October 2026. All worked numbers above are fictional for educational use and deliberately not presented as actual Punggol observations. Use live NEA pages for current readings.
- NEA: live haze readings and advisories
- NEA: FAQs, regional table, data sources and PSI interpretation
- MOH: official one-hour PM2.5 bands and 24-hour PSI advice
- ASMC: satellite hotspot information
- ASMC: regional haze map and modelled wind information
- NEA: a dated 9 October 2026 update showing forecast and regional smoke analysis
A good environmental chart does more than look scientific. It makes clear what was measured, what remains uncertain and what decision the evidence can—and cannot—support.
Punggol Haze: Connected Reading Library
These reader-first guides answer different questions about Punggol and Singapore haze. For a decision about today, check the official NEA live readings and advisories rather than using an old article as a real-time report.
- Indoor destinations and verified PA haze shelters
- Balcony plants, laundry, vegetables and safe dust cleaning
- Indoor Science, Geography, Mathematics and English learning projects
- Punggol Haze Check: one-hour PM2.5 and 24-hour PSI
- What happens in Punggol during haze: family routines
- eduKateSG Singapore Haze: transboundary smoke and connectivity
- eduKateSG Punggol Haze Lifestyle: work, school and daily errands
New Punggol Haze References: History, Law, Nature and Household Costs
These related guides explain distinct parts of the haze problem, from historical episodes and regional governance to local nature and HDB household expenses. For decisions about today, consult NEA’s live advice.
Punggol Haze: Photography, Climate, Buildings and Local Dust
Explore separate reader-first guides on documenting visibility, understanding climate patterns, how Punggol buildings work and recognising local construction dust. For today’s health decisions, use NEA’s official live readings and advisories.
More Punggol Haze References: Facts, Water, Fairness and Economics
Continue to four distinct reference guides covering common misconceptions, water-quality evidence, unequal exposure and the economics of prevention. For current air quality, always check NEA’s live haze advice.


