
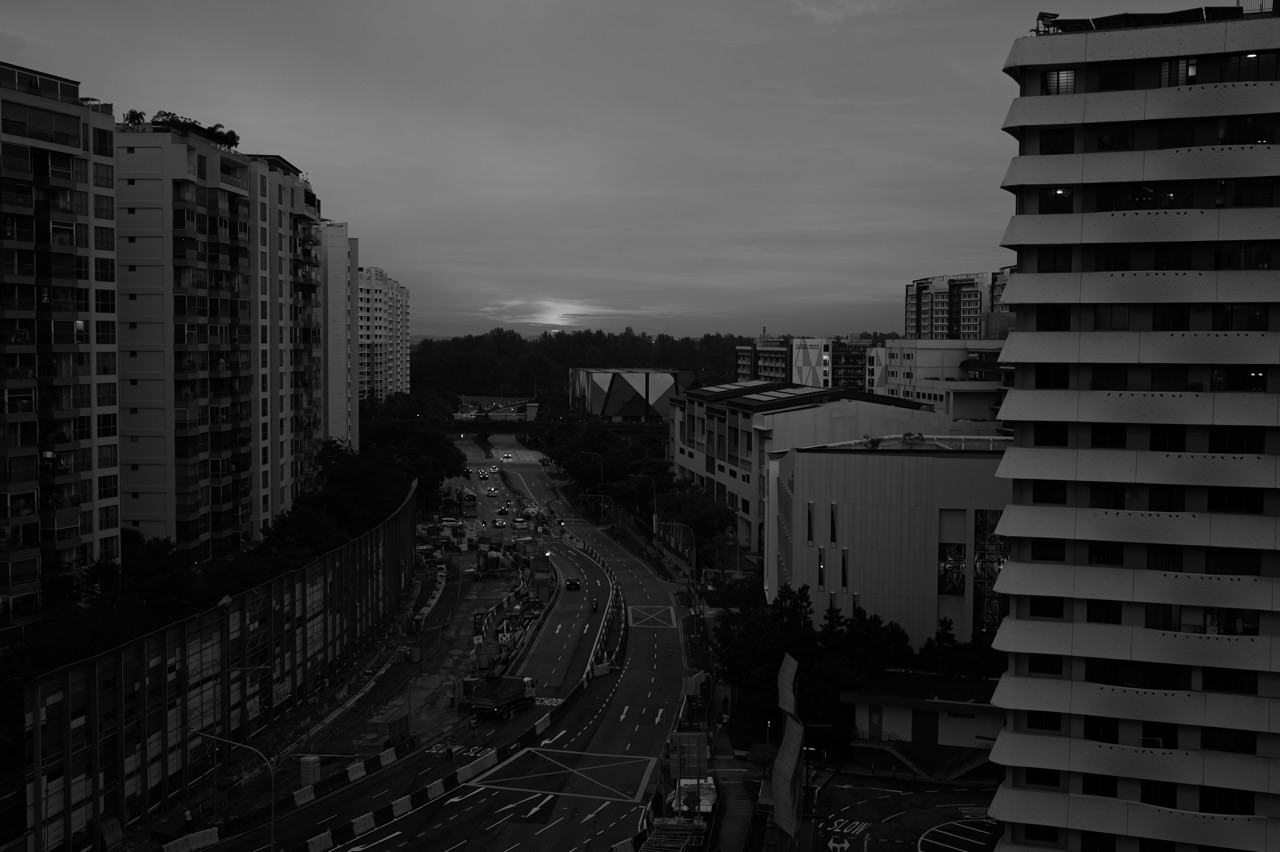
Can you photograph haze in Punggol and tell how polluted the air is? You can document what the skyline looks like, but a phone photograph cannot measure PM2.5 or PSI. Humidity, mist, sun angle, lens flare, camera exposure and image editing all change the appearance of distant buildings. For a reliable air-quality decision, check the official NEA haze readings and the North region, which includes Punggol, rather than reading a pollution number from the colour of a sunset.
For people searching Punggol haze photography, Punggol Waterway sunset haze, why the skyline looks grey, haze versus fog photos or how to take fair before-and-after air-quality pictures, this guide combines practical camera technique with careful environmental reporting. You do not need to go outdoors during unhealthy conditions to prove you can photograph them. A familiar safe indoor window view, or an old image taken in suitable conditions, can teach most of the same skills.
Quick answer: photograph the appearance, not an invented reading
A useful Punggol haze photo should tell viewers where it was taken, when it was taken, what direction the camera faced, and whether it has been edited. If it is being used to illustrate actual air quality, add a separate timestamped official NEA reading with its correct indicator, units and region. The photograph and the measurement remain two kinds of evidence.
The most common error is to assume an orange-red sky means hazardous PSI. Sunlight passes through the atmosphere at a low angle near sunrise or sunset, giving ordinary skies warm colours as shorter wavelengths are scattered. Suspended particles, moisture and clouds can also change colour and contrast. A striking picture proves that the scene looked striking to the camera—not that the air belonged to a particular medical risk category.
If you want the right number before a photo outing, use the Punggol haze check: one-hour PM2.5 versus 24-hour PSI. This article is about photographic evidence and creative technique rather than repeating the health-advisory table.
Why Punggol is an interesting photography setting
Punggol combines waterside paths, residential towers, bridges, open skies, greenery and a changing coastline. From some views, distant apartment blocks stand behind nearer trees or water; those layers make atmospheric perspective easy to notice. The official NParks Punggol Waterway Park page describes four themed zones across a park connected with the North Eastern Riverine Loop.
The landscape does not become a different official air-quality reporting area just because you move from a high floor to a bridge. NEA includes Punggol in the North reporting region. The composition changes, the amount of foreground changes and the direction of light changes, but the regional label remains what the public dataset specifies.
Readers interested in ordinary photo locations can use the existing Punggol Photo Spots Guide when the official outdoor conditions are appropriate. This haze article is deliberately not a suggestion to travel somewhere smoky for a more dramatic picture.
The visual story is often strongest from familiar places. Photograph the same skyline from an appropriate safe location over time, keeping the framing and editing consistent.
Visibility is not the same as particulate concentration
NEA explains that poor visibility does not necessarily mean higher measured air pollution. Water droplets and humidity influence light scattering, and some airborne particles take up water in moist conditions. Visibility may appear worse even when the pattern of health-relevant pollution does not match the appearance directly.
That is a key photography insight. Cameras measure incoming light; air-quality monitors measure pollutant concentrations using specialised instruments. Both involve observations of the environment, but they do not have the same output.
A Punggol skyline can look faint because of moisture, because light is shining toward the lens, because of particle scattering, or because a camera applied low contrast. A photograph alone cannot separate every possibility.
The appropriate claim is “the distant buildings appeared less distinct in this image.” The inappropriate leap is “therefore the official one-hour PM2.5 must be above a particular threshold.” Keep the descriptive and numerical claims apart.
Atmospheric perspective: why distant buildings fade
Even on ordinary days, distant objects tend to appear lower in contrast and sometimes cooler in colour than nearby objects. Light is scattered and absorbed as it passes through the atmosphere. Photographers call the layered look atmospheric perspective.
In Punggol, a row of nearby trees may appear dark and sharply defined while distant flats look pale. The effect can be strengthened by moisture or smoke, but the apparent contrast also depends on light direction, camera processing and what objects happen to be in the frame.
To demonstrate this safely, find an existing image with obvious foreground, middle distance and background. Ask a student which edges are sharpest and why. The lesson is visual optics, not air-quality diagnosis.
Do not claim a building that disappeared into the background is necessarily covered by a hazardous layer of PM2.5. Its disappearance may be partly photographic, and the distance between objects must be accounted for.
The simple composition: foreground, midground and skyline
Start with one recognisable foreground feature, such as a balcony railing seen from a safe interior position or a building edge. Add a middle-distance subject, then a more distant skyline. This arrangement makes depth easier to read.
If you photograph a Waterway scene when outdoor conditions are suitable, a path or bridge can be the foreground while residential buildings form the distance. For a fixed indoor experiment, a window frame can provide context without requiring a long walk outdoors.
A good environmental photograph does not need extreme colour grading. Aim for clear subject separation and a caption that tells the reader what it depicts. Avoid creating dramatic “smoke bands” by editing shadows in the sky until the image no longer represents the scene as witnessed.
If you use a stock or archive image of Punggol, disclose that it is illustrative. A photograph from 2021 is not evidence of the air quality in October 2026.
Camera exposure: a brighter image can look less hazy
Cameras adjust exposure based on the brightness of the scene and the camera’s settings. Increase exposure and pale atmospheric regions may look washed out; decrease it and clouds may become dramatic and dark. Neither exposure adjustment means pollution has physically changed.
For a fair comparison, keep the same viewpoint and try a consistent exposure approach. On a smartphone, tapping different bright or dark parts of the scene can change exposure compensation automatically. For a technical study, note whether the device used automatic exposure or a manually fixed value.
A family can compare two versions of the same photo using different exposure adjustments. Ask: Did the sky change, or did the processing change? This is a safe, useful demonstration of why photographs cannot be treated as calibrated environmental sensors.
If the image is intended for an article rather than a scientific comparison, attractive exposure is fine—as long as no unsupported pollutant reading is attached to it.
White balance and the orange sunset problem
White balance influences whether neutral objects appear warmer or cooler. Automatic white balance may interpret the same scene differently across two photographs, particularly when a large part of the frame contains colourful evening light.
If you compare two Punggol sunset photos, one may look intensely orange and the other nearly neutral. The difference can reflect actual light, white-balance decisions or both. Without knowing the camera settings, you cannot assign the change to smoke.
A fair documentation workflow records the approximate time, retains the original file and avoids aggressive white-balance changes. A RAW file, if supported by the device, preserves more editing flexibility than an aggressively processed exported image, but it still is not a PM2.5 measurement.
For a creative photograph, choosing a warm colour grade is an artistic decision. For an environmental evidence caption, describe it as a colour grade rather than silently presenting it as proof that the air was dangerously orange.
What smartphones add automatically
Modern phones often combine multiple frames, process HDR scenes, adjust local contrast, brighten faces and apply sharpening or noise reduction. Two devices photographing the same Punggol skyline can produce different amounts of apparent haze.
The effect may also vary with software versions and scene detection. A “scene optimiser” may make the clouds more saturated, reduce flat-looking atmospheric haze, or sharpen a distant building edge. Neither result provides a calibrated pollution value.
When documenting conditions, save the original photograph and avoid applying filters before making a comparison. Keep the device’s shooting mode and angle as consistent as practicable. If someone sends an image through a messaging app, note that the app may have compressed it or stripped useful metadata.
This is not a reason to reject all phone photography. It is a reason to distinguish a useful visual record from a numerical measurement of the atmosphere.
A worked example: two photos, one unchanged view
Imagine taking two copies of a fictional Punggol skyline photo at the same moment. Version A uses low contrast and a warm white balance. Version B uses higher contrast and a cooler white balance. In Version A, the distant towers appear soft and amber; in Version B, their edges look darker and the sky appears bluer.
Did PM2.5 decrease between the two copies? No. They came from one original scene. The appearance changed because of processing, so treating the visual difference as a pollution trend would be a category error.
Now imagine taking images at 8am and 6pm. They are genuinely different times, but their natural sunlight differs as well. You still cannot isolate particle changes from the photographs alone.
A fair report would say: “These images show the same viewpoint at two stated times, with editing information supplied separately. Check the NEA reading for air-quality context.” It would not attach an invented one-hour PM2.5 figure to either scene.
Can a long lens make the haze look worse?
A telephoto lens narrows the field of view and makes background elements appear larger in the frame. Distant buildings can seem compressed into one visual layer. Their apparent lack of contrast may become more prominent because the scene emphasises distance.
A wide-angle photograph may instead feature dark nearby structures and colourful foregrounds, making a similar atmospheric condition seem less prominent. Neither lens changes the physical concentration of pollutants in the air.
For educational comparison, keep focal length fixed where possible. Zooming between frames creates an additional variable. If a professional photographer wants to use lens compression creatively, that is entirely valid—but it should not become a claim about a different air-quality reading.
The focal length belongs in a technical caption when the comparison is meant to support an environmental discussion.
Backlighting, flare and haze-looking photographs
When the sun is near the edge of the frame or shines toward the lens, stray light may produce flare and lower contrast. A faint-looking skyline may be partly the result of glare rather than the actual air.
A simple safe demonstration uses two existing photos or a controlled indoor scene with a lamp: one with the bright source near the lens direction and one with the source out of view. Students can examine how the perceived contrast changes.
Avoid photographing the sun directly through high magnification or encouraging unsafe viewing through optical equipment. Normal camera safety applies, and no haze topic justifies risky optical experiments.
A photographer can reduce flare with appropriate lens positioning or shading. The scientific question is to document the lighting geometry before interpreting the image as evidence of an atmospheric effect.
Rain, mist and early-morning visibility
Punggol’s waterways, humid air and tropical weather create many visually interesting mornings. Moist air, mist and low clouds can make a scene appear grey, and rainfall changes what you see through a window. NEA cautions that visibility and smell cannot replace official pollutant measurements.
A student who sees distant towers disappear during rain should not announce an outbreak of smoke haze. A photograph can illustrate reduced visibility; the source of the reduction requires additional evidence.
Wipe a wet camera lens carefully before comparing images. Droplets on glass may create blur, streaks and glare that have nothing to do with particles suspended in the outdoor atmosphere.
If a windowpane is fogged, the photograph may show condensation on the glass rather than haze in the outdoors. That difference is easy to overlook when captions are written hastily.
Why you should not make a ‘PSI from photo’ calculator
Photographic pixel values depend on far more than pollution: scene reflectance, sun angle, distance, camera response, exposure, white balance, humidity and processing. A single Punggol skyline photo without carefully controlled reference information cannot be converted reliably into a public-health PSI value.
Researchers sometimes study visibility and optical measurements using specialised instruments and controlled methods. That work should not be confused with drawing a health conclusion from a generic phone photo or an image-enhancement app.
Even if a machine-learning system could classify certain scenes, it would require appropriate validation against measured air-quality data and rigorous testing under different weather conditions. A viral demonstration without those controls is not a certified monitoring service.
For actual data, use NEA’s monitoring FAQ and the site’s Punggol Haze Data Literacy guide.
The ethical caption: say what you know
A responsible environmental caption has four ingredients. State the place, the time and date, what is visually apparent, and what has or has not been measured. If you attach an official reading, include the source and indicator and avoid implying it was captured inside the photo itself.
Here is a sample caption format, not a claim about a real image: “Punggol residential skyline photographed at 6:20pm on [date]. Distant buildings appear pale in this view. Edited for brightness only. For the official North-region PM2.5 and PSI, see the NEA reading for the relevant time.”
A weaker caption would say “Punggol poisoned by PSI 300 smoke” based on colour alone. The drama may attract attention, but the conclusion could be false and the number lacks its required source and time.
Ethical captions are an especially useful English exercise: short enough for busy readers, precise enough to avoid confusing them.
Photo comparisons: how to make them fair
Choose a fixed and safe location, preferably one that does not require exposing yourself to poor air. Keep the same approximate camera position, framing, focal length and orientation. Note the shooting time, weather conditions and any editing.
If two images were taken at different hours, say so. If one was taken on a rainy day and another on a clear afternoon, note the weather. If the camera’s HDR or saturation settings changed, disclose that when the comparison is meant to be evidential.
Do not crop out a nearby bright building in one image and then present both crops as identical views. Do not paste a historical smoke photograph beside a recent clear photograph without accurately dating both.
The more variables that change, the weaker any inference about the role of pollution. This principle is basic experimental design translated into photography.
How photo evidence fits an environmental report
An environmental report can include a visual record, but it should also contain verified numerical evidence if the conclusion concerns measured air quality. For Punggol, the correct public regional context is North; the relevant timestamped official NEA dataset supplies the numeric evidence.
A sensible report structure is observation, official measurement, possible explanation, limits and practical implication. The photo belongs in the observation part. A dated NEA or ASMC update may support the explanation. The health advisory supplies the practical activity guidance.
The photograph should never be treated as if it independently shows the concentration of PM2.5 inside the body or proves a particular country’s fire was responsible.
For a language-learning version, see eduKateSG: Writing an Environmental Monitoring Report.
Safer creative alternatives during unhealthy outdoor conditions
If the current official advice calls for limiting prolonged outdoor exposure, postpone optional photo expeditions. Photograph familiar interior window views from a safe position, work on editing archived landscape images, make a photo essay about indoor routines or document a family haze preparedness plan.
A creative project might compare a coloured and monochrome edit of the same photograph and analyse how each changes the feeling of the scene. Another could explore the rule of thirds, leading lines and foreground framing using existing images of Punggol.
Do not open windows or go onto a windy balcony simply to create a better smoke photograph when outdoor air is poor. Nor should children be asked to spend a long time outdoors to collect “before and after” evidence.
For properly planned outdoor photography when conditions improve, the ordinary Punggol sunrise and sunset spots guide can supply location ideas, subject to current access and weather.
A ten-minute student exercise using one image
Give a student one Punggol skyline photograph with its date and location. Ask for two sentences describing what can actually be seen: for example, “The nearer block is dark, and the distant block appears paler. The sky is orange near the horizon.”
Next ask for two possible causes that the photograph alone cannot distinguish, such as low-angle sunlight and atmospheric scattering by moisture or particles. Finally ask which official source could provide air-quality measurements.
The completed exercise should not contain a fabricated PSI number. If an authentic reading is available for the same time and region, add it as a separate source with the correct units and label.
That small activity teaches optics, evidence, reasoning and clear writing without requiring an unsafe experiment.
Frequently asked questions
Does a red Punggol sunset mean the PSI is hazardous?
No. Sun angle, light scattering, moisture, particles and camera processing influence colour. Use NEA readings and the official health advisory for actual air-quality decisions.
Can I compare haze between two phone photographs?
You can compare appearance, but exposure, focal length, lighting and editing must be considered. Photos alone cannot establish equivalent measured PM2.5 concentrations.
Why do distant HDB blocks look grey?
Atmospheric perspective, humidity, smoke particles, backlighting and camera processing may all play roles. A pale skyline is not a calibrated instrument reading.
Is a photograph taken through a closed window useful?
Yes, for illustrating a scene or teaching composition. Remember that reflections, dirt and condensation on the glass can influence the image.
Should I go to Coney Island to photograph the haze?
Do not make a trip merely to seek smoke exposure. Follow current NEA health advice and NParks access conditions, and postpone optional long outdoor sessions when appropriate.
Can RAW photography measure PM2.5?
No. RAW preserves more image information for editing, but it does not turn an ordinary camera into a certified particulate-matter monitor.
Is a hazy photo suitable for a school Science project?
Yes, as visual evidence of appearance if accurately described and dated. Do not claim it proves a pollutant concentration or precise source without supporting measurements.
Where can I find Punggol’s actual PSI?
NEA reports Punggol within North, not as a separate block-level PSI. Use the timestamped official service for the appropriate metric.
Can I edit a haze photo for art?
Yes. Artistic editing is legitimate; just avoid using an extreme edit as purported proof of measured pollution without disclosure.
What caption is most reliable?
Use location, date/time, accurate description and editing disclosure. If a health-relevant value is included, cite the official indicator, region and time separately.
Continue through the Punggol haze library
The Punggol Haze Check handles immediate indicators. Why Is Punggol Hazy? explains smoke transport, visibility and rainfall. Punggol Haze Data Literacy teaches charts, units and source verification.
For outdoor route choices, use Punggol Waterway and Coney Island Haze Planning. For visual landmarks outside the haze context, see Punggol Photo Spots. This article’s unique purpose is how photographs communicate—and sometimes miscommunicate—air quality.
Official sources and evidence limits
Reviewed 17 October 2026. The featured Punggol image is illustrative of the townscape and is not certified evidence that a particular PSI level occurred when the image was taken.
- NEA: Air-Pollution FAQ, Visibility, Smell and Monitoring
- NEA: Live Haze Readings and Advisories
- MSS: Severe Weather, Smoke Haze, Mist and Fog
- NParks: Punggol Waterway Park
- Punggol Photo Spots and Sunrise/Sunset Guide
- eduKateSG: Writing an Environmental Monitoring Report
A striking skyline can inspire beautiful photography and thoughtful questions. The responsible photographer enjoys both, but never asks an image to provide a pollution number it cannot measure.
Punggol Haze: Connected Reference Library
For current air-quality decisions, consult NEA’s live PM2.5, PSI and health advisories. These different Punggol guides help with photography evidence, seasonal climate, urban infrastructure, car-cabin air and other haze questions without substituting old readings for current conditions.
- Punggol Haze Climate: El Niño, IOD, Monsoons and Fire Weather
- Punggol Haze Urban Design: Northshore, Green Buildings and Walkways
- Punggol Haze Car Cabins: Air-Con, Filters and Driving Safety
- Punggol Haze Check: PM2.5 and PSI
- Punggol During Haze: Family and School Routines
- Punggol Haze or Construction Dust?
- Reading PSI, PM2.5, Satellite Hotspots and Wind Maps
Continue Through the Punggol Haze Reference Library
Explore linked guides on photographic evidence, El Niño and fire weather, Punggol building design, and distinguishing local dust from regional smoke. For current decisions use NEA’s live air-quality information.
- Punggol Haze Climate: El Niño, IOD, Monsoons and Fire Weather
- Punggol Haze Urban Design: Northshore and Cleaner Indoor Spaces
- Punggol Haze vs Construction Dust: Local Air Pollution and Reporting
- Punggol Haze Check: One-Hour PM2.5 Versus 24-Hour PSI
- Punggol During Haze: Family and School Routines
- eduKateSG: Singapore Haze and Transboundary Smoke
- eduKateSG: Singapore PSI and Haze Monitoring


