
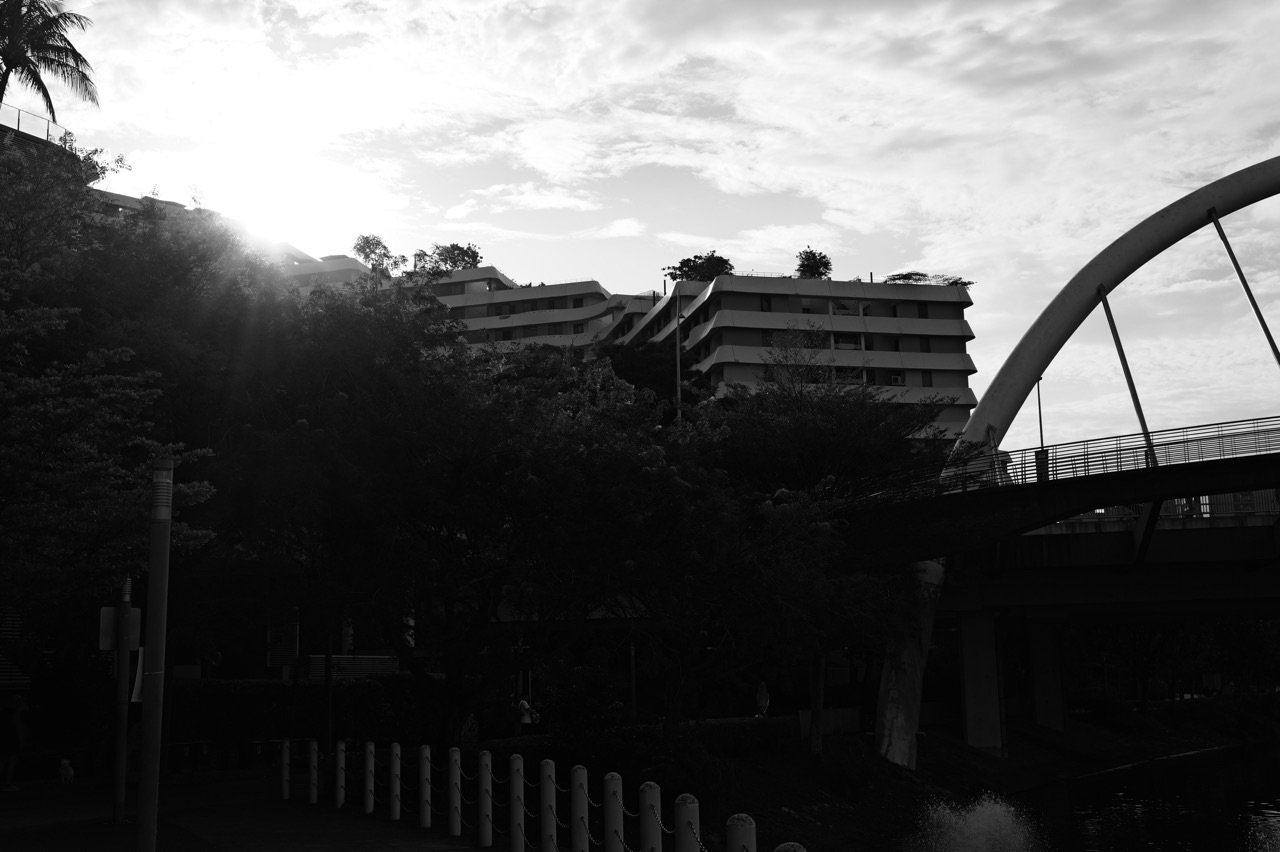
Does haze reduce electricity from solar panels in Punggol? Yes, it can. Smoke particles in the atmosphere can reduce the sunlight reaching a photovoltaic (PV) panel, even when the panel itself is working normally. A Singapore study of the June 2013 haze estimated PV yield losses of 15–25% under the investigated conditions. That is a historical research result, not an estimate of Punggol rooftop losses on 17 October 2026. Clouds, shade, panel temperature, soiling and system configuration also affect the output.
Punggol makes an especially interesting case because it was selected as Singapore’s first Eco-Town, and Treelodge@Punggol incorporated rooftop solar panels to help power shared services. If you are searching Punggol solar panels during haze, does PM2.5 reduce solar electricity, Treelodge Punggol solar energy, or haze impact on HDB rooftops, begin with the distinction between air quality, light reaching a panel and the electricity delivered. They are linked, but not interchangeable numbers.
Quick answer: five things to understand
- Smoke changes incoming sunlight. Aerosol particles can scatter or absorb light, reducing the solar radiation reaching panels.
- Clouds often matter too. A cloudy day and a smoky day can both reduce output, and a real day may involve both conditions.
- Panels do not stop working simply because there is haze. Output can change rather than going automatically to zero.
- HDB rooftop solar does not mean every flat is powered directly by its own roof. HDB describes solar installations that help serve common-area systems such as lifts, lighting and water pumps, with electricity arrangements depending on the project.
- Never estimate today’s Punggol solar loss from the PSI alone. A measured PV generation series, irradiance information and a suitable baseline are needed for a credible attribution.
The most immediately useful government source is the Energy Market Authority’s solar irradiance map, which shows changing estimated solar PV output and installed capacity across Singapore. It is not a clinical air-quality advisory, so use NEA’s live haze service separately for health and outdoor decisions.
Why this matters in a town built around green technology
HDB’s Punggol town profile explains that Punggol was selected as Singapore’s first Eco-Town in 2010. The town became a living laboratory for sustainable planning and smart technologies rather than simply a conventional housing expansion.
Treelodge@Punggol was completed in 2010 as HDB’s first eco-precinct, with rooftop solar, resource-saving systems and greener common areas. HDB’s 2022 green bond announcement specifically identifies photovoltaic panels among its sustainability features.
That makes haze a meaningful local education topic. When smoke reduces solar radiation, a clean-energy system may temporarily deliver less electricity, even though the underlying renewable technology remains valuable. Understanding this tension is better than claiming haze ‘turns off’ sustainability.
The question connects Atmospheric Science, Physics, Mathematics, Electricity, and town planning. Each supplies one necessary part of the explanation.
First understand photovoltaic electricity
A photovoltaic panel converts part of incoming light energy into electrical energy through semiconductor devices called solar cells. Sunlight contains photons at different wavelengths; some can generate electrical carriers in the cell, which the electrical circuitry collects as current.
At a high level, the amount of electrical energy produced depends on the light reaching the panel, the module’s characteristics, operating temperature, orientation, shading, wiring and system losses. This is why a panel may deliver different electricity at 10am, noon and 4pm.
A cloudy day does not mean zero electricity. Diffuse light can still reach panels, though total output may be lower than under a favourable clear sky. Likewise, smoke can affect the amount and spectral composition of incoming light without making a panel unusable.
Avoid turning the word ‘solar’ into an expectation of perfect, fixed daily generation. Weather-responsive variability is an ordinary part of renewable-energy planning.
How smoke particles alter sunlight
Haze contains a mixture of suspended particles whose sizes, shapes and chemical composition influence how they interact with light. Some particles scatter incoming light, changing its direction. Some absorb certain wavelengths, reducing the amount continuing along the original path.
As sunlight passes through a more particle-rich atmosphere, the direct beam arriving at the surface can be weakened. The diffuse component may also change. The outcome depends on the optical properties of the particles, sun angle, atmospheric conditions and the receiving solar technology.
This is different from an air purifier removing particles from a room. The solar panel does not clean the haze: it responds to the light that reaches its surface.
The regional nature of haze matters. Smoke can affect solar installations over a large area, but no individual Punggol roof has an automatically determined loss percentage merely because an air-quality index has increased.
What researchers found in Singapore’s June 2013 haze
A peer-reviewed research paper, On the impact of haze on the yield of photovoltaic systems in Singapore, published in Renewable Energy in 2016, analysed real photovoltaic systems during the severe June 2013 Singapore haze.
The researchers used a method to help distinguish smoke-related attenuation from ordinary cloud variability and analysed ten PV systems. They estimated 15–25% PV yield losses for the conditions investigated during that historical haze event.
That is important evidence of a physical effect, but it must not be quoted as ‘Punggol loses 25% of rooftop electricity whenever PSI is unhealthy.’ The study concerns a particular event, selected systems and analytical methods.
Scientific research becomes useful when its scope, time and uncertainty travel with the number. Remove those details and a credible result turns into an unsupported local claim.
A more recent research perspective
A 2022 review, A Review of the Effects of Haze on Solar Photovoltaic Performance, summarised mechanisms such as reduced irradiance, changes in the solar spectrum reaching modules and surface soiling.
The review explains that different PV technologies may respond differently to changes in the spectral distribution of light. A reduction in overall sunlight intensity is not the only technical consideration.
A separate 2018 study in Energy & Environmental Science examined urban air pollution and sunlight reaching PV panels, including data from Singapore. This connects the short intense episode to the broader issue of air pollution’s effects on renewable generation.
Neither article publishes a real-time result for the roof of a named Punggol block in October 2026. Use them as evidence of general and historical mechanisms, not as invented performance telemetry for a particular estate.
Why haze and clouds must be separated
A solar-output graph may dip on a day when haze is reported. Did smoke cause all the loss? Not necessarily. Cloud movement, which EMA lists as a key contributor to changing solar output, can make generation fluctuate rapidly.
Consider two hypothetical afternoons. Both have the same measured PM2.5 concentration, but one is mostly cloudless and the other has thick moving clouds. Their solar output may differ considerably. A dataset limited to particle concentration would miss important influences.
That is why a responsible analysis needs a suitable comparison: similar sun angle, cloud conditions, season, relevant panel characteristics and available irradiance information.
An online headline that compares noon today with late afternoon yesterday and blames the entire difference on haze is not rigorous. Time of day alone changes the sunlight available.
Punggol’s solar history: Treelodge@Punggol
HDB’s Treelodge@Punggol materials describe rooftop solar photovoltaic panels as part of the eco-precinct’s renewable-energy features.
These panels were designed to supply electricity for common services, including lift operation and common-area lighting. The important point is not that every resident owns a separate rooftop PV unit, but that shared facilities can use renewable electricity.
HDB’s broader sustainability initiatives subsequently expanded rooftop solar deployment through suitable housing developments. Its Green Innovations programme explains that electricity generated on HDB rooftops supports common services, with excess generation directed into the power grid under the applicable arrangements.
A particular estate’s installation status and ownership arrangements should be checked before claiming its roofs have panels or that every apartment receives a direct solar bill credit.
What SolarNova contributes to Singapore
HDB and the Singapore Economic Development Board developed the SolarNova programme to aggregate public-sector demand for photovoltaic projects. HDB’s April 2023 announcement described its eighth tender, covering rooftop installations across 1,075 HDB blocks and 104 government sites, with an expected capacity of 113 MWp.
A rooftop PV project is part of a larger national renewable-energy system. Punggol’s eco-town history helps make that national strategy visible locally, but its output is affected by normal solar-resource variability like any other photovoltaic installation.
Megawatt-peak (MWp) is a rated capacity under specified testing conditions. It is not a guarantee that a system supplies exactly that many megawatts every minute. Actual energy depends on available sunlight and performance.
When a historical haze event cuts sunlight, the operational response involves modelling and managing variability—not abandoning renewable-energy development.
What EMA’s solar irradiance map actually shows
The Energy Market Authority publishes a solar irradiance map with estimated PV output and installed PV capacity. EMA explains that estimated generation varies with sunlight, clouds and shade.
The map is designed to visualise variation in solar conditions and estimated output, not to certify PM2.5 exposure. It should not be used to tell a resident whether their child may exercise outside.
Similarly, an NEA PSI number does not reveal the actual kilowatt-hours supplied by a particular rooftop PV system. Air-quality indices and power-generation figures are based on different physical measurements.
A careful researcher can view both services, but needs an appropriate analytical method before attributing a particular output change to haze rather than changing clouds or system performance.
Worked example: a hypothetical reduction in solar electricity
Imagine a fictional solar installation that would otherwise produce 100 kWh during a specified interval under comparable clear conditions. Suppose the actual generation over that interval is 82 kWh.
The observed shortfall is 100 − 82 = 18 kWh. Expressed relative to the baseline, 18 ÷ 100 × 100% = 18%. These are valid calculations about two invented energy figures.
But the difference is not automatically an 18% haze-induced loss. Clouds, temperature, orientation, soiling or temporary system conditions could also be responsible. We would need a suitable comparison method to isolate the contribution of haze.
That last sentence is the most valuable part of the exercise. The arithmetic is simple; causal attribution is the scientific challenge.
Another worked example: energy versus capacity
Suppose a hypothetical rooftop array has a 20 kW nominal power rating and operates at an illustrative average equivalent of 50% of that rating for four hours. Its output would be 20 × 0.5 × 4 = 40 kWh.
Now suppose a second scenario has an average equivalent of 35% for the same four hours. Its output would be 20 × 0.35 × 4 = 28 kWh. The difference is 12 kWh.
This demonstrates why an installed capacity in kW is not the same as energy generated in kWh. The numbers are hypothetical and do not represent a real Punggol installation or measured haze event.
The relative reduction between the illustrative scenarios is 12 ÷ 40 × 100% = 30%, but that percentage would still require careful evidence before being described as a smoke-only effect.
Why a hazy sunset cannot predict PV generation
Residents sometimes see an orange evening sky and infer that the rooftop solar array must have produced almost nothing that day. The reasoning fails because a sunset photograph covers a short period, at low sun angle, after many daytime hours have passed.
The solar system may already have generated substantial electricity earlier in the day. The colour of the sunset does not reconstruct the irradiance curve from morning to evening.
Camera settings, humidity, lighting and atmospheric particles also shape the photo. A photo does not capture a calibrated PV power meter.
For a deeper photography explanation, see Punggol Haze Photography. The solar question requires a generation time series, not a dramatic colour grade.
Does smoke settle on panel surfaces?
Fine particles, dust, pollen and other material can accumulate on exposed solar modules. This phenomenon is often called soiling, which may affect how much light passes through the front surface.
Soiling is related to, but different from, atmospheric attenuation. The first involves material on the panel surface; the second involves material between the sun and the panel. A smoky day can influence atmospheric light without every panel becoming visibly dirty.
Rain may remove some loose deposits, but cleaning effectiveness depends on the material, module characteristics and site conditions. Never assume a rain shower restores exactly 100% of original performance.
For HDB roofs and other installed systems, cleaning and maintenance must be handled by authorised, trained personnel. Residents should never enter restricted roofs or climb a building to wipe a solar module after haze.
Safety: rooftop cleaning is not a household chore
Photovoltaic installations include electrical equipment, elevated work areas and access restrictions. An HDB resident noticing a dull-looking panel from a distant window should not attempt to reach it.
Unauthorised rooftop access introduces fall, electrical and building-safety risks. The appropriate route for a suspected maintenance issue is through the relevant building or system operator, not a family member improvising a hose, ladder or pressure washer.
Even professional cleaning needs proper procedures for modules, wiring, safe isolation where applicable, working at height and material compatibility.
A general haze article cannot certify that a particular panel needs cleaning. The need should be assessed using appropriate maintenance and performance evidence.
Can reduced solar generation raise everyone’s electricity bill?
Not automatically. The effect on an individual household’s bill depends on how electricity is supplied, metered and purchased, and on the particular solar ownership and contract arrangement.
HDB commonly describes rooftop solar electricity supporting common-area services. A reduction in common-area PV output does not mean every flat receives an immediate bill line labelled “haze solar surcharge”.
Consumers purchasing electricity through the grid generally pay according to their electricity plan and metered usage. Broad energy-market effects are more complex than one roof’s generation change.
If a household actually owns a relevant private rooftop PV installation or has a specific arrangement, its output and financial settlement should be assessed using the real contract and metered data. Avoid promising either extra charges or savings from vague town branding.
Is solar power still useful in a haze-prone region?
Yes. Temporary reductions in production do not make renewable energy worthless. All energy systems have operational constraints: solar varies with irradiance, wind power varies with wind, and conventional generation has maintenance and fuel-related risks.
An integrated electricity system manages variability through forecasting, system operations, other generation and suitable infrastructure. Solar contributes lower-carbon electricity when conditions allow.
Reducing regional haze can offer multiple benefits, including public health, visibility and potentially improved conditions for solar generation. This makes fire prevention complementary to renewable-energy development.
The correct question is not “Why install solar panels if haze sometimes happens?” It is “How can renewable systems be designed and operated using realistic environmental conditions?”
What engineers measure before blaming haze
A credible assessment may examine solar irradiance, PV output, module temperature, cloud data, cleanliness of the modules, panel technology, orientation and system availability.
A performance ratio or normalised yield may help compare systems under certain conditions. Researchers also use carefully matched clear-sky or cloud-filtered reference data to isolate possible haze effects.
Even then, model uncertainty needs to be considered. A single low-output hour is not proof of smoke damage, a faulty panel or deliberate energy wastage.
A source that publishes only a percentage drop without baseline conditions or method is incomplete. Good energy analysis makes its denominators explicit.
Why energy resilience is also a town-planning issue
Punggol’s urban development links energy-efficient buildings, shared infrastructure and local renewable generation. That wider context is described by HDB’s Green Innovations and Punggol town overview.
Haze reminds us that environmental systems interact. Air quality influences health decisions; weather and smoke can affect incoming sunlight; building design determines cooling and electrical needs; the grid balances changing supply and demand.
A resilient neighbourhood plans for these interacting conditions without promising uninterrupted perfect renewable output. Reliable public information and realistic engineering assumptions are part of sustainable development.
For the related question of building ventilation and comfort, see Punggol Haze and Urban Design.
A 30-minute Science and Mathematics activity at home
Start with two fictional daily energy values: 45 kWh on a comparison day and 36 kWh on a second day. Calculate the difference (9 kWh) and the relative reduction (20%).
Next ask the student to list at least four factors that might explain it: cloud cover, smoke, temperature or temporary equipment availability. Identify what additional measurement would help distinguish them.
Finally, ask the student to label each number with the correct unit and write a conclusion that includes uncertainty: “The hypothetical system generated 20% less energy in the second scenario, but the causes are not established by these two figures.”
This teaches ratios, energy units, data interpretation and scientific humility without taking a child outdoors during poor air.
Frequently asked questions
Can haze reduce the output of Punggol solar panels?
Yes. Suspended smoke particles can attenuate incoming sunlight. A Singapore study of the June 2013 event reported 15–25% yield losses among the investigated PV systems, but that is not a measurement of today’s Punggol rooftops.
Do solar panels stop producing electricity in haze?
No. They may still receive direct and diffuse sunlight, although generation can be reduced. The effect varies with conditions and panel technology.
Did Treelodge@Punggol have rooftop solar panels?
Yes. HDB identifies rooftop solar PV as part of the completed 2010 eco-precinct, helping supply common-area services.
Does every Punggol HDB block have panels?
Do not assume that. HDB has expanded rooftop solar across suitable developments, but individual installation status should be confirmed through the appropriate official or estate information.
Does a high PSI mean a precise percentage drop in solar energy?
No. PSI is an air-quality index, not a solar irradiance or electricity measurement. A valid performance estimate needs appropriate solar and system data.
Can EMA’s solar map tell me whether the air is healthy?
No. EMA’s solar irradiance map concerns estimated PV output and sunlight conditions. Use NEA for health-relevant air-quality information.
Are haze particles and dirt on a solar panel the same problem?
No. Atmospheric smoke attenuates light before it reaches the module, while soiling is deposited material on the surface. Both may influence output through different pathways.
Can residents clean rooftop panels after haze?
Not unless they are authorised and qualified to access and maintain the installation. HDB roofs and PV equipment involve restricted access and serious safety risks.
Does reduced solar production directly increase my flat’s bill?
Not necessarily. HDB rooftop PV commonly supports common services, while households have their own metering and supply arrangements. A particular financial claim needs the actual contract and measured usage.
Is solar still worthwhile if haze occurs occasionally?
Yes. Renewable generation is planned with weather and operational variability. Haze is one variable to consider, not proof that solar energy has no value.
Continue across the eduKate haze and energy ecosystem
For the physics of regional smoke, read Why Is Punggol Hazy?. For weather and El Niño, see Punggol Haze and Climate Change. For resident electricity spending, see Punggol Haze Household Costs.
For the wider built environment, follow Punggol Haze and Urban Design. For reading different measures correctly, see Punggol Haze Data Literacy. These pages deliberately distinguish energy generation, personal bills, outdoor pollution and town planning.
Official sources and research note
Reviewed 17 October 2026. Any loss percentages quoted from research are historical, not claimed as live Punggol PV telemetry. Worked energy figures are fictional and explicitly described as teaching examples.
- HDB: Punggol’s Eco-Town history
- HDB: Treelodge@Punggol and rooftop solar
- HDB: Green Innovations and Solar Panels
- HDB: SolarNova and rooftop solar tenders
- EMA: Singapore Solar Irradiance Map
- Nobre et al. (2016): Haze impact on Singapore PV yield
- Sadat et al. (2022): Review of haze and PV performance
- NEA: Current official air-quality and haze advisories
Haze and solar energy tell a useful story about connected systems. The particles in the air can change sunlight, the sunlight can change PV output, and the electricity network must accommodate variation—without confusing any one of those measurements with the others.
Punggol Haze: Myths, Water, Solar Energy and Waste
Continue through the connected Punggol haze reference library. For current air-quality and health decisions consult NEA’s official live guidance.
- Punggol Haze Myths vs Facts: 25 Questions
- Punggol Haze and Water Quality: Reservoirs and Tap Water
- Punggol Haze Waste: Masks, Filters and Responsible Recycling
- Punggol Haze Check: PSI versus PM2.5
- Punggol Haze at Home: Windows, HEPA and Indoor Air
- eduKateSG: Transboundary Haze and Global Connectivity
New Reference: Why Peat Fires Smoulder and How Restoration Works
Explore the upstream environmental repair behind regional haze: drained peatlands, underground smouldering, water-table restoration, revegetation, local fire prevention and ASEAN’s 2023–2030 strategy. This is a long-term source-prevention explainer, not a substitute for current air-quality advice.
Punggol Haze and Peatland Restoration | Why Underground Fires Smoulder and How Rewetting Helps


