
Singapore’s PSI uses six criteria pollutants, not just PM2.5: fine particulate matter PM2.5, particulate matter PM10, ozone (O3), nitrogen dioxide (NO2), sulphur dioxide (SO2), and carbon monoxide (CO). NEA monitors their ambient concentrations and derives pollutant-specific sub-indices; the highest sub-index is reported as the rolling 24-hour PSI. During transboundary haze, PM2.5 is generally the leading concern, so NEA also publishes its one-hour concentrations for immediate activity decisions. Punggol and Sengkang are in NEA’s North reporting region.
The practical answer for Punggol families is straightforward. For exercise or outdoor play happening now, use NEA’s current one-hour PM2.5 and MOH’s activity advice, taking age and medical conditions into account. For tomorrow’s plans, look at the forecast 24-hour PSI and actual school or event notices. This guide explains all six pollutants and their underlying science, the PSI calculation, why carbon monoxide differs from CO2, original worked Mathematics examples, and common misconceptions about photographic visibility and air-quality apps. A pollutant index cannot diagnose someone or identify every indoor exposure.

Which pollutant is measured, and why?
Particles and gases are different physical substances. PM2.5 is a subset of PM10 based on particle size; ozone, NO2, SO2 and CO are gases with different chemical properties and pollution sources. A single smoky photograph cannot reveal their individual concentrations, and a bedroom’s consumer particle screen cannot calculate the overall PSI. Singapore added PM2.5 to the PSI in April 2014. The current network covers six criteria pollutants, according to the NEA official FAQ.
PM2.5: why fine particles dominate transboundary haze
PM2.5 means particles with an aerodynamic diameter around 2.5 micrometres or smaller. It is a particle-size category, not a single chemical compound or proof of a particular source. Combustion from vegetation and peatland fires commonly produces a substantial fine-particle component; traffic, cooking and atmospheric chemical processes may also contribute. Such particles can penetrate the respiratory system, and NEA identifies PM2.5 as the predominant pollutant during regional haze episodes. The reason to monitor it separately is not that the other five pollutants have stopped existing, but that fine particles can change rapidly as winds and mixing alter smoke transport.
NEA provides an hourly PM2.5 concentration to help the public understand immediate conditions. MOH’s 2026 activity guidance uses Normal (0–55 µg/m³), Elevated (56–150), High (151–250) and Very High (251 or more). These are one-hour concentration descriptors, not the WHO’s 24-hour guideline or Singapore’s PSI index points. A Punggol runner should apply the current activity advice and their own health status rather than interpret a green fitness-watch score as permission to ignore the measured outdoor particles.
PM10: why the bigger category includes PM2.5
PM10 means particles around 10 micrometres or smaller, so the smaller PM2.5 portion sits within PM10. It is wrong to treat the two readings as non-overlapping piles of material and automatically add them. Coarser road or construction dust can influence the larger fraction, while fine combustion particles often contribute to the smaller portion. A photograph of a dusty road does not distinguish the entire particle size distribution or quantify the fine fraction, and a Punggol resident should not conclude that every PM10 rise came from transboundary fire smoke.
Consider a hypothetical school experiment with comparable PM10 = 80 µg/m³ and PM2.5 = 45 µg/m³. Under the simplified assumption that the measurements are directly comparable, the coarse portion between roughly 2.5 and 10 micrometres is 80 − 45 = 35 µg/m³. Adding the two concentrations to get 125 would double-count PM2.5. Real instruments can have different uncertainties, so the calculation is a teaching example, not a live Punggol reading or an exact laboratory procedure. The First Principles lesson is to check whether sets overlap before adding their quantities.
Ozone: beneficial higher up, a pollutant near the ground
Ozone contains three oxygen atoms and has the formula O3. High in the stratosphere it absorbs some ultraviolet radiation, while near the Earth’s surface it is an air pollutant. Ground-level ozone can form from photochemical reactions involving nitrogen oxides and volatile organic compounds in sunlight. That makes it fundamentally different from the PM2.5 smoke particles that dominate many haze conversations. A blue-looking skyline does not prove there is no ozone; a murky photograph also cannot tell you the O3 concentration.
This chemical distinction matters at home. Some consumer air-cleaning products intentionally release ozone under marketing descriptions such as active oxygen. The presence of ozone in the outdoor PSI is not a reason to add it to an occupied bedroom: ozone can irritate the respiratory system and is not a proven safe replacement for particulate filtration. Families should consider mechanical smoke cleaning with documented performance rather than interpreting a fresh smell as proof of safe air. NEA’s monitoring and the US EPA’s ground-level ozone guidance provide the underlying science.
Nitrogen dioxide: combustion and atmospheric chemistry
Nitrogen dioxide (NO2) is a reactive gas associated with combustion and atmospheric transformations, including road transport and some stationary sources. It also participates in processes leading to ground-level ozone and secondary particles. A Science student observing buses near Punggol MRT may correctly describe traffic as a possible NO2 source, but a photograph of vehicles cannot determine a regional pollutant concentration or prove how much of a particular PSI reading arose from those buses. Weather, chemical reactions and other sources also matter.
Singapore monitors NO2 as a separate criteria pollutant and calculates its own sub-index for the daily PSI. It must not be mistaken for PM2.5 simply because both can relate to combustion. The distinction becomes useful in explanations of air pollution: particles have size distributions; NO2 is a gas with its own chemistry and measurement method. A responsible parent or student should distinguish a possible source from evidence of what actually reached a monitoring station.
Sulphur dioxide: combustion-related gas, not every smoky odour
Sulphur dioxide (SO2) contains one sulphur atom and two oxygen atoms. It can be emitted by burning sulphur-containing fuels and certain industrial processes and can contribute to respiratory irritation and secondary atmospheric chemistry. NEA includes it in its monitoring system because public air quality involves more than fine particles. The presence of an irritating odour near an HDB corridor, however, does not prove that sulphur dioxide is the leading local substance. People can smell many different compounds that are not synonymous with one PSI pollutant.
A classroom explanation should separate what the compound is, which broad activities can generate it and what data would be needed for source attribution. Neither the colour of a sunset nor the presence of a nearby worksite identifies the SO2 concentration. If there is a credible immediate fire or chemical danger, follow emergency safety rules rather than debating the daily index. For non-emergency odours, record the facts and use the correct environmental or property-management route without accusing someone on the basis of smell alone.
Carbon monoxide CO is not exhaled carbon dioxide CO2
Carbon monoxide (CO) is produced by incomplete combustion and can interfere with oxygen transport in the body at sufficiently high exposures. Carbon dioxide (CO2) is a different gas that people exhale and is often monitored indoors as a proxy for ventilation adequacy. Singapore includes carbon monoxide among the six outdoor PSI pollutants, but ordinary indoor CO2 is not an additional seventh PSI pollutant. A family should not read an HDB study-room display marked ‘CO2 900 ppm’ as though it were a carbon monoxide measurement or today’s ambient PSI.
This is also a safety distinction. Dangerous carbon monoxide may accumulate locally when fuel-burning equipment is used inappropriately in enclosed spaces. An ambient NEA regional reading cannot certify the safety of that individual room, and a normal PM2.5 display cannot rule out CO poisoning. Do not operate a petrol generator, charcoal cooking appliance or other unsafe fuel-burning device in a Punggol flat or enclosed balcony. If poisoning or fire danger is suspected, move to safety and seek appropriate emergency help rather than studying the haze map.
How NEA derives the overall PSI from six sub-indices
NEA monitors individual pollutants and uses the relevant pollutant-specific concentrations and conversion breakpoints to derive sub-indices. The largest sub-index becomes the reported rolling 24-hour PSI. The highest-of-six principle is crucial. It is not correct to simply add the measured gas concentrations, since they may be expressed in different units, and it is not correct to take their arithmetic average as the PSI. One pollutant can determine the overall value while other monitored substances have lower sub-indices.
Imagine six completely fictional, already-converted sub-indices: PM2.5 118, PM10 74, O3 58, NO2 41, SO2 27 and CO 12. The PSI would be 118, not their sum and not their average. The numbers here are sub-indices, not concentrations in µg/m³. A student calculating the actual index would need official pollutant-specific methods and measured concentrations. This example only teaches the ‘largest value’ rule and must never be presented as the measured North-region PSI on 19 October 2026.
Why hourly PM2.5 and 24-hour PSI can change differently
The one-hour PM2.5 concentration describes a recent hour’s fine-particle mass in the air. The 24-hour PSI summarises a longer rolling period and uses multiple pollutant sub-indices. If a smoke plume reaches Singapore rapidly, the immediate one-hour fine-particle reading may increase well before the daily summary moves to the same apparent extent. Conversely, the current hourly concentration may improve after a rain event or wind change while the daily PSI continues reflecting earlier elevated conditions. That is how different averaging periods behave, not a signal that the monitoring service is faulty.
A simple classroom example: twenty-three hourly PM2.5 averages are 12 µg/m³ and one hour is 108 µg/m³. The arithmetic daily mean is (23 × 12 + 108) / 24 = 16 µg/m³. The one hour of 108 and the much lower daily mean can coexist. The result of 16 is not a PSI: the actual PSI requires pollutant-specific sub-index calculations across the criteria pollutants. This illustrates the need to label hours, units, and the difference between a concentration and a numerical index.
Use the North reporting region for Punggol and Sengkang
NEA publishes national reporting values for North, South, East, West and Central Singapore. Its FAQ includes Punggol and Sengkang in the North region, together with other northern places such as Sembawang, Yishun, Woodlands and Seletar. A WhatsApp screenshot of the South region may be meaningful for somebody in another part of the island, but it is not automatically the most relevant North-region public report for a Punggol family. Check the region and timestamp before using the data.
The North regional value is not a sensor sitting at every Punggol block, park connector or bedroom. Indoor cooking, open windows, purifier use, local ventilation and variations near buildings can create differences from a small private sensor. A consumer device may use optical particle detection rather than the more specialised methods of the NEA network. Different readings are not automatically evidence of bad faith; they often represent different locations and sampling arrangements. Use the official regional reading for public haze decisions rather than turning one bedroom estimate into a national announcement.
The one-hour PM2.5 categories are not PSI categories
For immediate one-hour PM2.5, MOH’s Normal range is 0–55 µg/m³, Elevated is 56–150, High is 151–250, and Very High begins at 251. The separate 24-hour PSI index has Good 0–50, Moderate 51–100, Unhealthy 101–200, Very Unhealthy 201–300 and Hazardous above 300. The same numeral can refer to a different quantity depending on whether the screen displays concentration or an index. An app calling an AQI value of 150 ‘the PSI’ needs verification of its source and conversion system.
The physical exertion of the planned task and a person’s health also matter. A short necessary walk from Punggol MRT to a clinic is different from an hour of vigorous sport at Waterway Park. A child with asthma may have a clinician-directed plan more conservative than a healthy adult’s general routine. For school and event closures, follow dated notices from the responsible institution. The presence of a number in a parent chat cannot authorise or cancel an exam, sporting fixture or work shift by itself.
Why an orange Punggol sunset cannot identify pollutants
Light scattering depends on particles, humidity, clouds, sun angle and camera exposure. NEA warns that a visually hazy day does not necessarily mean the air has a proportionately higher particle concentration. Some odours can come from gases that are detected by smell at low concentrations, while other harmful gases, including carbon monoxide, lack a distinctive smell. A skyline photograph cannot identify which of PM2.5, PM10, ozone, NO2, SO2 or CO has the largest sub-index.
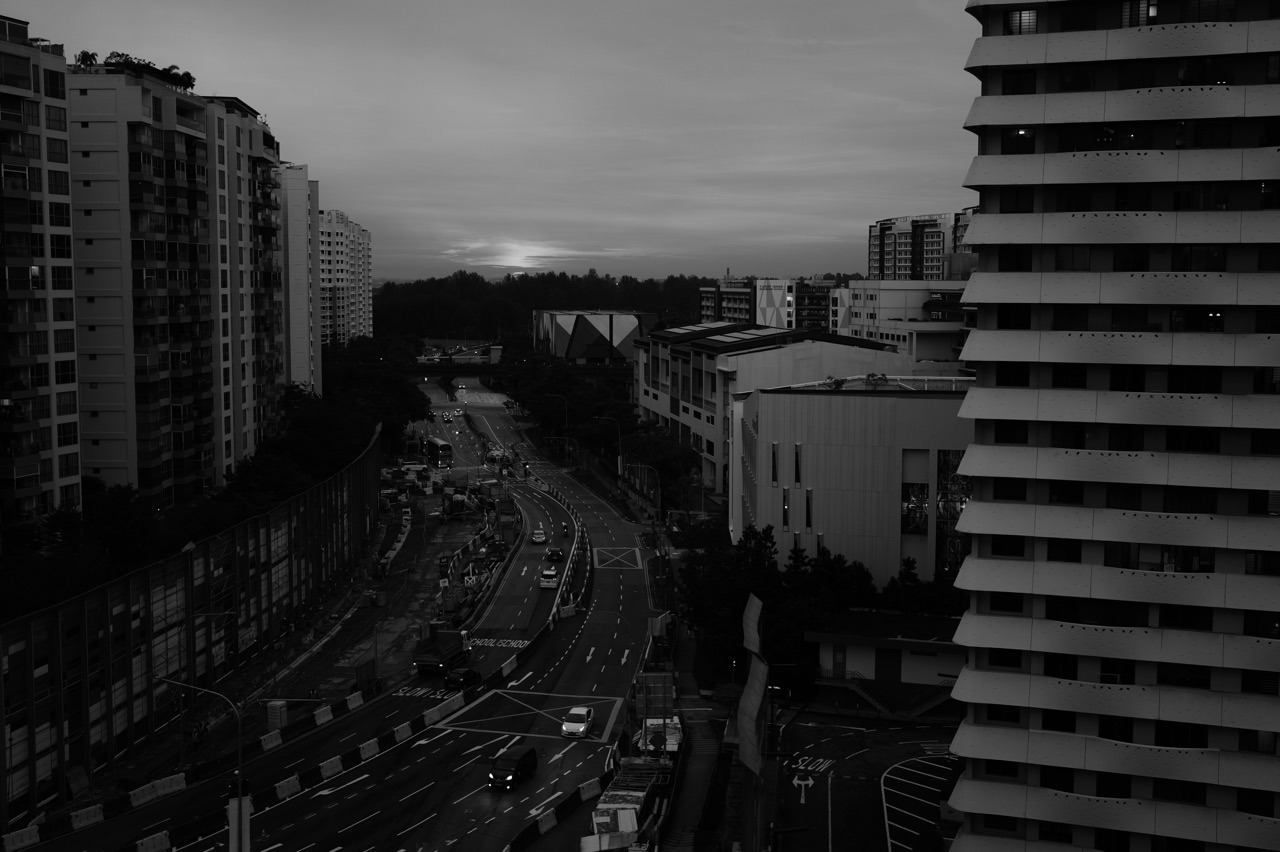
That distinction is especially relevant around Punggol Waterway Park or the HDB rooftops at sunset. A photographer may deliberately heighten contrast, saturation or exposure to create a compelling image. Such creative choices do not change NEA’s measured pollutant data. A reader who needs to decide about running, cycling or children’s play should consult the latest official readings rather than rely on an edited photograph or how distant apartment blocks appear. If visible smoke indicates a real local fire, emergency safety measures override the daily index debate.
Some pollutants form after they are emitted
Air pollutants can be released directly from combustion and other sources, but atmospheric chemistry also produces secondary pollutants. Nitrogen oxides and volatile organic compounds react under sunlight and can contribute to ground-level ozone. Sulphur dioxide and nitrogen dioxide can participate in reactions that lead to secondary aerosol particles. The air is a changing system, with wind, moisture and radiation affecting chemical transformations rather than each pollutant simply moving unchanged from one source to one station.
For Punggol Secondary Science, the useful distinction is between a primary emission and a secondary pollutant formed later. Ozone near the surface is a strong example of photochemical formation; fine secondary particles are another. A student should avoid claiming that each ozone molecule must be emitted directly by a traffic vehicle. Equally, regional smoke moving from forest fires may change as it travels. A single map of satellite fire hotspots cannot quantify local NO2 or ozone without measurements and appropriate chemistry and meteorology.
What a sensor, a satellite and the PSI each tell us
NEA’s monitoring network measures ambient pollutant concentrations at physical sites. A satellite may show large fire thermal anomalies or visible smoke plumes, while a consumer indoor PM2.5 monitor estimates fine particles close to its own inlet. These instruments are built for different questions. A satellite hotspot is not a ground-level PSI reading at Punggol; a local particle sensor does not measure all six PSI pollutants; a daily regional PSI does not reveal the exact fine-particle concentration at a given desk.
A scientifically responsible article retains the source, measurement location, unit, timestamp and averaging window. For a present outing, the official one-hour PM2.5 and MOH advice are most actionable. For a Geography research project, the broader satellite and wind maps can help reason about possible sources, while noting gaps from cloud cover and unresolved plume heights. For indoor air, actual ventilation and pollution sources need attention. Combining images without these distinctions can create a false impression of precision.
Why WHO guidance does not directly convert into today’s PSI
WHO’s 2021 air-quality guideline recommends an annual mean PM2.5 of 5 µg/m³ and a 24-hour guideline of 15 µg/m³, defined through a 99th-percentile evaluation of daily means over a year. These are health-based benchmarks, not identical to Singapore’s one-hour Normal category or PSI index points. Even though some readings share the unit µg/m³, their averaging periods and policy purposes differ. A headline claiming NEA has contradicted WHO by labelling a one-hour value of 55 Normal removes the crucial time scale.
For a health-policy study, use representative annual or properly averaged daily measurements and the correct WHO definition. For Punggol’s immediate activity decisions, follow current NEA and MOH local guidance. One type of source does not cancel the usefulness of the other. Older Singapore target documents also describe historic policy milestones and should not be treated as a new 2026 legal threshold without an updated official announcement. A student can discuss these differences while keeping the clinical needs of individual children and older residents distinct.
A Science lesson linking six pollutants to one decision
Imagine three fictional Punggol situations: a Primary 4 child wants a playground visit, a Secondary 3 student plans interval running and an older resident needs a short necessary journey to a clinic. All may see the same public North region, but the tasks involve different durations and exertion. The student can first list the six PSI pollutants and identify which size categories overlap. Then use a fictional set of sub-indices to find the maximum and explain why it becomes the PSI. Finally, ask which source governs each actual activity decision.
The best answer recognises that the measured index alone cannot determine an individual’s health or a school’s operating status. The child needs age-sensitive advice, the runner must consider strenuous exposure, and the older person may have additional medical precautions while essential travel continues as appropriate. The class can include a hypothetical air-quality screenshot but must mark it as made up. This approach develops First Principles reasoning—define the quantity, identify the decision, and avoid unjustified inference—without repeating a memorised slogan about air pollution.
An original pollutant identification worksheet
Give students six descriptions without the chemical abbreviations: fine smoke particles, inhalable larger dust, sunlight-related ground-level gas, nitrogen-related combustion gas, sulphur-bearing combustion gas, and a gas created by incomplete combustion. Ask them to map those descriptions to PM2.5, PM10, O3, NO2, SO2 and CO. Follow with the question, ‘Which one is included in another size category?’ A strong pupil will say PM2.5 sits within PM10 rather than treat them as independent piles.
For a second question, show six fictional already-calculated sub-index scores and ask for the highest value. A pupil must also explain why the average or sum is not the published PSI. Extend the task by adding a hypothetical one-hour PM2.5 reading with a concentration unit and ask why it cannot be compared directly with a PSI point. A worksheet succeeds when the student reads the units and definitions, not when they simply remember a chart colour. None of the supplied numbers represents current North-region monitoring.
A parent chat claim that mixes PM2.5 with CO2
Suppose a Punggol parent posts that a home CO2 meter shows 1,100 ppm and concludes the ‘Singapore PSI must be 1,100’. That is incorrect. CO2 describes a different gas and the room’s ventilation context, while outdoor PSI derives from six monitored pollutants, including carbon monoxide CO rather than ordinary exhaled CO2. The home value and official index use different instruments, scales, locations and purposes.
An appropriate reply is concise: ‘CO2 and CO are different gases. The room CO2 meter does not calculate regional PSI. Please check NEA’s North-region report for outdoor conditions and examine ventilation separately.’ The correction does not dismiss a real concern about a stuffy room; it identifies the correct next question. A portable HEPA cleaner may lower particles without removing exhaled CO2, another reason not to call a low PM2.5 display a complete indoor-air health clearance.
What do I do when my neighbourhood smells smoky?
A smoky odour may occur during regional haze, local cooking, incense, road activity, rubbish or other sources. Odour alone cannot determine the chemical identity or amount of the six PSI pollutants. First distinguish a real emergency from a non-emergency annoyance. If there are flames, unusual dense smoke from a property or credible danger, follow fire-safety instructions promptly rather than waiting for the next hourly public reading.
If no emergency is present, reduce avoidable exposure and consult the official NEA information. Persistent local problems can be documented with dates and observations, without inventing gas concentrations or accusations about particular workers. A regional PM2.5 rise and an indoor cooking emission might happen at the same time. The practical questions are which pollutant is actually measured, where the suspected local source is, and whether an appropriate environmental or building-management report is warranted.
How to share a responsible air-quality graph
A useful chart has the pollutant name, unit or index scale, location, timestamp and averaging period visible. If it is one-hour PM2.5, label the vertical axis µg/m³. If it is PSI, do not label the index as the mass of fine particles. If presenting the pollutant-specific sub-indices, identify them as sub-index scores and use the maximum principle only under the actual documented method. A clear graph can do more for families than a dramatic screenshot of the horizon.
Students learning coding may download NEA data through official government sources, but they should not silently convert missing readings into zero or relabel a time series under a different index. Show a data dictionary and explain the difference between an observation, an estimate and a forecast. A hypothetical teaching chart should say ‘illustration’; a current public health statement should link the original NEA dashboard. This helps avoid misinformation in school assignments and neighbourhood chat groups.
The daily decision checklist for Punggol
Before an outdoor family activity, ask five questions: Is this a one-hour PM2.5 concentration, a 24-hour PSI index or a forecast? Is the North region selected? Is the value current? What duration and exertion are involved? Does anyone need more cautious clinical guidance? Those questions are more useful than manually computing the six sub-indices every time somebody plans a walk along Waterway Point.
A school, sport operator or workplace may have specific rules beyond general MOH advice. Their dated announcements determine operational changes. A young student with asthma should follow the clinician-prescribed plan; a healthy adult considering a strenuous jog should observe public activity guidance; an older resident may have a short necessary appointment. The same air report supports different practical choices without giving one universal medical guarantee. A good haze article helps each reader reach the next responsible decision.
Six-pollutant comparison for Punggol Science students
| Criteria pollutant | Form | What makes it different? |
|---|---|---|
| PM2.5 | Fine particle size category | Especially important in regional smoke haze |
| PM10 | Broader inhalable particle category | Contains PM2.5 plus larger particles |
| O3 | Gas | Ground-level photochemical pollutant |
| NO2 | Gas | Combustion-related and chemically reactive |
| SO2 | Gas | Sulphur-related combustion and atmospheric chemistry |
| CO | Gas | Incomplete combustion; not exhaled CO2 |
Frequently asked questions about the six PSI pollutants
What are all six of Singapore’s PSI pollutants?
PM2.5 and PM10 particles, ground-level ozone O3, nitrogen dioxide NO2, sulphur dioxide SO2 and carbon monoxide CO. NEA monitors these and uses pollutant-specific sub-indices.
Does Singapore average the six raw pollutant numbers?
No. The PSI is the highest of six calculated pollutant sub-indices, not a sum or an arithmetic mean of raw concentrations. Units and index calculations differ.
Are PM2.5 and PM10 two non-overlapping groups?
No. PM2.5 is the finer subset of PM10. Adding raw PM10 to PM2.5 can double-count particles. Use the exact size definition and measurement units.
Why is one-hour PM2.5 shown separately during haze?
Regional smoke commonly affects fine particles strongly, and hourly concentrations can change quickly. NEA reports one-hour PM2.5 for immediate context alongside the rolling 24-hour PSI.
Can I breathe ground-level ozone because ozone protects the Earth?
Stratospheric ozone has a protective ultraviolet-absorbing function; ground-level ozone is an air pollutant and potential respiratory irritant. Do not generate ozone indoors to treat haze.
Are carbon monoxide CO and carbon dioxide CO2 identical?
No. CO is a toxic gas from incomplete combustion and one of the six PSI pollutants. CO2 is a separate gas used, among other contexts, to assess indoor ventilation adequacy.
What is the NEA air-quality region for Punggol?
Punggol and Sengkang fall under North. Check the official timestamp and region rather than using an undated screenshot from a different part of Singapore.
Can I calculate PSI from a cheap bedroom PM2.5 sensor?
Not correctly with that device alone: it measures one local pollutant estimate and does not provide all six official ambient pollutant sub-indices, regional measurements or relevant conversion methods.
Can an orange sunset tell me which pollutant is highest?
No. Lighting, humidity and scattering affect visible appearance. A photograph is not a chemical analyser or certified air-quality measurement.
Which number should I use for Punggol outdoor exercise today?
Use NEA’s latest North-region one-hour PM2.5 with MOH’s advice for health and exertion. Use forecast PSI for tomorrow and follow the actual organiser’s operational instructions.
Continue through the Punggol haze knowledge network
- Punggol one-hour PM2.5 and PSI guide
- WHO PM2.5 guidelines versus Singapore PSI
- Reading charts and pollution data
- Python data.gov.sg air data tutorial
- Punggol atmospheric chemistry Science
- Health, children and asthma during haze
- Science and Mathematics learning activities
- Punggol haze complete master hub
Official references and editorial limits
- NEA: PSI methodology, North region and one-hour PM2.5
- NEA: ambient monitoring of six criteria pollutants
- NEA: official current air readings
- MOH: current outdoor health advice
- WHO: 2021 Air Quality Guidelines
- US EPA: particle matter basics
- US EPA: ground-level ozone
- US EPA: nitrogen dioxide
- US EPA: sulphur dioxide
- US EPA: carbon monoxide
Reviewed 19 October 2026. The worked figures and descriptions are original teaching illustrations, not live Punggol pollutant measurements. The guide does not announce school closures, certify rooms or diagnose a person. Use official NEA and MOH sources for current decisions.


