
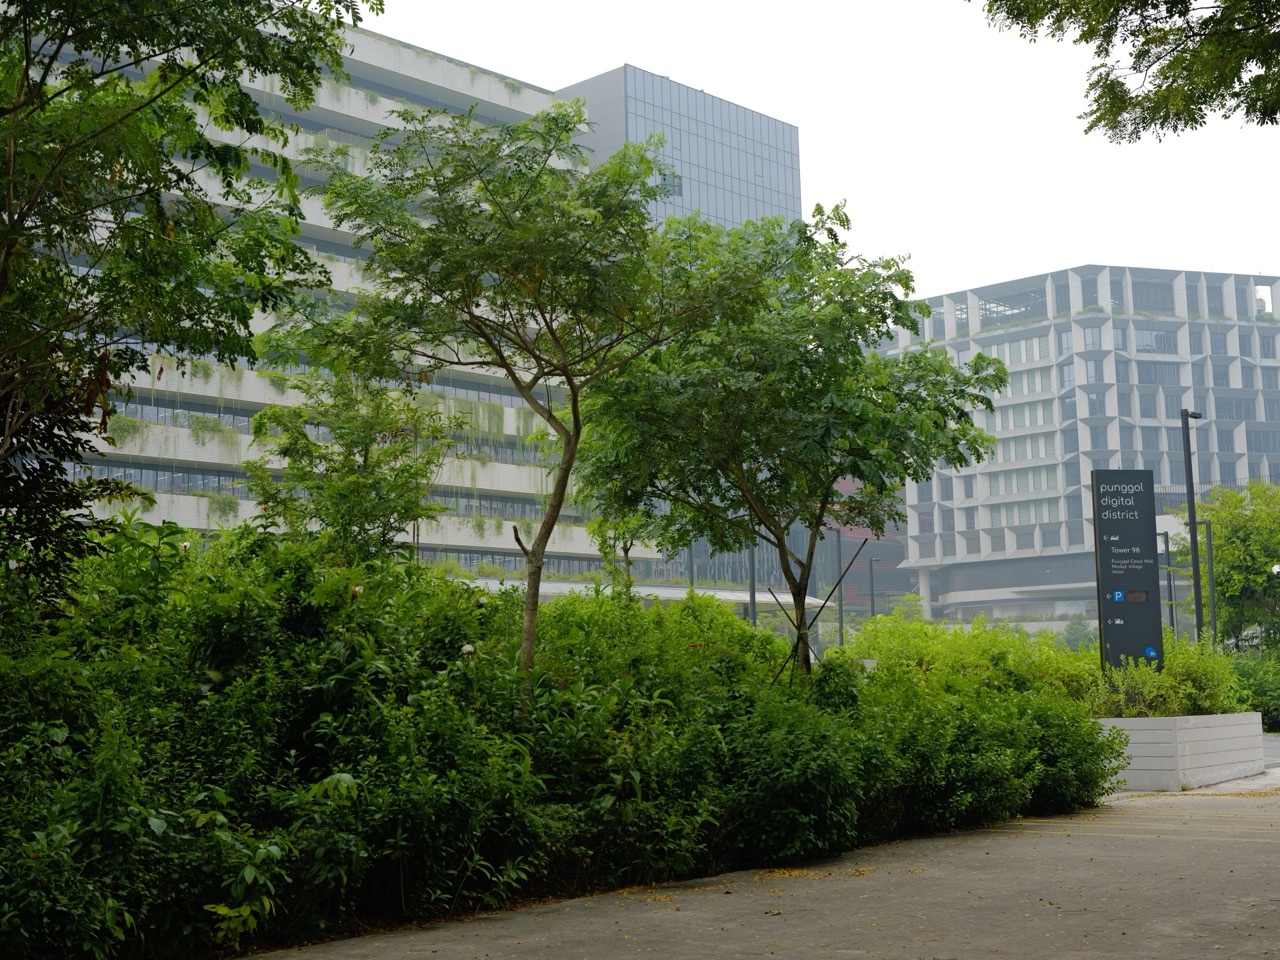
How does NEA know the PM2.5 level for Punggol? Singapore uses a continuously operating network of specialised ambient air monitoring analysers for six criteria pollutants, reporting official regional conditions. Punggol is in the North reporting region, not a measurement from a sensor outside every flat. NEA’s current one-hour PM2.5 and the 24-hour PSI answer different time-scale questions. A sensor attached to a private balcony may be useful for personal learning but does not replace the certified official regional reporting network.
This guide explains monitoring stations, data quality assurance, calibration, instrument differences and original worked examples. It is not a claim to know the location of a specific NEA instrument or a suggestion to enter any restricted monitoring facility. Check NEA’s official current air readings and MOH’s activity advice when planning outdoor exposure; these public measurements do not diagnose an individual person’s health or equipment condition.

The short answer: an official network rather than a phone sensor
NEA says its ambient air-quality information comes from a continuously operating network of specialised analysers measuring PM2.5, PM10, ozone, nitrogen dioxide, sulphur dioxide and carbon monoxide. Its monitoring and reporting system is designed for dependable public information. The air at one HDB balcony can differ from the public regional value, because the official data describes ambient conditions across a defined area and the balcony may be near a local source or building obstruction. A local phone application usually accesses external data and does not sample the air itself.
NEA says its monitoring analysers are specialised equipment certified by international bodies. That does not tell the public the exact model fitted in every national site, or mean someone with a small optical sensor can reproduce the regulatory method by selecting the same colour icon. The essential comparison involves instrument purpose, the pollutants it measures, data quality controls, sampling location and averaging time. A resident can appreciate what the official network provides without requiring that every air measurement in the region be identical.
Punggol belongs to NEA’s North reporting region
Singapore reports five public regions for PSI and one-hour PM2.5: North, South, East, West and Central. NEA’s published region guide places Punggol and Sengkang in North along with other northern localities. A family planning outdoor recreation in Punggol should begin with the North reading rather than a screenshot from South or West simply because a relative lives there. The data are reported for broad ambient areas, not labelled for every individual road or park connector.
Punggol Northshore, Punggol Central and Punggol Coast contain different buildings, parks, roadways and exposed places. The exact air inhaled in a room may depend on whether outdoor windows are open, indoor smoke sources and filtration, while the regional reading is a valuable official reference for broad outdoor decisions. Do not treat a regional average as a property-specific certificate or use a single low bedroom estimate to dispute the national network without a proper comparison.
Six pollutants are measured for the rolling PSI
The PSI computation uses the six criteria pollutants monitored by NEA. PM2.5 and PM10 are particle-size categories; ozone, NO2, SO2 and CO are gases with their own roles and methods. The relevant concentrations are processed into pollutant-specific sub-indices, and the highest sub-index determines the rolling 24-hour PSI. A standalone fine-particle sensor cannot measure the gas contributions or independently recreate the entire index from one concentration.
This scientific distinction should be explained before comparing a consumer app with official PSI. An app’s ‘AQI’ could also use a different country’s index or manufacturer algorithm. A screen showing PM2.5 mass in µg/m³ is not directly equivalent to a PSI index point. NEA publishes official values on its haze site and myENV; data.gov.sg makes various government datasets accessible for properly sourced educational analysis.
Why one-hour PM2.5 and 24-hour PSI are published together
NEA’s one-hour PM2.5 reflects concentrations measured over the relevant preceding hour, offering more immediate feedback when regional haze changes as winds or mixing shift. The PSI represents a rolling 24-hour summary from the criteria pollutant sub-indices. This difference in averaging means the values are not expected to move in precisely the same pattern. A sudden plume may increase hourly PM2.5 before the longer-term index responds as strongly, and a clearing hour may occur while earlier higher concentrations remain part of the rolling calculation.
MOH’s 2026 immediate activity advice uses the latest one-hour PM2.5 category, while next-day planning uses the forecast 24-hour PSI. For a Punggol child going outdoors now and for a school planning tomorrow’s sports event, those are distinct decision time horizons. A public data system can be accurate while producing different numbers for different quantities. The user should identify the pollutant, units, period, region and timestamp before deciding whether something looks inconsistent.
Measured values, forecasts and personal symptoms are different evidence
An observation from an air monitor describes measured ambient pollutant conditions at a time and place. A forecast is an estimate of possible future conditions based on meteorology, observations and a model. A person’s wheeze, eye irritation or headache describes their symptoms, which require clinical context and cannot be established as caused by haze solely from an environmental graph. All three are useful but cannot substitute for one another.
A family can prepare an indoor Plan B when the next-day PSI forecast suggests concern, then check the current one-hour PM2.5 before a recreational outing. If a person has significant symptoms, healthcare is the appropriate decision route regardless of whether the latest band is labelled Normal. A school or venue may have additional operating protocols requiring an official message. The monitoring network informs public choices without automatically closing a class, certifying a room or treating a patient.
Accuracy and precision are not interchangeable
Accuracy concerns how close an estimate is to a suitable reference value, while precision concerns how closely repeated measurements agree under comparable conditions. Two inexpensive monitors might repeat the same wrong value every time and therefore appear precise while being biased. Conversely, a device may scatter its readings around a plausible mean. Good air-quality measurement requires consideration of both. A family’s confidence should come from appropriate performance evidence, not from the number of decimal places shown on a screen.
NEA’s certified ambient analysers are subject to professional monitoring methods, whereas consumer products have variable documentation and operating limits. The US EPA’s Enhanced Air Sensor Guidebook explains evaluation of low-cost sensors, calibration, site placement and comparing with reference monitors. This difference does not mean every consumer sensor is useless; it means the result should be interpreted for its intended purpose. A low-cost bedroom monitor may help explore changes due to cooking, while official NEA readings remain the public regional reference.
Calibration and drift matter over time
Calibration is the process of comparing or adjusting an instrument’s response against an appropriate reference or standard. A sensor can be calibrated when manufactured yet change behaviour after long use, unusual humidity, contamination or component ageing. Manufacturers vary in whether users can perform a valid field calibration. Merely pressing a ‘reset’ button does not necessarily align a device with a professional reference, especially when the procedure itself depends on assumed clean air.
A person using a Punggol balcony sensor should read its manual, keep the measuring inlet accessible and note maintenance requirements. If an official station and a consumer sensor disagree, the comparison must account for location, averaging interval, units and sensor uncertainty before accusing the official source of being inaccurate. The EPA recommends documenting calibration, comparing with reference methods where feasible, and reporting what could not be verified. A student’s research journal benefits from these honest limits.
Humidity can alter some optical particle-sensor estimates
Many lower-cost particle monitors infer a mass concentration from how particles scatter a beam of light. The underlying estimate can depend on particle size, composition and shape, as well as relative humidity. Some particles take up water in humid air, changing optical scattering and apparent size. Punggol’s tropical humidity therefore deserves attention when comparing a home display against a regional regulatory report. This is a possible source of uncertainty, not proof that every high value is a humidity error.
Keep moisture sources and sudden air-conditioner condensation away from equipment unless it is designed for such conditions. Do not blow steam into the sensor or spray water near electrical devices to ‘prove’ an error. Record humidity where it is available and ensure actual sensor placement meets the manufacturer’s instructions. A rising PM2.5 estimate after frying may reflect real indoor particles even if the room is also humid. Multiple plausible influences can occur simultaneously.
Location can make two technically good monitors disagree
An air-quality instrument close to a barbecue, exhaust outlet or dusty worksite may sample an air mixture different from a more representative ambient station. EPA’s sensor-siting guidance explains that a site designed to describe the wider community should avoid being dominated by a single very local source. Indoor sensors should be placed away from strong immediate emissions, purifier outlets and unsuitable drafts if the goal is a representative room trend. An instrument’s location is part of what the data mean.
Before comparing two values, record whether the sources are outdoors, inside a closed Punggol bedroom, beside a road, or in an open car park. A regional NEA report and a local monitor can both be reasonable for their respective objectives, yet neither should be relabelled as the other’s measurement. A household looking at a balcony spike might investigate routine cooking or wind changes without claiming the whole North region reached the same concentration.
Data timestamps and missing observations need careful treatment
An hourly public reading is not the same as a second-by-second phone animation. Measurements are collected, validated, processed and published with defined intervals and timestamps. A consumer app can show an old cached value or a proprietary ‘live’ estimate whose time period is not clearly labelled. A teacher using data.gov.sg should check the dataset’s documented coverage, update time and units rather than fill blank hours with fabricated zeros.
When making a Punggol haze graph, label Singapore local time and the monitoring region. Record when the source was retrieved and whether a point is measured, forecast or interpolated. If the readings are unavailable for a period, mark the gap rather than inventing a convenient value. A trustworthy chart can include a short note about uncertainties; a smooth but silently fabricated curve is far less useful for science or public communication.
Why the official North reading does not name every Punggol street
Monitoring regions balance public reporting with a practical station network. NEA provides North, South, East, West and Central values so people can understand ambient conditions without claiming a sensor sits at every HDB entrance. The North region covers Punggol along with other northern districts. It is possible for a private instrument near a roadway or in an enclosed room to record a different estimate, but that fact alone cannot invalidate the official regional data.
The question to ask is what the data are supposed to represent. For an immediate public outdoor activity, use the North regional one-hour PM2.5 and MOH’s associated guidance. For a specific classroom indoor air problem, ask the premises operator about its actual ventilation and filtration; a regional station was not designed to certify that room. For a research project, document both sampling locations and the uncertainty introduced by comparing them.
A co-location study is a fairer accuracy test
Researchers sometimes evaluate lower-cost sensors by placing them near an appropriate reference monitoring instrument for a defined period. This is called co-location. It lets them compare readings under broadly similar environmental conditions and analyse systematic differences, missed spikes and dependence on humidity. The US EPA publishes guidance on such comparisons. Simply setting two inexpensive devices side by side tests agreement between those devices; it does not prove either is accurate against a trusted reference.
Parents and students should not enter restricted NEA monitoring locations to conduct an informal experiment. A classroom can instead use existing public datasets, clearly labelled demonstrations and hypothetical figures. When comparing values, align timestamps and measurement units, assess whether one monitor uses a one-hour average and another an instant estimate, and report the limits. Good student science is transparent about what could not be established.
The public chart should distinguish observation from forecast
An observation tells readers what an instrument measured over its published interval. A forecast estimates conditions in a future period using atmospheric models and recent information. A map of satellite fire hotspots provides further contextual evidence about possible smoke sources, but it is not a measurement of PM2.5 at Punggol. If a student’s graph combines all three, the legend should separate them instead of displaying one smooth line labelled ‘real haze’.
A parent planning a weekend picnic can use the next-day PSI forecast to prepare a Plan B, then consult the latest hourly PM2.5 before going. If rain or a wind shift changes conditions, the update does not mean yesterday’s forecast was deliberately misleading. Forecast uncertainty and monitoring quality are separate issues. This division also helps prevent social-media claims that a screenshot of a model is a certified reading from a station in every neighbourhood.
An illustrative two-monitor example
Imagine one NEA regional one-hour PM2.5 value of 45 µg/m³ at a specified time, while a private Punggol kitchen sensor estimates 90 µg/m³ for a five-minute period during frying. These are fictional values, not current measurements. The two numbers cannot be compared directly to accuse the regional network of being wrong: they sample different places and averaging periods, while cooking can add local particles. A better comparison would align pollutant, period, location and the intended question.
The family might note that the kitchen monitor declines after ordinary cooking ends and appropriate cleaning or filtration runs. That observation is useful for learning about the home’s routine but not a regulatory calibration. If a resident wants a proper independent air-quality assessment, they should use qualified methods and respect the building’s safety systems rather than deliberately generating smoke to test an app. The goal is clear reasoning, not dramatic screenshots.
How to describe uncertainty without undermining trust
Every instrument has measurement limits and a field of appropriate use. Reporting those limits openly makes information more useful, not less. A certified network is not claiming every square metre of Punggol contains exactly the same pollutant concentration. A consumer sensor is not claiming to be a nationwide index when its actual scope is a desk or balcony. The mistake occurs when readers silently change the meaning of one value into another.
When sharing an air-quality claim, name the source, pollutant, unit, location, averaging period and date. If a value comes from a simulation or student exercise, label it as a hypothetical example. If a current emergency response or activity decision is needed, follow NEA and the relevant authority rather than relying on an unverified personal graph. A trustworthy local article should help readers act, not make them suspicious of every changing decimal.
An authentic Punggol school Science project
A Secondary 2 class can investigate what air-quality data are capable of telling us without putting children near a monitoring facility or asking them to generate smoke. Start with an official NEA hourly PM2.5 chart for the North region. Define the period, identify the maximum and minimum, and graph the documented values with appropriate units. Compare them with ordinary rainfall and wind context only where correctly sourced. Ask whether the data measure actual air at the school gate or the reporting region as a whole.
An excellent project includes its research question, data dictionary, timestamp method, chart and limitations. A pupil might explain that a satellite hotspot indicates a thermal anomaly, while NEA measures ambient pollution, and that neither alone can identify a precise pollutant dose for a child. If missing hourly measurements appear, show a gap instead of inventing a zero. This is more rigorous than producing a beautifully coloured infographic with unlabelled values.
A worked example in data accuracy
Suppose a student is given three fictional monitors all sampling an appropriate common location: a reference value of 40 µg/m³, Sensor A estimating 42, and Sensor B estimating 55. Sensor A has an absolute deviation of 2 and Sensor B a deviation of 15 for this one measurement. The student can correctly say A is closer on that occasion. They cannot conclude from one example that Sensor A is always more accurate, that either meets an official standard, or that every device from Manufacturer B is unreliable.
To evaluate repeatability, collect comparable observations over time under conditions relevant to the purpose, consider humidity and check the instrument method. Avoid giving the class the impression that any one photo of an air-quality display proves a city’s monitoring network has failed. Scientific accuracy is about appropriate evidence across observations, not choosing whichever number looks most plausible. The arithmetic here is fictional, so it should never be captioned ‘actual Punggol PM2.5’.
How a school’s outdoor decision should use the readings
Schools have institutional responsibilities and government haze plans. An NEA reading informs that framework but does not independently announce a cancellation. For example, a child could be attending an indoor lesson while strenuous outdoor PE has been modified. That is not proof that the school itself is closed or that the hall’s exact air concentration equals the North regional reading. Parents should check the school’s dated official notice and communicate individual medical needs through the appropriate private channel.
MOH distinguishes immediate activities using one-hour PM2.5 and tomorrow’s planning using forecast 24-hour PSI. A medically vulnerable child or adult may have more conservative clinical advice. The lesson for Punggol families is to use the correct source for the correct responsibility: NEA for ambient information, MOH for public health advice, the school for its operational arrangements, and clinicians for symptoms. A home monitoring device cannot override every one of those roles.
What a forecast model adds to measurements
Weather analysis and satellite hotspot maps can help forecasters understand the likely transport of smoke in coming hours or days. But satellite thermal anomalies are not ground-level PM2.5 measurements, and wind direction can vary with height and time. A model may revise its outlook when new information arrives. That is the nature of forecasting, not evidence that a monitoring analyser’s earlier measured concentration was invented.
A strong Science explanation distinguishes an observed measurement, a model prediction and a past-hour average. The public 24-hour PSI forecast helps a parent prepare an indoor backup for a Punggol weekend, while current hourly data inform the final immediate choice. Readers should not use a weather model from another country to declare a specific Punggol school closed, nor treat a proposed AI algorithm as if it is NEA’s approved method without documentary evidence.
The fastest source-checking routine for parents
Read the pollutant name first: PM2.5 concentration, PSI index or something else? Then note the unit, reporting region, timestamp, whether measured or forecast, and the activity being considered. A one-hour PM2.5 reading is not the same quantity as a 24-hour PSI point. A home particle reading is not an official regional measurement. A camera image of a smoky sunset is not a calibrated particle or gas sample.
Once these details are clear, the practical action becomes easier. For a healthy person’s optional hard run, follow the current exertion guidance; for a vulnerable resident’s necessary clinic trip, consider medical and travel needs; for tomorrow’s organised school programme, wait for its actual operator’s instructions. The purpose of a reliable monitoring system is to support sensible decisions, not encourage families to refresh five different numbers all night.
Frequently asked questions about NEA monitoring
Does NEA have a PM2.5 sensor outside every Punggol block?
No. NEA’s official monitoring network supports ambient public reporting across regions. Punggol and Sengkang use the North reporting region, not a separate certified public reading at every residential block, park or indoor room.
How many pollutants does the official network measure for PSI?
NEA monitors PM2.5, PM10, ozone, nitrogen dioxide, sulphur dioxide and carbon monoxide for the 24-hour PSI. A typical low-cost particle sensor covers fewer measurements and cannot simply reproduce all six sub-indices.
Why is my home sensor different from NEA?
The instruments may use different measurement principles, locations and averaging times. Indoor cooking and purifier outlets can affect a home estimate; humidity and calibration may influence inexpensive optical sensors. One disagreement is not proof that official monitoring is wrong.
Does a green watch icon mean Punggol’s air is safe?
Not automatically. Fitness watches may display an air-quality feed from a third party or a foreign AQI. The correct public action depends on NEA’s current reading, MOH advice and the individual activity and health, not an unexplained green badge.
What is an official regional reading useful for?
It supports public understanding of outdoor air quality and the applicable official health advisories. It cannot certify the exact PM2.5 concentration in one bedroom or diagnose a child with wheeze or headache.
Can an inexpensive sensor be accurate?
Some can be useful for their intended purposes, but evidence is needed about accuracy, precision, calibration, conditions and time averaging. EPA guidance recommends performance evaluation and appropriate comparison with reference-grade monitoring where feasible.
What is sensor co-location?
A method of evaluating a device by placing it near an appropriate reference monitor to compare measurements under similar air conditions. It is a structured study, not permission for members of the public to enter restricted monitoring stations.
Why does an hourly reading change quickly while PSI changes gradually?
The one-hour PM2.5 responds to recent air. The rolling 24-hour PSI summarises a longer period using criteria pollutant sub-indices, so earlier conditions can influence the daily index after the latest hour has improved.
Does an orange skyline establish Punggol PSI?
No. Atmospheric humidity, cloud, sun angle and particle light scattering can change visibility. A photograph alone cannot measure fine particles or six pollutant gases. Consult NEA’s current official dashboard.
How should students use the data in a Science project?
State the research question, units, North region, timestamp, pollutant and averaging interval. Mark hypothetical readings clearly, preserve missing-data gaps and explain sensor limits. Data literacy is stronger when the method is honest than when the graph is visually dramatic.
Punggol haze monitoring and education network
- All six pollutant categories behind Singapore’s PSI
- Which PM2.5 reading to use for a Punggol outing
- Consumer home PM2.5 monitor placement and humidity
- Download air-quality data for a Python school project
- Forecasting versus observed haze
- WHO health guidelines versus local monitoring bands
- Science and Geography learning activities
- Punggol Haze Complete Guide 2026
Official sources and editorial limits
- NEA: Official Ambient Air Quality Monitoring
- NEA: Five Reporting Regions, Six Pollutants and PSI FAQ
- NEA Vox: Official Specialised Certified Air Sampling Analysers
- NEA: Live Haze Data and Forecasts
- MOH: Public Haze Health Advice
- US EPA: Enhanced Air Sensor Guidebook
- US EPA: Sensor Site Placement
- US EPA: Co-location with Reference Monitors
Reviewed 19 October 2026. This article does not assert the exact location or model of a particular NEA analyser, grant access to stations or reproduce official live readings from hypothetical examples. Air-quality monitoring and forecasting are different from individual medical assessment. Refer to current NEA and MOH guidance for actual outdoor decisions.


