
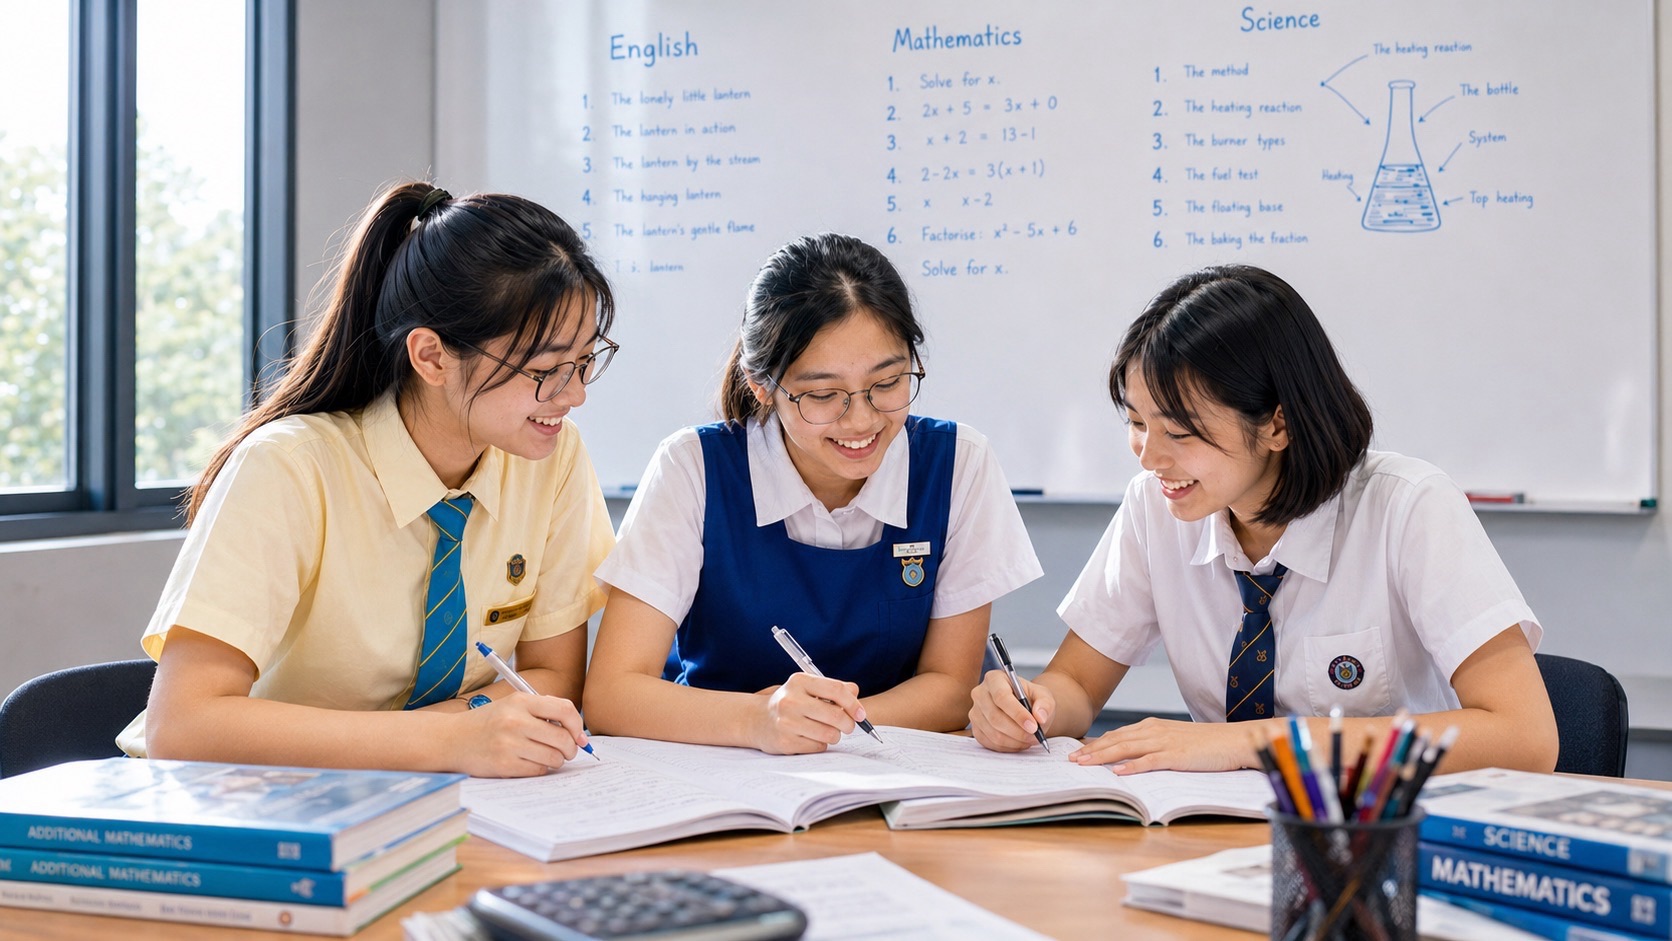
How can Punggol parents turn a hazy afternoon into useful learning without taking children outdoors? Use official air-quality information as a starting point for short indoor projects in Science, Geography, Mathematics and English. Children can compare measured facts with opinions, draw a map of how regional smoke travels, calculate particle-size conversions, write a clear family message and practise deciding which sources deserve trust. There is no need to collect smoke, expose children to polluted air or purchase a special kit.
This Punggol haze learning activities guide is for Primary and Secondary students and families seeking meaningful indoor alternatives when prolonged outdoor play is reduced. Check NEA’s latest haze advice first; learning comes after health decisions. For what to do outside, see the Punggol Waterway and Coney Island haze guide. This page is about learning to ask better questions, not about school closure announcements or live air-quality forecasts.
Quick information: choose a project by age and time
- 10 minutes, Primary 1–3: Write a simple, reassuring family notice explaining why an outdoor game has moved inside.
- 15–20 minutes, Primary 4–6: Sort statements into observation, measurement, prediction and advice; then calculate easy time differences.
- 25–30 minutes, Secondary 1–2: Draw a source–wind–measurement diagram for haze and practise converting micrometres to millimetres.
- 40–45 minutes, Secondary 3–4: Read a dated NEA advisory and ASMC map, assess its evidence and write a balanced explanation that identifies uncertainty.
- Extension for older learners: Evaluate how a city responds to an environmental problem through monitoring, education, public-health messages and infrastructure planning.
The projects can be done with paper, pencils, a map and a web-connected device used by an adult. For families without internet access at that moment, adults can prepare a printed official source beforehand.
A haze lesson begins with a safety rule
Do not ask children to make smoke, burn leaves, spray aerosol products, stand outside to ‘test the air’, sample particles by breathing deliberately or perform unsafe purifier experiments. Those are unnecessary and can introduce hazards. Haze is a real environmental condition, not a reason to create fresh pollution at home.
The data and maps published by public agencies provide enough material to support good inquiry. Science learning can focus on units, particle size, weather systems, uncertainty and evidence without personally collecting pollutant samples.
If someone feels unwell, prioritise their health and care plan. A learning activity is optional; a student with asthma or another condition should never be asked to prove their resilience by going outdoors.
The core lesson is therefore observe safely, use trustworthy sources, explain what the evidence permits and stop when a claim goes too far.
What children can learn from one real local issue
Haze links several school subjects because an environmental event has physical causes, measurable indicators, geography, public-health consequences and communication challenges. That makes it useful for interdisciplinary learning when handled carefully.
In Science, particles, combustion, the atmosphere and measurement are relevant. In Geography, regional land use, winds, seasonal weather and transboundary effects appear. In Mathematics, units, ratios, tables, graphs and change over time can be practised. In English, students can learn to distinguish claims from evidence and write useful public-information messages.
The purpose is not to pretend that every lesson must revolve around haze. It is to use a familiar question—’Why is the sky looking different?’—to practise transferable thinking skills. The same habits apply to flooding, heat, mosquito control and weather alerts.
For a deeper general explanation, the site’s Why Is Punggol Hazy? lays out the cause-and-effect chain.
Primary 1–3: the ten-minute ‘change of plans’ writing activity
Give the child a real but simple task: write a three-sentence message for a friend explaining that a planned outdoor playground game has become an indoor drawing session. The child does not need to discuss medical thresholds or identify a fire on a satellite map.
A possible model is: “We checked the air-quality advice today. We are playing indoors instead of staying at the playground for a long time. We can meet outside again when the conditions are suitable.” Ask the student what makes the message kind and clear.
Then improve it together. Does it say what changed? Does it say why without scaring anyone? Does it offer an alternative? The student can replace repeated words, add a friendly greeting and practise appropriate punctuation.
This is a short English writing task, but it also builds practical communication. Children learn that environmental precautions are decisions adults explain, not mysterious punishments.
Primary 4–6: four types of statement
Write four sentences on separate slips of paper: “The sky looks grey.” “NEA reports the North region’s one-hour PM2.5 reading at a stated time.” “Rain may arrive this evening.” “Our family will move the football game indoors if the official advice calls for it.”
Ask the child to classify them. The first is an observation, the second a measured report, the third a forecast or possibility, and the fourth a decision. The categories have different standards of proof.
Now deliberately remove the timestamp from the second sentence. Ask what became harder to verify. Add a date but remove the units. Explain why an isolated number such as “90” is still ambiguous if it could refer to different indicators.
This simple activity teaches children to read the full label before sharing a screenshot. It also prevents the common mistake of treating one’s personal observation as an official measurement.
A Primary mathematics exercise: how much outdoor time changes?
Imagine a fictional weekend plan with 75 minutes of outdoor cycling and 45 minutes of outdoor games. The total is 75 + 45 = 120 minutes, or two hours. A revised plan retains a 15-minute necessary walk and moves the remaining activities indoors.
The reduction in planned outdoor time is 120 − 15 = 105 minutes. As a fraction of the original 120 minutes, that is 105/120 = 7/8. As a percentage, it is 87.5%. These are arithmetic facts about a fictional timetable.
Do not tell the child that this means health risk fell by 87.5%. Risk is not directly proportional to the minutes in every situation; particle concentration, breathing effort and personal susceptibility also matter. The arithmetic measures time, not clinical risk.
That one distinction demonstrates an important mathematical habit: know what your number represents. Children can be accurate with calculations without inventing a medical conclusion.
Secondary Science: how small is PM2.5?
PM2.5 refers to particles with an aerodynamic diameter of 2.5 micrometres or less. One micrometre is one-thousandth of a millimetre. Therefore 2.5 μm = 0.0025 mm. This is a unit conversion, not a statement that all haze particles have exactly that diameter.
Ask students to convert 10 μm into millimetres: 10 ÷ 1000 = 0.01 mm. Then compare the two size thresholds: 10 ÷ 2.5 = 4. The nominal PM10 size threshold is four times the PM2.5 threshold in diameter.
That does not mean a PM10 particle always has four times the mass of a PM2.5 particle. For particles of similar shape and density, mass is related to volume, which scales approximately with the cube of linear size. Real airborne particles vary in shape and composition.
Students can use a diagram to visualise why very small particles are not reliably visible as individual specks in the air. They should not try to catch and inspect actual smoke in a makeshift experiment.
A Science explanation of combustion without lighting a fire
The simplest relevant statement is that burning vegetation and other materials can release gases and particles. Those emissions may travel through the atmosphere and undergo changes. The exact chemistry depends on the fuel, conditions and reactions occurring along the way.
Ask the student to draw boxes labelled fuel, combustion, emissions, transport and measurement. An arrow connects each stage. At the end, add a question mark: what evidence would establish which fire contributed to a particular day’s air quality?
The question mark is important. It prevents a diagram from pretending to prove a precise source. Satellite hotspot detections, wind analyses and official ground measurements provide different forms of evidence.
For advanced chemistry and pollutants, the existing Science Improvements in Punggol: Air Pollution and Atmospheric Chemistry explores PM2.5 and related atmospheric concepts.
Secondary Geography: draw the Southeast Asian smoke story
Open an appropriate atlas or map showing Singapore, Sumatra, the Malay Peninsula, Borneo and Kalimantan. Locate Singapore and explain that the origin of a smoke plume must be assessed using the specific fires, winds and dates involved. Do not use one historical map as a permanent forecast.
A southeasterly wind comes from the southeast and blows toward the northwest. Ask the student to draw an arrow showing that direction. Then compare it with an example southwesterly wind, which comes from the southwest and blows toward the northeast.
Now discuss why winds at different heights may not be identical. The ASMC regional haze maps describe modelled winds at approximately 2,500 feet, not an instrument fixed beside a Punggol playground. Students should label the height or level of the wind evidence.
Finally, ask how rain over a fire-prone region could change the amount of smoke produced. Weather may influence burning as well as transport; a shower in Singapore alone does not guarantee that fires farther away have stopped.
Geography extension: environment, livelihoods and responsibility
Some regional haze episodes have involved forest, vegetation or peatland fires. Discuss how land management, agricultural needs, enforcement, weather, fire prevention and economic incentives can intersect. The goal is analysis rather than assigning blame to an entire country or population.
Ask students to separate physical factors from human factors. Physical factors can include dry conditions, wind and rainfall. Human factors can include land clearing practices, resource management and regulations. A sensible explanation may involve both.
Then introduce transboundary pollution: air does not stop at national borders. A consequence can be felt far from the source, making monitoring and cooperation important. This provides a route into geography, civics and public policy.
A strong answer acknowledges that not every observed hotspot is proven to be a particular type of fire and that specific-attribution claims require dated evidence. That is more rigorous than memorising a simplistic slogan.
Lower Secondary Mathematics: graph a fictional dataset
Use a fictional, clearly labelled one-hour PM2.5 series: 9am 35 μg/m³, 10am 65 μg/m³, 11am 95 μg/m³, noon 55 μg/m³. Ask students to draw a line graph with the horizontal axis in time and the vertical axis in concentration.
The highest example reading is 95; the lowest is 35. The range is 95 − 35 = 60 μg/m³. The mean of the four data points is (35 + 65 + 95 + 55) ÷ 4 = 62.5 μg/m³. Check each result by adding the values independently.
Explain immediately that the four-point average is not a 24-hour PSI and not an official live reading. It is a mathematical exercise. If students wish to analyse real observations, obtain the original source data and preserve its units and timestamps.
For a deeper chart-reading lesson with the differences between PSI, PM2.5, hotspots and forecasts, follow Punggol Haze Data Literacy.
Upper Secondary Mathematics: modelling needs assumptions
Give older students two proposed statements: “PM2.5 rose by 20 μg/m³ over an hour” and “PM2.5 will keep rising by 20 μg/m³ every hour tomorrow.” Ask why the first can describe data while the second is an unvalidated forecast.
A simple linear model might be useful for discussing slope and limits, but atmospheric behaviour depends on fire emissions, wind, rainfall, mixing and other physical factors. A line through two points does not establish those drivers.
Ask students to write the model assumption in plain language: “We assume the rate of increase remains constant.” Next ask whether that assumption is physically likely to hold during a changing weather system. This is an excellent way to show the difference between mathematical convenience and real-world validity.
The lesson is not “never model”. It is “state your assumptions and verify whether the model is appropriate for the intended decision”.
Upper Primary English: write a helpful public message
Present a fictional message: “The sky in Punggol is so dark, the air must be hazardous. Everyone should cancel everything.” Ask the student to rewrite it using evidence-based language without losing the concern for neighbours.
A clearer version would be: “The sky looks hazy today. Please check NEA’s current North-region reading and health advice before planning outdoor activities. People with chronic heart or lung conditions may need additional precautions.” This distinguishes appearance from official information.
Evaluate the revised message on accuracy, useful action, respectful tone and avoidance of exaggeration. A student can also practise identifying statements whose truth cannot be verified from the information given.
Then ask for a shorter version suitable for a class notice board. Writing concisely without discarding essential context is a valuable 21st-century communication skill.
Secondary English: an argument with evidence and limitations
An essay prompt might be: “During haze, should all outdoor school activities be cancelled immediately?” Students should not answer by inventing a national policy. Instead, they can discuss how decisions depend on current MOH/NEA guidance, institutional instructions, participant health and the intensity and duration of the activity.
Ask for a structure with a claim, explanation, evidence, qualification and conclusion. A balanced response might recognise the value of outdoor activity while arguing for adjustments when the advisory calls for them.
Good argumentation does not mean treating every position as equally well supported. Official monitoring and health advisories deserve more weight than an anonymous screenshot. A thoughtful qualification is not indecision; it is recognition of the scope of the evidence.
This writing task also teaches respectful public discussion when families have different health needs and schedules.
Media literacy: distinguish four kinds of online content
Show students a dated government advisory, a personal photo of the skyline, a satellite hotspot map, and a neighbourhood chat message with no source. Ask what each item can tell us and what it cannot.
The advisory reports an official measurement or advice. The photograph shows appearance under particular conditions. The satellite map suggests possible fire detections and transport information with sensor limitations. The forwarded message may be an unverified claim requiring checking.
The right outcome is not to dismiss all informal observations. It is to use them appropriately. A photo can be a powerful illustration; it just cannot independently tell you a certified PM2.5 value.
Students can create a two-column sheet labelled what this source shows and what this source does not prove. This is a useful habit in science, history, civics and everyday online life.
The safe way to use official datasets at home
Start at haze.gov.sg for current official conditions. Read the NEA air-pollution FAQ to understand the data and regional geography. Use MOH’s haze page for group-specific personal activity guidance. For regional fires and wind, refer to ASMC maps.
If a class needs a stable historical example, use a dated NEA advisory and copy its original publication date. Then distinguish that historical observation from the live service. Do not reproduce an old advisory as though its forecast applies today.
Keep original labels, units and sources next to any chart. If a datum is unavailable, mark it missing rather than quietly inserting zero. Avoid scraping screenshots into a spreadsheet when authoritative, machine-readable data is provided through an official source.
Where necessary, an adult can preview the websites first and select age-appropriate excerpts. There is no obligation for young children to navigate complex weather services independently.
One 45-minute home lesson that combines four subjects
Minutes 0–5: Check the current official source and agree that no one will go outside to collect smoke. Minutes 5–15: Draw a Geography map showing Singapore and possible smoke source regions, with wind directions clearly labelled as examples. Minutes 15–25: Complete a Mathematics exercise using fictional PM2.5 figures and correct units.
Minutes 25–35: Explain the Science idea that fine particles can be transported and measured, without conducting a hazardous combustion demonstration. Minutes 35–45: Write an English message to the family that distinguishes measured information from a plan or prediction.
At the end, ask the student to say one thing that is supported and one thing that remains uncertain. This reflection is often more valuable than simply producing a neat diagram.
The lesson can be shorter for younger children and more demanding for older students. Its usefulness comes from the sequence of reasoning, not the number of worksheets.
Three original assessment prompts
Prompt 1: The claim. A friend writes, “Because I cannot smell smoke, PM2.5 must be zero.” Explain why the conclusion does not follow. A strong answer mentions that smell is not a calibrated particle measurement and points to NEA’s official readings.
Prompt 2: The map. An ASMC image shows several hotspots with no visible cloud-free coverage for part of a region. Can the student conclude there are no other fires? A strong answer explains possible missed detections due to clouds or incomplete satellite passes.
Prompt 3: The number. A report says the four-hour mean PM2.5 concentration is 62.5 μg/m³. Can this value be labelled the official 24-hour PSI? A strong answer identifies the different averaging period, measured quantity, unit and index computation.
Students do not need perfect technical vocabulary at first. They need to demonstrate that they know the boundary between evidence and inference.
What parents should correct—and what they can let children discover
Correct errors that could produce unsafe conclusions: treating a cloudy sky as a certified hazardous PSI, claiming an N95 permits unlimited exercise, or assuming an undated map proves a specific day’s smoke source. These errors change real-world actions.
Allow children to explore ordinary uncertainty. If they ask why the hourly reading changed, help them list possibilities before looking up NEA’s dated explanation. That develops inquiry rather than memorisation.
Praise precision, not dramatic answers. A sentence such as “The data is insufficient to identify the exact cause” is often a stronger answer than a confident but unsupported guess.
Keep the lesson conversational. The goal is to produce independent learners who can understand a public environmental notice and choose a sensible next question.
Common learning mistakes to avoid
- Making smoke indoors as a demonstration of haze.
- Asking a child to stay outside long enough to “measure exposure”.
- Inventing a live Punggol PSI for a worksheet.
- Mixing micrograms per cubic metre with the dimensionless PSI index.
- Treating a satellite hotspot as proof of an individual fire’s size and origin.
- Blaming a whole population for a complex regional land-management issue.
- Turning every environmental lesson into an argument that all outdoor activities must stop permanently.
- Publishing identifiable health information about a child in a class project.
- Copying entire official advisories without the date or source.
- Calling a persuasive essay “scientific proof” when it lacks evidence.
A good project leaves children more informed and better able to judge information—not frightened or certain about claims that have not been demonstrated.
Frequently asked questions
Is haze part of Singapore’s Primary school Science syllabus?
Air, materials, environment and scientific skills can provide relevant learning contexts, but this guide does not claim every activity maps to a specific examinable syllabus item. Teachers should use current official curriculum documents for that decision.
What is the easiest haze activity for Primary 2?
Write a short note explaining a change from outdoor to indoor play, using clear sentences and a kind tone. Do not require a young child to interpret complex health thresholds.
Can Secondary students calculate PSI from PM2.5?
Not by simply averaging or multiplying a few PM2.5 values. Singapore’s PSI is an official index based on several monitored pollutants and defined computations over a rolling 24-hour period.
Is it safe to catch haze particles on tape or a plate?
This is not necessary for learning and does not give a reliable measurement of PM2.5. Use official data and safe diagrams rather than encouraging avoidable outdoor exposure or unvalidated sampling.
Can a parent teach wind direction without real-time forecasts?
Yes. Use a map and clearly labelled hypothetical wind arrows for compass practice. Explain that actual haze attribution requires dated evidence and that winds change with time and altitude.
Can children use a photo of Punggol Waterway as proof of pollution?
They can use a photo to describe visibility or appearance, but it does not supply a calibrated PM2.5 concentration. Add official data and the relevant timestamp for stronger analysis.
What does ‘transboundary’ mean?
It means a phenomenon, such as transported smoke, can move across national boundaries. Understanding it involves geography, atmospheric transport and cooperation between jurisdictions.
Do we need to buy a home air-quality sensor for these lessons?
No. Official NEA readings and ASMC maps are sufficient for many learning activities. A low-cost device can have calibration limitations and is not a replacement for official monitoring.
What if the student has asthma or feels unwell?
Follow the child’s medical care plan and official health guidance. The lesson can be shortened or postponed. Never make environmental study a reason to increase smoke exposure.
How do we make the learning meaningful rather than just filling time?
Ask the student to produce an explanation, calculation or responsible message, then evaluate whether it is supported by the source. Transferable reasoning matters more than decorative worksheets.
How this fits the eduKate ecosystem
Use the existing Punggol Haze School Day Guide for administrative and activity arrangements, not for these learning exercises. Use Punggol Haze Data Literacy for deeper numerical and map interpretation, and Why Is Punggol Hazy? for regional geography.
For complementary subject libraries on the main site, see Why Science? Air Quality, PSI and Environmental Data, Why Mathematics? Air Quality, PSI and Particulate Matter, Why English? Writing an Environmental Monitoring Report, and MOE V3.0 Reference 86: Air Quality and Environmental Monitoring Literacy.
These are different ways into the same public problem. This article’s distinct purpose is to turn information into safe, age-appropriate learning tasks with observable outputs.
Official sources and safety note
Reviewed on 17 October 2026. All invented numbers above are labelled educational examples, not current local air-quality readings. Teaching plans should respect the student’s age, health and school’s current requirements.
- NEA: live PM2.5, PSI and haze advisories
- NEA: air quality, regional geography and public FAQ
- MOH: haze health advice and one-hour PM2.5 bands
- ASMC: regional haze maps and wind information
- ASMC: satellite hotspot information and limits
- eduKate Punggol: Haze Data Literacy
A good haze lesson is not about making children worry more. It teaches them to ask what the evidence really shows, to calculate carefully and to communicate decisions with clarity. Those skills last much longer than an afternoon’s smoky sky.
Punggol Haze: Connected Reading Library
These reader-first guides answer different questions about Punggol and Singapore haze. For a decision about today, check the official NEA live readings and advisories rather than using an old article as a real-time report.
- Indoor destinations and verified PA haze shelters
- Balcony plants, laundry, vegetables and safe dust cleaning
- Reading PM2.5 graphs, PSI, satellite hotspots and wind maps
- Punggol Haze Check: one-hour PM2.5 and 24-hour PSI
- What happens in Punggol during haze: family routines
- eduKateSG Singapore Haze: transboundary smoke and connectivity
- eduKateSG Punggol Haze Lifestyle: work, school and daily errands
Punggol Haze: Master Directory and New Learning Guides
These new 2026 reference pages connect the original Punggol haze material to its full topic directory, realistic original composition stories, PSLE and SEC oral practice, and worked Mathematics and Science problems. All practice questions are independently created and are not official examination papers.
Haze Learning: Original PSLE and Secondary Practice
The linked exercises provide original comprehension, listening, situational writing and Geography practice. All sample questions are educational, not official examination materials.
Punggol Haze Science Pathways: Original 2026–2027 Practice
Choose the Science level that matches the learner’s actual MOE or SEAB syllabus. The four guides contain original worked examples and are not official past examination papers. Haze is a learning context; use NEA’s live air-quality information for current health decisions.
Further Punggol Haze Social Studies and Geography Practice
Continue with original level-specific inquiry questions matched to MOE Primary Social Studies and the 2027 SEAB G2/G3 Geography and Humanities syllabuses. The lessons do not replace official examination papers or live NEA air-quality guidance.


