
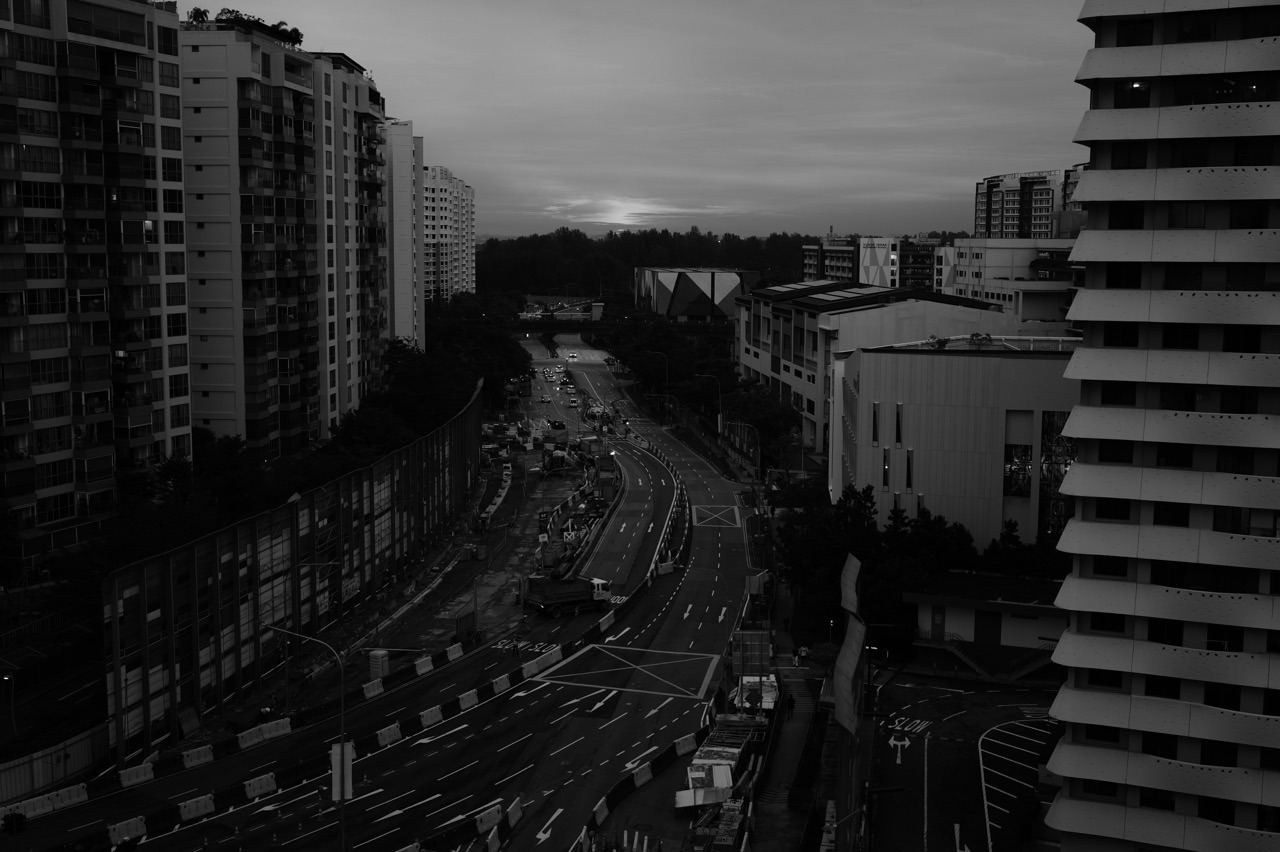
How do you study the October 2026 Southeast Asian haze as a Geography case study? Follow the causal chain: fire-prone landscapes and ignition → smoke emissions → atmospheric transport → monitored pollution in Singapore → impacts on people → short-term responses and long-term prevention. Then ask what each source can actually prove. A satellite hotspot is not a certified Punggol PM2.5 reading; a 24-hour PSI forecast is not an observed one-hour particle concentration; and a legal notice is not automatically a court finding of wrongdoing.
This Punggol Geography guide gives a dated 2026 source pack, an original six-point graph dataset, eighteen source-based practice questions, worked answers and evaluation paragraphs. It is especially useful for building the inquiry and evidence-handling skills associated with Singapore Secondary Geography and 2027 SEC Humanities (Social Studies, Geography) G2 K229 and G3 K335. The official G2 and G3 syllabuses describe geographical inquiry and source use. This haze pack is an original supplementary case study, not a claim that haze is a compulsory named examination topic or that these questions will appear in a national paper.
Quick answer: separate causes, evidence, impacts and responses
Causes include fire susceptibility in degraded vegetation or peat landscapes, actual ignition and land management. Transport involves winds, rainfall and atmospheric mixing. Evidence comes from satellite detections, weather analyses and ground measurements, each with limitations. Impacts depend on measured local conditions, the person and the activity. Responses include current NEA health advice, practical school or workplace adjustments, and longer-term regional fire-prevention cooperation.
Punggol is part of NEA’s North public air-quality reporting region. The North reading is not a separately certified measurement for every Punggol HDB tower, walkway or park.
For live health decisions, use NEA’s official haze service. The numbers in the historical source pack below are dated observations from 16 October 2026 or forecasts for 17 October 2026, not readings asserted for the time you open this article.
Geography source pack: four clearly different types of evidence
Source A: NEA situation update issued 16 October 2026. As at 8pm that evening, NEA reported one-hour PM2.5 concentrations across Singapore of 44–148 µg/m³ and 24-hour PSI readings of 159–222. The agency forecast a 24-hour PSI range of 150–230 for 17 October, corresponding to Unhealthy to Very Unhealthy conditions. NEA attributed dense smoke haze reaching Singapore to fire-related smoke in Kalimantan moving under prevailing southeasterly winds and also noted smoke over Sumatra. These details are paraphrased from NEA’s dated bulletin.
Source B: ASMC fire and haze monitoring. The ASEAN Specialised Meteorological Centre uses satellite observations and regional meteorological data to assess potential fire hotspots and transboundary smoke. Its products help investigate source regions and transport. However, satellite detections can be missed under cloud cover or limited observation conditions, and a hotspot is not a verdict about ownership or legal conduct.
Source C: ASEAN regional prevention. The ASEAN Agreement on Transboundary Haze Pollution provides a framework for cooperation among governments. The ASEAN Peatland Management Strategy 2023–2030 addresses sustainable peatland management and fire prevention. These are institutional plans and frameworks, not evidence that every objective has already been fully achieved.
Source D: a fictional neighbourhood screenshot. Imagine a forwarded message that reads, “The sky is dark. Punggol PSI is definitely 300 and every school is closed tomorrow.” It has no timestamp, official link or source attribution. This is an invented example for source criticism, not a quotation from a real resident or an authentic 2026 school announcement.
A good source-based response understands that these sources answer different questions. Source A supplies official dated observations and a forecast; B supports investigation of possible sources; C documents policy responsibilities; D illustrates an unverified claim.
The core Geography concept: transboundary pollution
Transboundary means crossing a national or jurisdictional boundary. Smoke does not stop at a border or checkpoint. A fire in one country may affect air conditions in another if the emissions are transported along a suitable atmospheric pathway.
This creates a policy problem: the consequences and the land-management decisions may occur in different jurisdictions. The receiving country can monitor its air, protect residents and cooperate regionally, while source-country authorities and landholders have important roles in fire prevention and control.
The geographical idea connects physical systems (fuel, combustion, wind and precipitation) with human systems (land use, livelihoods, governance, health and economic activity). A response focused only on one side is incomplete.
A specific legal accusation requires more evidence than the Geography statement that regional smoke can cross borders. For accountability and Singapore’s domestic Act, see Punggol Haze and Regional Law.
Why a peatland landscape can contribute persistent smoke
Peat is accumulated partly decomposed organic matter in wet landscapes. When peatland hydrology is degraded and organic material dries, it can become more susceptible to fire. Smouldering combustion may continue below the surface and be difficult to extinguish.
This does not mean every hotspot is a peat fire or that all fires are the same. Fuels, ignition, rainfall, soil moisture and land use vary. A strong case-study explanation avoids attributing every regional smoke episode to one identical landscape.
The long-term response may include keeping peat wet, managing drainage, reducing ignition, restoring suitable vegetation and supporting communities who depend on the landscape.
For the full physical restoration mechanisms, use Punggol Haze and Peatland Restoration.
Monsoon and wind direction: do not reverse the arrow
A southeasterly wind comes from the southeast and generally blows toward the northwest. This naming convention is frequently misunderstood by students who assume the named direction is the destination.
Wind direction at different heights can vary. A coastal breeze felt beside Punggol Waterway is not identical to the meteorological flow that may carry a regional smoke layer. Model maps must be read with their dates, levels and legends.
During an inter-monsoon transition, local storms, showers and variable winds can also influence the movement of smoke. The same fire location may contribute different pollution conditions in Singapore on different days.
Use Meteorological Service Singapore’s wind education and ASMC’s dated map products rather than sketching a plume direction from memory alone.
Source A: what the October 2026 numbers do and do not show
The observed one-hour PM2.5 concentration of 44–148 µg/m³ across Singapore and the observed 24-hour PSI of 159–222 were reported at the same dated update, but they represent different quantities and averaging methods.
The forecast for the next day, 150–230 PSI, is a third type of information. It represents the agency’s expectation for a future period, not a value already measured at Punggol at the time of issue.
Students should not calculate 222 − 148 = 74 and announce a physical reduction in pollution. One value is an index, another is a mass concentration, and a direct subtraction has no meaningful unit.
Nor should students label the national range 44–148 “Punggol’s measured PM2.5”. It was a range across Singapore, not a single North-specific or estate-specific value.
The original Geography data table
The following six values are fictional one-hour PM2.5 concentrations for a teaching exercise. They are deliberately unrelated to the actual NEA reading on 16, 17 or 18 October 2026.
The six labelled hourly observations are listed next.
The horizontal axis of a graph should be time. The vertical axis should be PM2.5 concentration in µg/m³. The graph title must say the series is fictional. Do not replace the axis label with “PSI points”.
The dataset is useful for Maths and Geography skills: trends, variability, mean, range, absolute change and interpretation limits.
Questions 1–5: read Source A accurately
1. What two types of observed air-quality information did NEA report as at 8pm on 16 October 2026?
2. Which part of Source A concerns a future period rather than an observation that has already happened?
3. Why is it incorrect to label the value 148 µg/m³ as the certified PM2.5 of every Punggol flat?
4. What source regions and broad meteorological explanation did NEA mention?
5. Explain why 24-hour PSI 222 and one-hour PM2.5 148 µg/m³ cannot be directly subtracted as though they have the same unit.
Worked answers 1–5
1. NEA reported one-hour PM2.5 concentrations of 44–148 µg/m³ across Singapore and 24-hour PSI readings of 159–222. Both are dated observations over their defined measures.
2. The 17 October 2026 PSI forecast of 150–230. The word forecast is the critical evidence; it describes future estimated conditions.
3. The 44–148 range was reported across Singapore, and Punggol is included under NEA’s North regional reporting framework. It is not an individual measurement for every flat, park or road.
4. NEA described smoke from fires in Kalimantan moving towards Singapore under southeasterly winds, and smoke was also observed over Sumatra. An answer need not invent a specific concession or named fire.
5. The PSI is an index derived from pollutant measurements, while the PM2.5 value is a concentration in µg/m³ over a different averaging window. Subtracting the numbers directly mixes incompatible measures and does not produce a meaningful concentration change.
Questions 6–10: graph and data interpretation
6. What was the highest value in the fictional dataset, and when did it occur?
7. Calculate the range of the six fictional PM2.5 concentrations.
8. Calculate their arithmetic mean, rounded to one decimal place.
9. What was the absolute change from 9am to 10am? State the unit.
10. A student says, “The sea breeze definitely caused the fall between 11am and noon.” Explain why that conclusion is not supported by the fictional dataset alone.
Worked answers 6–10
6. The highest value was 95 µg/m³ at 11am. It is not a certified local reading; it is a value from the labelled fictional table.
7. The range is 95 − 35 = 60 µg/m³. The lowest value is 35 at 9am, so both ends must be identified correctly.
8. Add the values: 35 + 65 + 95 + 55 + 80 + 40 = 370. The arithmetic mean is 370 ÷ 6 ≈ 61.7 µg/m³.
9. The concentration rose from 35 to 65, an absolute increase of 30 µg/m³. The answer is not “30 PSI points”.
10. The table contains PM2.5 observations only, not wind, rainfall or vertical mixing evidence. Several atmospheric factors might explain the change; the actual cause has not been established. A well-written answer distinguishes observed correlation from causal attribution.
Questions 11–14: evaluate sources B, C and D
11. Why is a satellite hotspot useful, and why is it not conclusive proof of who caused Singapore’s haze?
12. How might cloud cover affect Source B’s hotspot information?
13. Explain how an ASEAN peatland-management strategy differs from a live NEA air-quality reading.
14. Identify three reasons why the fictional forwarded screenshot in Source D is an unreliable basis for announcing school closures.
Worked answers 11–14
11. It can indicate a location where possible burning has been detected remotely. It does not by itself establish fuel type, exact plume contribution, land ownership or legal responsibility. Attribution requires additional evidence.
12. Clouds may obscure burning locations, causing satellite monitoring to miss some hotspots under certain observation conditions. A blank area on the map is therefore not automatically proof that no fires exist there.
13. The regional strategy is a long-term policy and prevention framework, while a current NEA reading is an observed air-quality measurement over a defined place and period. Neither can replace the other.
14. It has no clear timestamp, no verifiable official source, and an unsupported claim that all schools are closed. A sky photograph also cannot establish PSI numerically. Any three distinct accurate limitations are sufficient for this original exercise.
Questions 15–18: reason about impacts and responses
15. Explain why an outdoor delivery worker and an office employee may require different practical arrangements during the same haze episode.
16. Distinguish a short-term response that protects Punggol residents from a long-term response addressing regional fires. Give one example of each.
17. Evaluate the statement, “If Singapore opens more haze shelters, the regional problem is solved.”
18. A Geography student wants to investigate how haze affects Punggol families. Design a safe and ethical inquiry method that does not require collecting smoke samples outdoors.
Worked answers 15–18
15. Their time outdoors, exertion and ability to move indoors can differ. The delivery worker may have prolonged cumulative exposure, while the office employee may spend most work hours in a suitable indoor space. Relevant workplace guidance and actual duties matter.
16. A short-term response could be changing a prolonged outdoor activity in line with current official advice. A long-term response could be preventing fires through better peatland water management, safe land use or regional enforcement and cooperation. Both are important but act at different points in the causal chain.
17. Shelters may help some residents reduce exposure and provide respite when activated, but they do not extinguish fires at source or prevent future smoke emissions. The statement confuses management of consequences with prevention of causes. A balanced answer values shelters while explaining why they are insufficient alone.
18. The student could analyse public, timestamped NEA data and conduct a short voluntary, non-identifying questionnaire about changes to household activities, with parental or school supervision and appropriate permissions. They should avoid collecting sensitive medical details unnecessarily and not ask people to spend time outdoors during harmful conditions for the study. Describe the limitations of self-reported data and the need for representative sampling.
A short model explanation: why Singapore is affected by smoke from abroad
Singapore’s haze problem can be understood through the interaction of physical and human geography. Fires may release smoke particles where land use and environmental conditions make burning possible. Prevailing winds can transport emissions across national borders. When the plume reaches Singapore, NEA’s monitoring network can report concentrations and the PSI for defined regions.
The consequences are uneven. An outdoor worker may be affected differently from someone with a short commute, and a child with an existing health condition may need a more cautious activity plan. The same regional reading therefore does not imply equal personal exposure.
Effective management must operate at more than one scale. Immediate action focuses on public information, exposure reduction and suitable activity changes, while long-term strategies include source-region fire prevention, land management and cooperation between governments.
This explanation is useful because it connects causes, transport, impact and response without identifying an unsupported single guilty party.
A stronger evaluation paragraph: which response matters most?
Original practice question: “Preventing fires at source is more effective than helping people avoid haze once it reaches Singapore.” How far do you agree?
Preventing fires at source addresses the emissions before they can be transported across borders, so effective land management and fire prevention offer substantial long-term benefits. For example, appropriate restoration of drained peatlands can reduce conditions that make persistent smouldering fires more likely. Regional cooperation can also help with monitoring and preparedness.
However, prevention cannot guarantee that no smoke will arrive, particularly during difficult dry seasons or where implementation is incomplete. Singapore therefore still needs accurate monitoring, health guidance and practical support for people who must work or travel outdoors. Community facilities and suitable indoor alternatives can help reduce exposure during a specific episode.
I agree that source prevention is central to a sustainable solution, but effective haze management requires both upstream prevention and downstream protection. The strongest response combines them, with measurable outcomes and responsibilities rather than relying on one action alone.
This is an educational evaluation model, not an official examination marking scheme. A good answer makes a judgement and supports it with specific reasoning and limitations.
Physical geography: why a wind arrow is not enough
A smoke plume has a three-dimensional structure. Winds near the ground may differ from those at other heights, and the plume’s movement is influenced by mixing, convection, rain and changing emissions.
A satellite hotspot map may show potential burning, but not all fires are visible during every satellite pass. A wind model may suggest a plausible pathway, yet its time and altitude must be considered. A ground-level PM2.5 measurement establishes that pollution is present within its reporting context but does not uniquely identify the fire that produced it.
Source attribution becomes stronger when independent evidence is brought together. This principle can be generalised to many environmental questions: one instrument rarely answers every part of a complex causal claim.
For deeper chart and wind-map skills, see Punggol Haze Data Literacy.
Human geography: why different groups face different trade-offs
Haze can affect outdoor recreation, school sports, tourism, local businesses, freight activity and people who work outdoors. Some costs arise from changed arrangements, while others relate to illness or prevention measures. Without representative data, it would be wrong to invent an exact average economic loss for Punggol.
People’s ability to respond is not uniform. A parent may be able to keep a child indoors, but a delivery worker may have occupational duties requiring repeated outdoor trips. An older person may need assistance with errands. A school may have institutional decisions about PE that individual residents cannot control.
A Geography answer should therefore assess both environmental processes and social vulnerability, recognising where different people have different resources and choices.
For a detailed discussion of equity, see Punggol Haze and Community Fairness.
The geography of Punggol itself
Punggol’s Waterway, housing estates, public transport, Northshore and nearby coastal spaces give residents many choices in daily life. The town’s greenery and waterfront breezes may improve comfort under suitable conditions, but they do not certify low PM2.5 during transboundary smoke.
The public regional air-quality framework includes Punggol within North. A classroom project should not place different invented official sensors at each landmark to make the map look more detailed.
A strong local case study can instead focus on land-use and mobility patterns: where residents spend time, which activities are prolonged, what indoor alternatives exist and why some groups require more support. Those are genuine geographic questions that can be investigated safely using appropriate information.
For place-related context, use the Punggol Haze Outdoor Activities Guide and the Punggol Haze Indoor Places Guide.
Designing an ethical Geography inquiry
A good research question might be: “How do families in Punggol adjust optional outdoor activities when official haze advisories recommend limiting prolonged exertion?” A suitable investigation could use a voluntary survey and archived official advice, without collecting personally identifiable medical information.
A poor design would send students outside to deliberately inhale smoke or collect particles by breathing into improvised equipment. That increases risk without providing a calibrated scientific sample.
Students should also consider sampling bias. A survey shared only with members of a sports club may overrepresent people who exercise regularly. A survey of one family cannot establish the behaviour of the whole town.
Evaluation should state the sampling method, date, limitations, and what the evidence supports. A modest honest inquiry is more valuable than a dramatic unverified conclusion.
Turning a dated official bulletin into a learning timeline
Create a four-column table: issue date and time, observed readings, forecast period, and stated explanation. For Source A, record the 16 October 2026 issue date, the 8pm observed national ranges, the 17 October forecast and NEA’s regional smoke and wind discussion.
Then look for a later official bulletin and compare only compatible measures. The forecast does not need to match later observations exactly to have been a useful planning tool; it describes expected conditions under uncertainty.
Students can evaluate how new information changed the picture without presenting an old bulletin as today’s situation. This teaches time awareness and the evolving nature of environmental risk.
The same method applies to floods, heat alerts, heavy rainfall and other events where observed conditions and forecasts can be confused.
Avoid six case-study errors
- Mixing units: Treating a PSI index value as a PM2.5 concentration in µg/m³.
- Misdating: Reporting 16 October’s observation as a live value days later.
- Inventing local precision: Describing a national range as a sensor at a Punggol bus stop.
- Over-attributing: Declaring a specific company legally responsible based on a single hotspot.
- Oversimplifying responses: Claiming masks, shelters or one rainstorm can independently solve all causes.
- Misusing examination labels: Presenting original practice as an actual past or predicted SEC Geography paper.
A good case study is credible because it is careful about source context, not because it contains the most impressive-looking statistics.
A 45-minute classroom sequence
Minutes 0–10: Read Source A and distinguish observed numbers from the next-day forecast. Minutes 10–20: Graph the fictional dataset and complete Questions 6–10 with correct units. Minutes 20–30: Discuss the limits of Sources B, C and D and answer the evaluation questions. Minutes 30–40: Write a balanced paragraph on preventing emissions at source versus managing exposure in Singapore. Minutes 40–45: Review one uncertainty and one example of different responsibilities across scales.
This is a suggested educational plan, not an official SEC examination timetable or requirement. A teacher may use only the data questions or expand the inquiry over several lessons.
For students at different ability levels, the task can be differentiated without changing the facts. One student identifies the correct value; another explains why comparison is invalid; a stronger student evaluates evidence quality and policy trade-offs.
The objective is independent reasoning anchored in source evidence.
Frequently asked questions
Is haze explicitly a compulsory case study in the 2027 SEC G2 or G3 Geography syllabus?
This article does not claim that. It uses haze as an original real-world context for Geography inquiry, geographical processes, source use, environmental management and evaluation. Refer to the full official syllabus for examinable topic requirements.
Does Punggol have its own officially published PSI for each neighbourhood?
No. NEA includes Punggol in the North reporting region. Estate-level readings should not be invented from a national or regional range.
Were the October 2026 PSI values in Source A forecasts or observations?
The 24-hour PSI 159–222 was an observed range reported as at 8pm on 16 October. The 150–230 range was NEA’s forecast for 17 October.
Is 148 µg/m³ a PSI number?
No. It is a one-hour PM2.5 concentration value in mass per cubic metre within the dated national range. PSI is an index with a different basis.
Do all satellite hotspots represent confirmed peat fires?
No. They are indications of possible burning, subject to detection limitations. The exact fuel, source and legal responsibility require further evidence.
Can a wind map alone prove who caused the pollution?
No. Wind information supports possible transport pathways, but a reliable attribution typically considers source data, timing, monitoring and other relevant evidence.
Are the six hourly measurements in the table real Punggol data?
No. They are explicitly fictional and used solely to teach graphing and calculation skills.
What makes a good Geography evaluation answer?
A clear judgement, supported reasons, real distinctions between scales and responsibilities, and consideration of significant limitations or counterarguments.
Can students collect their own smoke samples during haze?
They should not be asked to increase exposure unnecessarily. Use safe secondary data and appropriately authorised, ethical inquiry methods.
Are the practice questions from an official past paper?
No. All eighteen questions, the fictional dataset and the worked responses are original educational examples, not copyrighted examination-paper reproductions or predictions.
Connected Punggol and eduKate Geography resources
For the primary Punggol haze hub, use Punggol Haze Complete Guide. For the chronology of major episodes, read Punggol Haze History. For the regional legal framework, see Punggol Haze and ASEAN.
For original Mathematics and Science problems, use Punggol Haze Worksheets. For English practice, use PSLE Haze Comprehension. This page’s distinct job is geographical source evaluation and evidence-based explanation.
Official sources, syllabus scope and data disclaimer
Compiled 18 October 2026. The source pack clearly distinguishes historic dated official information, policy frameworks, satellite evidence and invented teaching scenarios. The original practice questions are not official or predicted SEC examination questions.
- SEAB: 2027 SEC G2 Humanities, Social Studies and Geography, K229
- SEAB: 2027 SEC G3 Humanities, Social Studies and Geography, K335
- NEA: Haze Situation Update, 16 October 2026
- NEA: Official Current Haze Readings
- ASMC: ASEAN Smoke, Hotspot and Meteorological Monitoring
- ASEAN: Transboundary Haze Agreement
- MSS: Winds and Local Circulations
The strongest Geography answer connects physical causes and human consequences while respecting the limits of its sources. Accurate dates, units, scale and causal reasoning matter more than dramatic headlines.
Connected Punggol Haze Reading and Learning Guides
Original reading, listening, writing and Geography practice. These are not official examination papers. For current conditions use NEA’s live air-quality service.
Punggol Haze Science Pathways: Original 2026–2027 Practice
Choose the Science level that matches the learner’s actual MOE or SEAB syllabus. The four guides contain original worked examples and are not official past examination papers. Haze is a learning context; use NEA’s live air-quality information for current health decisions.


