
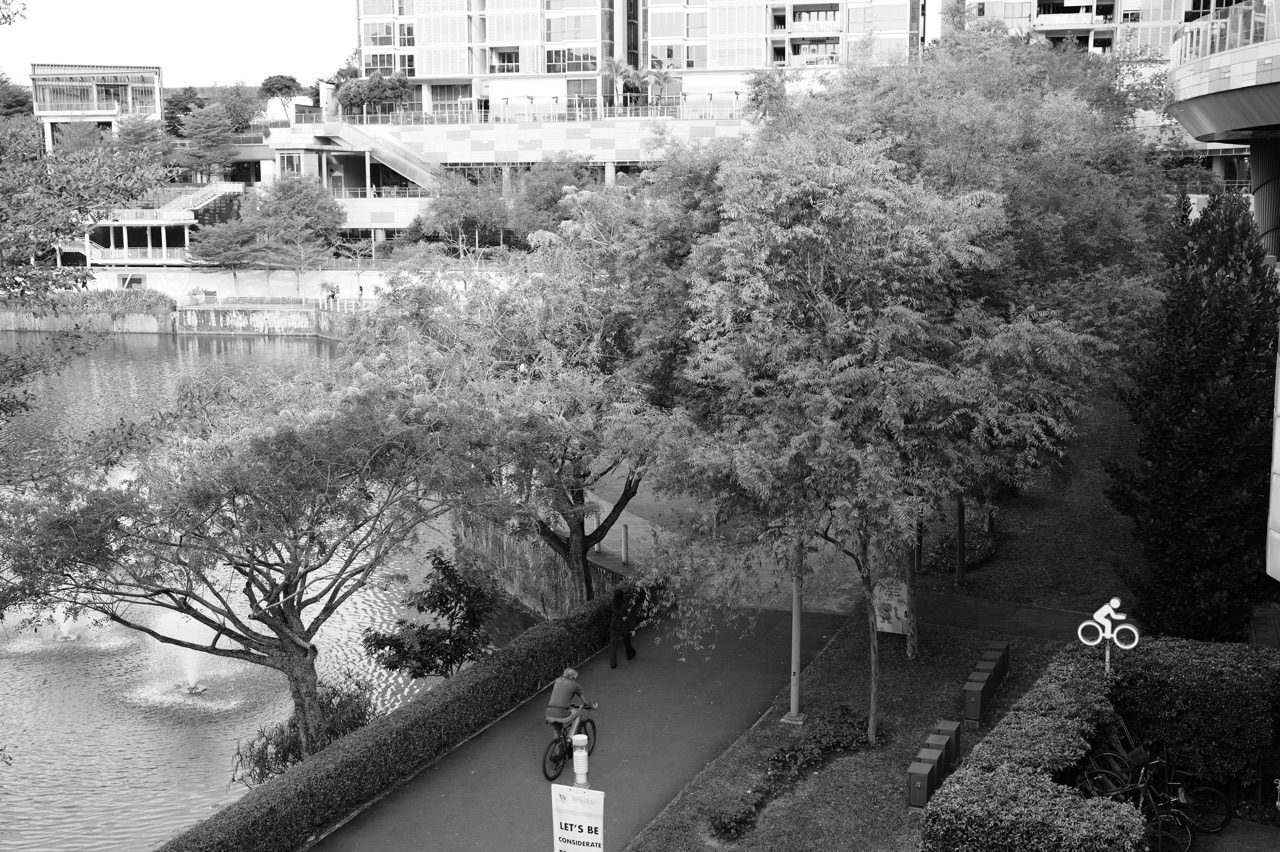
The top 10 things to do in Punggol for Statistics students are to design a small park sampling plan, compare time-standardised path-use rates, recognise weekday and weekend confounders, calculate mean and median from a private reading log, study fictional hawker-price distributions, chart NEA air-quality data correctly, learn NParks’ bird-count survey methods, compare transport predictions with actual personal journeys, repair misleading chart axes and evaluate a hypothetical causal claim about town development.
Best first Statistics project: use a harmless fictional five-day dataset to calculate mean, median, range and the effect of an outlier. For a Punggol field connection, choose a ten-minute anonymous observation from a lawful, uncrowded Waterway Park viewpoint, with no personal information collected. For real public data, check NEA’s measurement times and reporting regions. A table without a sampling method is not enough to support a town-wide conclusion.
This October 2026 guide is different from a Mathematics trail based on shapes, distances or basic money sums. Statistics concerns how data are selected, what denominators mean, how uncertainty enters an estimate, why charts can mislead and when an apparent pattern does not justify causal claims. Every worked number below is illustrative unless an agency fact is explicitly cited.
What a strong Punggol Statistics investigation needs
- Population: who or what is the conclusion meant to describe?
- Sample: which observations were actually selected, how and when?
- Unit: a unique person, a path passage, an individual bird, a session or a menu item?
- Variable: the measured quantity, with appropriate units and reporting period.
- Summary: mean, median, rate, proportion or chart chosen for the question.
- Uncertainty: confounders, missing values, detection bias, sample size and limits.
- Ethics: no unnecessary personal recording or unsafe fieldwork.
Statistics can be numerically correct but conceptually wrong
A sample average may be computed perfectly and still mislead readers if the sample is unrepresentative. Counting twenty people at one bus stop does not answer how every Punggol resident travels. An hourly regional haze reading is not a person’s own household exposure. A bird survey conducted for twenty minutes is not directly comparable with one conducted for ten without acknowledging effort. Statistical skill starts before any arithmetic.
When presenting results, use careful nouns. ‘Passage events’ is not the same as ‘unique people’, and ‘birds heard’ is not necessarily ‘individual birds’. A missing environmental reading is not a zero concentration. A route estimate is not a guaranteed arrival. This is exactly the kind of reasoning that improves decisions outside school.
Ten Punggol Statistics investigations
1. Design a sampling plan before going to Punggol Waterway Park
Where: One short public park viewpoint, or a paper plan based on NParks park information.
The statistical idea
Statistics begins with what is being counted and how observations are selected. A convenient sample of whatever happens to be visible beside a bridge on one morning cannot support a claim about every Punggol resident or all park visitors. Even a correct numerical calculation may be attached to the wrong population. A public park offers a useful context for identifying target population, sampling frame, observation unit and time window.
Method and safe data collection
Read NParks’ current park guidance and choose a narrow question such as ‘what categories of public path use are visible to me during two short intervals?’ If an actual visit is suitable, count only broad anonymous activity categories from a safe position that does not block the path. Do not photograph identifiable people or follow them. Record the time, weather and site; do not ask strangers to participate without suitable consent or study approval. Compare that observational record with a fictional random-sampling design on paper.
Original worked example
In a deliberately illustrative ten-minute example, a learner counts 12 pedestrian passages and 8 bicycle passages, a total of 20 events. The event shares are 60% pedestrian and 40% bicycle. This does not prove that 60% of Punggol residents walk, that every person was counted once or that the pattern remains the same all day. The word ‘passages’ matters because a returning person could be counted twice.
A more demanding question
Write the same research question with three different populations: all Punggol residents, all users of a particular connector section during a week, and observed passage events in one ten-minute session. Ask which can be described by the example. Explain why probability sampling would be needed for stronger statistical generalisation and why public-space ethics still apply.
Privacy, sampling and interpretation limits
Keep your own activity safe and non-intrusive, and do not use identifiable images or record mobility or disability details about strangers. Respect shared paths, privacy and current park rules.
Primary reference: Design a sampling plan before going to Punggol Waterway Park. Check the date and context of any data reused.
2. Turn a path-use count into a rate with a correct denominator
Where: A publicly accessible stretch of Punggol Waterway Park Connector.
The statistical idea
Counts and rates answer different questions. A section observed for twenty minutes will often accumulate more passage events than one watched for five minutes, even if both have a similar underlying level of use. Students can practise standardising by observation time before comparing sites or sessions. A park connector is also an example of a multiuser space where a counting method must avoid interfering with real travel.
Method and safe data collection
Make a sample table with start, end, duration and anonymous event count. Use made-up figures to learn the method first. If observing a real short interval, record the date and conditions, keep participants anonymous, and take no action that affects their route. Compute a rate such as passage events per ten minutes or per hour, identifying the observation unit. If two directions are combined, say so rather than describing only one direction’s flow.
Original worked example
Illustrative Session A observes 24 passage events in twelve minutes, giving two events per minute. Session B observes 15 in five minutes, giving three events per minute. Session B has the smaller raw count but the larger time-standardised rate. A student claiming A was busier because 24 exceeds 15 has ignored different exposure durations. This does not establish an official usage statistic for either real Punggol site.
A more demanding question
Ask whether hourly extrapolation from a five-minute sample is reliable when flows vary throughout the day. A linear multiplication of three per minute by sixty produces 180 per hour arithmetically, but may be a poor prediction if rush patterns vary. Distinguish the sample rate from a forecast.
Privacy, sampling and interpretation limits
Do not set up cameras, tripods or counters on the path or collect travel histories. A spontaneous short observation should not be presented as an authorised official traffic survey.
Primary reference: Turn a path-use count into a rate with a correct denominator. Check the date and context of any data reused.
3. Compare weekday and weekend observations without inventing causation
Where: The same safe public Punggol viewpoint on separate suitable dates, or an entirely fictional schedule.
The statistical idea
Human activity changes by time, weather, school calendars, public events and transport operation. Comparing a weekday morning with a weekend afternoon involves several variables at once. A statistics project becomes more rigorous when students identify those confounders rather than immediately declaring that the day of the week caused the difference. The lesson applies to transport flows, park use, shopping and public library visits.
Method and safe data collection
Design matched observation windows: comparable duration, location, event definition and, where practicable, time of day. Record weather and any known event or closure. If no suitable real visit is possible, create an illustrative four-session dataset and practise a fair comparison on paper. Avoid directing or surveying strangers. Calculate time-standardised rates and display the samples with dates; a single observation per condition provides weak evidence of a lasting pattern.
Original worked example
Fictional observations are 15 passage events in ten minutes on Tuesday and 28 in ten minutes on Sunday, while Sunday’s weather is much cooler and a nearby event takes place. The difference is 13 events under the illustrative sample, not proof that weekends always increase use by 87%. The percentage calculation uses 13/15, but causality is unresolved because multiple conditions changed.
A more demanding question
Propose repeating matched sessions over several weeks. Ask what random variation might look like and why confidence intervals are useful only when the sampling approach supports relevant inference. Encourage students to describe associations and uncertainty, not convert a single difference into an explanation of human motivation.
Privacy, sampling and interpretation limits
Do not publish location-sensitive user behaviour or make claims about identifiable individuals. Avoid crowded or hazardous observation positions; postponing a session for weather is an appropriate decision.
Primary reference: Compare weekday and weekend observations without inventing causation. Check the date and context of any data reused.
4. Use a private reading log to compare mean, median and outliers
Where: Punggol Regional Library at One Punggol, with personal data kept private.
The statistical idea
NLB’s regional library provides a local reading context, but it does not need to be used for a public survey. Tracking a student’s own reading minutes over several days offers an ethically simple way to learn central tendency. Means are influenced by unusually large observations; medians describe a middle value and can be more stable under certain distributions. Neither statistic by itself measures the quality of comprehension.
Method and safe data collection
Use only your own voluntary reading sessions or a completely fictional dataset. Note duration and date, with a consistent definition of what counts as reading time. Compute total, mean, median and range. If a book is borrowed through the library, follow normal NLB rules but do not store a borrower identifier in the study sheet. Make a simple dot plot or bar chart with a labelled vertical scale; do not invent other students’ reading histories.
Original worked example
Fictional five-day reading times are 10, 10, 15, 20 and 65 minutes. The total is 120, the mean 24 and median 15. A student who calls the typical day 24 minutes without acknowledging the unusually long fifth session may give a misleading picture. A careful report provides both measures and explains the outlier’s role.
A more demanding question
Add a second hypothetical dataset without the 65-minute value and compare the mean. Discuss which summary best answers different questions: total reading commitment versus a typical session. The shape of the distribution matters. The student should not infer that a long session produced better comprehension or that all Punggol pupils share the same habit.
Privacy, sampling and interpretation limits
Do not record library users’ names, book-borrowing histories or identifiable photos without proper permission. Personal learning data need not be public.
Primary reference: Use a private reading log to compare mean, median and outliers. Check the date and context of any data reused.
5. Compare fictional hawker menu prices with a median rather than a misleading average
Where: One Punggol Hawker Centre on Level 2, with live prices checked only when actually visiting.
The statistical idea
Menu data can contain inexpensive staples and a few much higher-priced options. A mean is sensitive to the upper tail, while a median can indicate the central item in an ordered list. For food-price research, data selection matters: comparing prices across different serving sizes and food categories can be misleading before any calculation begins. A classroom example must never invent Punggol stall menus and present them as verified current prices.
Method and safe data collection
Use SFA and PA information to establish the location of the real food centre, then choose either a clearly fictional menu or independently date-checked public displayed prices. Define one comparable product category and serving basis. Sort the figures, compute median and mean, and label how the sample was selected. Avoid claiming a mall or hawker centre as a whole is cheap or expensive based on a handful of deliberately chosen stalls.
Original worked example
Illustrative prices in Singapore dollars are 4, 5, 5, 6 and 20. The median is S$5 and the mean is S$8. The mean is pulled upwards by one high value. This example explains a statistical property but does not prove that any Punggol centre sells those meals at those prices. If the expensive item is a large shared platter, the sample is also not comparing equivalent servings.
A more demanding question
Propose a stratified analysis by product type, but explain why any generalisation needs a defined complete menu population or suitable sampling procedure. A weighted average may be more relevant when items have very different sales volumes, but those weights would have to be obtained and validated.
Privacy, sampling and interpretation limits
Do not interfere with food-service staff or customer queues to gather a spreadsheet. Current menu prices, food quantities and dietary needs vary; an old screenshot is not a reliable contemporary dataset.
Primary reference: Compare fictional hawker menu prices with a median rather than a misleading average. Check the date and context of any data reused.
6. Create a time-series chart from NEA air-quality information with timestamps
Where: An indoor statistics study using the official NEA myENV guidance.
The statistical idea
NEA’s one-hour PM2.5 and 24-hour PSI describe different metrics and time horizons. A data scientist must not combine them as though both were the same measurement. A line graph can reveal patterns only when values refer to comparable quantities and appropriate timestamps. Public environmental data also have regional reporting scopes, which should not be recast as precise measurements inside an individual’s home.
Method and safe data collection
Use NEA’s public explanation of its readings, then draw a fictional hourly PM2.5 table with region, timestamp, numeric value and unit. Include one missing record. Plot the valid values in time order, showing a gap or an explicit unavailable label rather than forcing a false zero. If using actual public data, preserve the true source and timestamp and comply with any data-service rules. Do not publish a fictional series as real current haze information.
Original worked example
A hypothetical hourly series is 12, 15, missing, 21 and 18µg/m³. The mean of the four valid readings is 16.5µg/m³. It would be 13.2 only if the missing slot were wrongly treated as zero, calculated as (12+15+0+21+18)/5. The correction demonstrates that missingness is a property of the data, not a measured clean-air event.
A more demanding question
Ask whether five hourly values are enough to describe a whole month’s air conditions. They are not. Learn why temporal aggregation needs appropriate sampling, data completeness and clear rules. More advanced students can test a time-series program’s response to missing timestamps and duplicate rows before interpreting any peak.
Privacy, sampling and interpretation limits
Use real-time NEA safety advice for actual outdoor decisions. A student chart is not an authoritative individual exposure measurement or medical recommendation.
Primary reference: Create a time-series chart from NEA air-quality information with timestamps. Check the date and context of any data reused.
7. Understand biodiversity counts through NParks’ Garden Bird Watch methods
Where: NParks Garden Bird Watch programme and its documented survey method.
The statistical idea
NParks’ Garden Bird Watch uses training, assigned sites and point-count procedures to track garden birds. This is an excellent statistical case because a consistent observation method reduces, but does not erase, differences in detection probability, observer experience and repeated sightings. A casual family list is not interchangeable with an approved survey dataset, especially when its locations and durations differ.
Method and safe data collection
Read the current NParks programme page and a published methodology summary. Record the actual rules for training, assigned sites and count windows as documented by the programme. For desktop practice, create a fictional three-point dataset with equal ten-minute windows and count species only when sufficiently identified. If joining for real, register in an open intake and follow the organiser’s current protocol; the website’s April 2026 dates must not be treated as a later live shift.
Original worked example
A fictional point-count record notes five birds at Station A and eight at Station B, but the second observer watched for twice as long. The count difference cannot directly establish that B has more birds. Correcting for time or, preferably, adhering to the same prescribed ten-minute protocol makes comparison more meaningful. Even then, unknown detection probabilities remain.
A more demanding question
Ask how training reduces species-identification bias and why a repeated bird sighting can cause double-counting. Explore how individual counts differ from species richness. A robust statistical report describes the observational units and the survey process before drawing population trends.
Privacy, sampling and interpretation limits
Do not disturb nests, lure birds with calls or trespass to obtain a count. Survey enrolment, age and locations depend on official current intake conditions.
Primary reference: Understand biodiversity counts through NParks’ Garden Bird Watch methods. Check the date and context of any data reused.
8. Read a public transport journey estimate as a prediction, not a guarantee
Where: LTA MyTransport and a genuine Punggol MRT or LRT journey when needed.
The statistical idea
LTA provides journey-planning and estimated bus arrivals. Statistics students can investigate the difference between a scheduled or estimated travel duration and a measured personal journey. A single journey is one observation and cannot establish average peak-hour reliability across Singapore. Route choice, interchange walking, waiting and accessibility conditions are different contributors to total elapsed time.
Method and safe data collection
Use a journey you actually need to make and read its current transport information safely before travelling. Record your own estimated and actual total journey time privately, not the movements of other passengers. If the purpose is classroom learning, use fictional observations in a small table and compute differences. Name whether duration covers platform waiting, walking and transfer time. Show both direction and time of day in a report rather than presenting a single number as a service-wide guarantee.
Original worked example
A fictional trip planner predicts 22 minutes, while the illustrative actual door-to-door trip takes 27. Error is +5 minutes, or about 22.7% relative to the predicted value. This is one hypothetical error, not a measured reliability rating for Punggol MRT. Repeating over many comparable journeys could support a more useful distribution, but it would still reflect the student’s chosen travel circumstances.
A more demanding question
Compare mean absolute error with signed mean error using fictional records. An algorithm can have positive and negative errors that cancel in the signed mean, so the absolute measure may be more informative about typical magnitude. Discuss limitations if all samples are from one user’s commute.
Privacy, sampling and interpretation limits
Never time trains by approaching platform edges or obstructing passengers. Current service disruption notices and accessible route conditions outrank an old planner estimate.
Primary reference: Read a public transport journey estimate as a prediction, not a guarantee. Check the date and context of any data reused.
9. Fix a misleading bar chart that changes its baseline
Where: A home or classroom analysis using fictional Punggol data and public communication examples.
The statistical idea
A bar chart represents quantity by bar length, so a truncated or inconsistent baseline can visually exaggerate modest differences. Other misleading devices include unequal category widths, missing units and dramatic labels on tiny convenience samples. A student who can diagnose chart design is less likely to mistake a polished infographic for sound statistics.
Method and safe data collection
Create a hypothetical Punggol-themed example with values 40, 42 and 45. Draw one bar chart with a zero baseline and a second using a misleading 39 baseline, clearly labelling the second as a warning example. Compare the visual impression with the actual differences. Discuss which graph form would be appropriate for different tasks and why any data source needs attribution. Do not imply the invented data describe a real place or business.
Original worked example
Values of 40 and 45 differ by 5, or 12.5% relative to 40. A chart starting at 39 makes the first bar appear only one unit tall and the second six units tall, creating a sixfold visual impression for a 12.5% numeric change. The repair is to display the correct scale and label the values plainly, or choose a suitable alternative chart whose limitations are clear.
A more demanding question
Examine how a line graph’s axis decisions can be appropriate for a technical trend yet potentially misleading when shown without context. Consider annotating rather than distorting the axis, and identify how units and comparison periods affect interpretation. The question is not ‘all truncated axes are always fraudulent’ but ‘does the visual encode the quantity transparently for this audience?’.
Privacy, sampling and interpretation limits
Use fictional values or properly sourced aggregate data, not unverifiable claims about identifiable businesses or communities. Avoid copying copyrighted infographics without permission.
Primary reference: Fix a misleading bar chart that changes its baseline. Check the date and context of any data reused.
10. Explain why correlation in a town does not prove causation
Where: Desktop study using HDB, LTA and JTC accounts of Punggol’s development.
The statistical idea
Punggol’s growth includes housing, public transport changes, new amenities and Punggol Digital District’s phased development. A student might observe that foot traffic and shopping activity increased around a new station, but the simultaneous changes do not by themselves establish a causal effect. New residents, school terms, shops, weather, seasonality and events may all change outcomes. Sound analysis specifies a counterfactual rather than assuming two correlated events are causally linked.
Method and safe data collection
Read LTA’s Punggol Coast opening date and JTC’s description of currently operating district amenities. Write a hypothetical research question about the effect of transport access on a selected aggregate outcome. Identify at least three confounding variables. If using fictional before-and-after counts, show them clearly as imaginary and state why they cannot validate a real business impact. A proper study would require credible repeated measurements and a suitable comparison design.
Original worked example
Illustrative foot-traffic counts rise from 100 to 130 events between two periods, a 30% increase. If the periods also differed in weather and new shop openings, the entire rise cannot be credited to the station. A student who writes ‘the station caused 30% extra business’ has confused an association with causality and activity with revenue. The correction identifies what would need independent evidence.
A more demanding question
Discuss possible comparison groups, seasonal trends, selection effects and the limitations of difference-in-differences without pretending a class worksheet is a formal causal estimate. Explain why business sales require real authorised data and cannot be inferred from people walking past a storefront.
Privacy, sampling and interpretation limits
Do not obtain commercial financial records or track visitors without permission. A town development article should not publish speculation about a named business as though it were verified performance.
Primary reference: Explain why correlation in a town does not prove causation. Check the date and context of any data reused.
How to understand confidence without promising certainty
A statistical interval is meaningful only in the context of its sampling method and assumptions. Suppose a completely fictional random sample of 100 appropriate independent responses has 60 positive answers to a clearly defined question. Its sample proportion is 0.60. The familiar approximate standard error under a simple binomial model is the square root of (0.60×0.40)/100, around 0.049. This does not mean that the true town proportion is 60%, nor does the usual approximate interval correct a convenience sample taken at one attractive public viewpoint.
For a large enough suitable random sample and a valid model, an approximate 95% interval might be built as p plus or minus 1.96 times the standard error. But the construction depends on conditions and the interpretation is about a repeated sampling procedure, not a 95% probability that one fixed unknown parameter moves inside a particular completed interval. For classroom learning, the more important first question is whether the sample selection permits generalisation at all.
A survey of the ten people who happen to walk by one learner cannot become an unbiased estimate of all Punggol households merely by adding decimal places or a confidence interval. Similarly, a photograph of a park at one time does not measure annual visitor numbers. Statistical sophistication is most visible when students refuse unsupported extrapolation.
Three Punggol Statistics assignments
A no-contact park sampling exercise
Choose a public path viewed from a safe place, with no photos or personal identifiers. Define an anonymous event category and a short time window. If conditions allow, count events and report the result with date, location, weather and duration. Calculate a time-standardised rate and explain why it describes only that period. Alternatively, use fictional data on paper. The assignment should never obstruct paths or treat individuals as research subjects without ethical safeguards.
A library reading-data analysis
Use your own voluntary reading log and compute a mean, median and range from several sessions. Make a graph and then introduce a hypothetical outlier to see what changes. This exercise needs no public survey and can be completed with normal library borrowing or at home. Present the study as personal data rather than a claim about every student in Punggol.
A source-led environmental time series
Start with NEA’s explanation of PSI and one-hour PM2.5. Use a clearly fictional dataset containing valid, duplicate and missing records. Identify units, reporting region and timestamps. Draw a graph with appropriate missing-data handling, then write one sentence explaining why it should not be used for health advice. Advanced students can examine actual public datasets under the relevant provider rules and include the source and retrieval time.
Ten common statistical errors worth repairing
- Calling repeated path passages a count of unique residents.
- Comparing different observation durations without adjusting for time.
- Attributing a weekday/weekend difference to the day alone while ignoring weather and events.
- Using a mean without noticing that one outlier dominates it.
- Comparing non-equivalent meal types and declaring an average price for a whole hawker centre.
- Replacing missing PM2.5 values with zero.
- Mixing 24-hour PSI with hourly PM2.5 in the same numerical mean.
- Confusing count of bird calls with count of individual birds.
- Truncating a bar chart’s baseline without making the distortion clear.
- Claiming a transport or district development caused all observed economic change.
Frequently asked questions
What makes Statistics different from a Mathematics trail?
Statistics focuses on sampling, data interpretation, uncertainty and inference rather than only calculating quantities from a defined question.
Where can I do Statistics fieldwork in Punggol?
Use lawful, safe public places for narrowly defined anonymous observations or analyse source-led data from home.
Do I need to interview strangers?
No. Personal reading logs, published official datasets and fictional examples are often more appropriate for school learning.
Can I count people on a public path?
A non-intrusive anonymous event count may be appropriate in some contexts, subject to permissions and safety; it does not identify unique residents or establish a town statistic.
What is a sampling frame?
The set of units from which a sample is selected, which must be defined before claims about the target population.
What is a convenience sample?
A sample selected because members are easy to reach, often with selection bias that limits generalisation.
What is the difference between count and rate?
A count is a total, while a rate uses a denominator such as time or exposure to make contexts more comparable.
How are mean and median different?
The mean averages values arithmetically; the median is the middle ordered value and can be less sensitive to extreme observations.
Can a library reading log represent all Punggol pupils?
No. One person’s reading log is a personal sample, not a representative town survey.
Why might a meal-price average mislead?
Differences in product type, portion size and a few extreme prices can change its meaning.
What if a haze-data time slot is missing?
Keep it as missing unless a clearly justified method applies, and never silently invent a zero reading.
Can one-hour PM2.5 be averaged with 24-hour PSI?
No. They are different metrics and time bases, not compatible entries in a single numerical average.
Why does NParks train Garden Bird Watch volunteers?
Training and standardised methods help reduce identification and observation inconsistencies.
Do older Garden Bird Watch dates guarantee a current shift?
No. Check the current intake and organiser confirmation for any formal survey.
What is sampling bias?
Systematic selection that makes some units more likely to appear, potentially distorting the estimate.
What is a confidence interval?
An interval produced by a statistical procedure, interpreted under its method and assumptions, to express uncertainty about a parameter.
Can a confidence interval fix an unrepresentative sample?
No. Mathematical precision does not remove selection bias.
Why should bar charts often start at zero?
Their lengths encode magnitudes, so a nonzero baseline can exaggerate small differences if not handled transparently.
Does correlation prove causation?
No. Confounding, selection effects and other changes may explain an apparent relationship.
How should a student end a fieldwork report?
State the measured result, data source and sampling method, then identify the limitation that matters most for the conclusion.
Official data sources and related Punggol guides
- Design a sampling plan before going to Punggol Waterway Park
- Turn a path-use count into a rate with a correct denominator
- Compare weekday and weekend observations without inventing causation
- Use a private reading log to compare mean, median and outliers
- Compare fictional hawker menu prices with a median rather than a misleading average
- Create a time-series chart from NEA air-quality information with timestamps
- Understand biodiversity counts through NParks’ Garden Bird Watch methods
- Read a public transport journey estimate as a prediction, not a guarantee
- Fix a misleading bar chart that changes its baseline
- Explain why correlation in a town does not prove causation
- Singapore Department of Statistics public data catalogue
- Data.gov.sg documented real-time environmental APIs
- Punggol Mathematics trail with units and models
- Punggol Geography research and sampling
- Punggol data validation and computer-science workflows
- Punggol Economics trade-offs and evidence
- eduKateSG explanation and error diagnosis standard
A careful statistic says exactly what it describes
Punggol supplies plenty of real-world situations to think with, from public paths and transport to reading habits and environmental records. Choose a narrow question, obtain data safely, define your units and denominator, and explain what you cannot conclude. The best statistical result is not always the largest number of decimal places. It is the most honest answer the evidence can support.


