
The top 10 things to do in Punggol for mathematics trail explorers are to compare official Waterway Park route lengths, identify angles at its bridges, estimate a short walk’s average speed, count LRT station intervals, solve a hawker-meal budget at One Punggol, compare unit prices, construct reading-data charts at Punggol Regional Library, create an area model inspired by HDB’s Eco-Town, practise hypothetical water-flow calculations after studying Lorong Halus Wetland, and use scale drawings based on the public architecture of Punggol Digital District.
Best quick activity: start at a safe Waterway Park viewpoint and choose just one maths question. NParks distinguishes a 4.2km nature walk from an 8.4km named park connector; that distinction is already a valuable lesson in reading data accurately. For an indoor exercise, use a fictional One Punggol hawker menu to practise decimal budgeting. For older students, a paper-scale drawing or chart offers more challenge without a long physical journey.
This October 2026 guide separates three types of numbers: official facts such as the length of a named route, genuinely observed or measured data from a visit, and invented values used only to teach a method. Every worked example is labelled. Students should never publish a classroom-assumed price, flow rate, bridge angle or solar-output figure as a real Punggol measurement.
Choose your mathematical learning target
- Primary 1–2: counting stops, naming shapes, comparing small totals and reading public signs.
- Primary 3–4: metres to kilometres, elapsed time, charts, basic budgets and area in models.
- Primary 5–6: speed, ratio, fractions, percentages, unit costs and structured word problems.
- Secondary 1–2: averages, representative data, scale drawings, proportional reasoning and graph interpretation.
- Parents and teachers: choose one question, agree on a safe route, use an original example and let the child explain the first incorrect step before correction.
- Need a fully indoor activity: use library materials, official maps and fictional arithmetic values without claiming a site visit occurred.
Why local field mathematics works
Mathematics becomes easier to transfer when a learner can connect a symbol to a real-world relationship. A distance on a sign is different from the time it takes a particular person to walk it. A lower unit price does not necessarily produce a lower total bill. A longer rail route can be more convenient if it changes the number of transfers. These questions force students to identify the relevant quantities before choosing an operation.
Good trail mathematics follows four habits. First read and define the quantity; then choose the mathematical model; calculate with units; finally check whether the result makes sense in the actual situation. A correct computation can still answer the wrong question. When the field observation is uncertain, write an estimate rather than increasing the number of decimal places.
The goal of a small Punggol learning outing is not to cover ten places in a day. Most learners gain more from two original problems completed carefully than from a dozen hurried photos. A public walkway is shared space, so students should write notes while safely stopped, not while crossing paths or standing near water edges.
Ten practical Punggol maths activities
1. Compare the 4.2km Waterway nature walk with the 8.4km park connector
Where: Punggol Waterway Park and its designated park-connector network.
What the site teaches
NParks lists a 4.2km easy Punggol Waterway Park nature walk, with a typical one-to-two-hour description. Separately it lists an 8.4km Punggol Waterway Park Connector. Those are two different route descriptions, not a statement that a visitor must travel 12.6km or that the connector is exactly a round trip of the nature walk. Comparing published lengths is an excellent lesson in reading labels before calculating.
What to do, step by step
Read the two official pages and write the source, named route and length in a small table. Convert 4.2km to 4,200m and 8.4km to 8,400m. Divide the second length by the first, obtaining 2, then ask what that mathematical relationship proves. It proves only the numeric ratio of the two stated lengths. It does not prove that the physical paths coincide. Plan a much shorter segment from a confirmed public entrance if you actually visit.
Original worked example
Illustrative calculation: a child chooses a 600m outward path segment and returns on the same path. Total distance is 600+600=1,200m, or 1.2km. At a hypothetical constant walking speed of 3km/h, moving time would be 1.2 ÷ 3 = 0.4 hours, or 24 minutes, excluding stops. The actual walking time can vary with the user, terrain, crowds and weather. The worked number must never be presented as a live travel estimate.
An extension question
Try a reverse question: a family decides to walk at most 1.6km in total using the same out-and-back route. What is the maximum outward leg? It is 0.8km. Check the map and a real safe turnaround before relying on the calculation. Discuss why a mathematically correct distance can still describe an unsafe route if it includes a closed footpath.
The common mistake and the safe boundary
Avoid confusing the waterway’s physical length, the park nature walk and the named park connector. Do not use straight-line map measurements as guaranteed walking distances or convert a published route into a timed challenge for children.
Primary source: Compare the 4.2km Waterway nature walk with the 8.4km park connector. Verify the current access and publication date for your route.
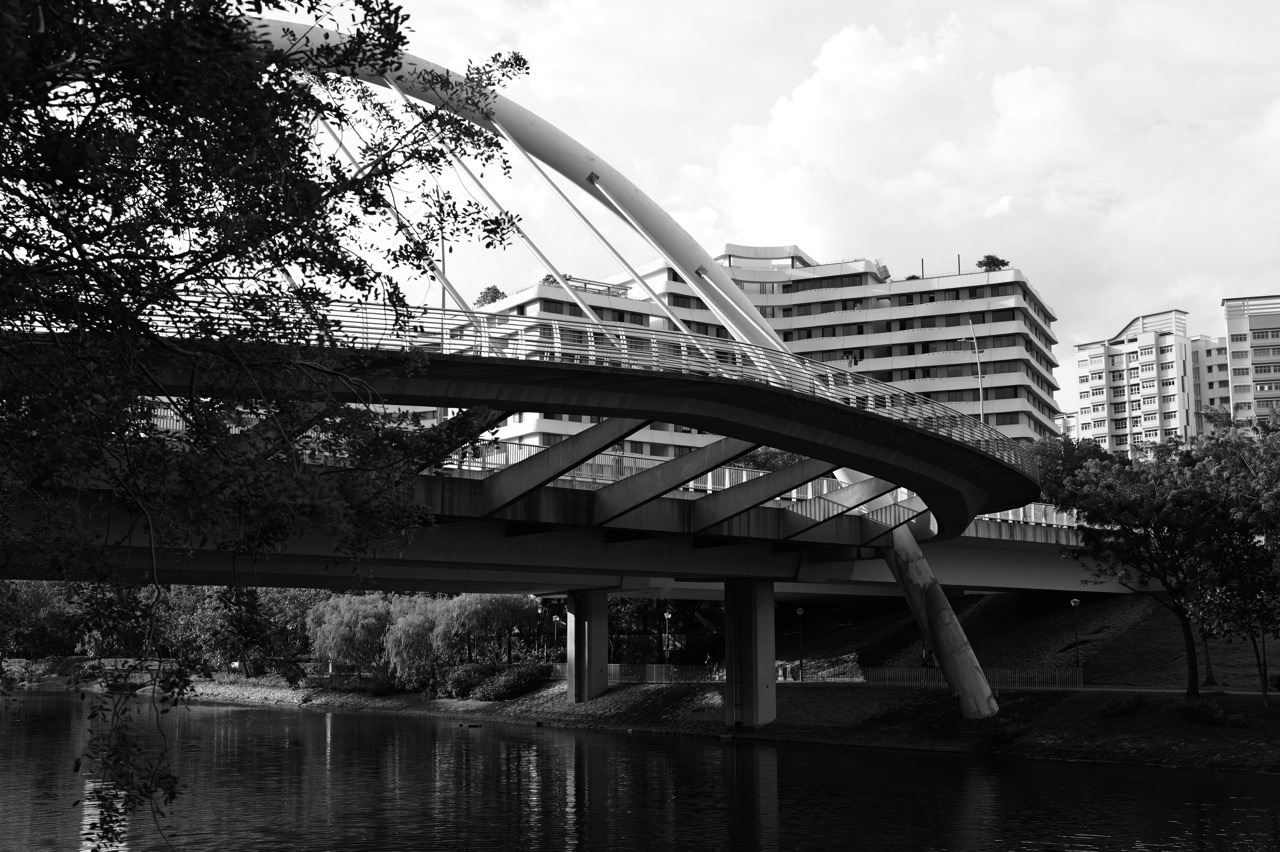
2. Look for angle types and symmetry near Waterway Park bridges
Where: Public viewpoints for Jewel, Wave, Sunrise and Kelong bridges.
What the site teaches
NParks identifies Jewel, Wave, Sunrise and Kelong bridges among Waterway Park’s highlights. Bridges help students practise shape language because rails, supports, stair lines and structural outlines can show angles, repeated features and apparent symmetry. The correct learning target is identifying properties of what is visibly drawn, not declaring the engineering measurements of a bridge from a photograph.
What to do, step by step
Choose one lawful and uncrowded public viewpoint. Make a quick line drawing of the bridge’s visible edges, then mark any clear right, acute or obtuse angles in your drawing. Decide whether the line drawing seems symmetrical about a chosen axis, and check both sides rather than merely assuming it. If you observe parallel-looking elements, label them ‘appear parallel in this view’ unless you have evidence they are mathematically parallel.
Original worked example
Imagine a student’s schematic of a bridge with two slanted rails meeting at a point. The student measures 55° on a paper illustration and draws an adjacent 125° angle on a straight line. These two add to 180° in the illustration. That is a valid geometry fact about the drawn diagram, not a claim that any Punggol bridge has an actual 55° joint. The student must label ‘illustrative sketch’.
An extension question
Compare a top-down or side-on sketch with an oblique photograph. Ask why perspective can make equal lengths look different. Draw a simple isosceles triangle as a bridge-design exercise and label its base angles, then make an original conjecture about how repeating that triangle might affect the visual design. This can reinforce shape reasoning without implying a real engineering test.
The common mistake and the safe boundary
Do not climb railings, lay tape measures across public paths or claim a historic kelong-inspired design necessarily uses one exact polygon. A public bridge is infrastructure, not a measurement laboratory to be modified.
Primary source: Look for angle types and symmetry near Waterway Park bridges. Verify the current access and publication date for your route.
3. Use a safe walking sample to understand average speed
Where: A short public stretch of Punggol Waterway Park Connector.
What the site teaches
The connector provides a recognisable local context for speed, distance and time. Average speed is a relationship among quantities, not a demand for children to walk faster. A simple short observation can help students distinguish moving time, elapsed time and the time spent stopping to rest. This matters for mathematics questions and for real family itineraries.
What to do, step by step
If conditions suit, choose a short familiar section with a reliable exit. Walk a measured or mapped distance at an ordinary comfortable pace, noting how the length was estimated. Record only aggregate timing for your own group. Calculate average speed as distance divided by elapsed time, including any rest stops if that is the time being analysed. Label uncertainties: map-based lengths are estimates and watches do not measure everyone identically.
Original worked example
Illustrative data only: the group travels an estimated 450m in 9 minutes. Converting 9 minutes to 0.15 hours gives 0.45km ÷ 0.15h = 3km/h. If the party then rests for 6 minutes, their average speed across the entire 15-minute period becomes 0.45km ÷ 0.25h = 1.8km/h. The comparison demonstrates that elapsed-time averages depend on whether waiting was included.
An extension question
Ask the child which average is relevant to a parent who wants to know when lunch can begin. For a journey plan, total elapsed time is often more useful than pure movement time. For a controlled observation of walking pace, remove unnecessary stops and explain that choice. Neither average is ‘wrong’ when its denominator is clearly defined.
The common mistake and the safe boundary
Do not conduct timed races on shared paths or pressure people with differing mobility needs. Weather, crossings and crowding affect all real routes. Measurements should remain small, safe and voluntary.
Primary source: Use a safe walking sample to understand average speed. Verify the current access and publication date for your route.
4. Create an LRT-station counting and interval problem
Where: Punggol MRT/LRT interchange and public East or West Loop route information.
What the site teaches
A station map is a structured diagram suitable for counting, order and interval questions. Punggol has an East Loop and West Loop connected to the town-centre interchange. Identifying the correct loop and direction is both practical route literacy and a reminder that a schematic is not a precise scale drawing of track length.
What to do, step by step
Read the current station map before travelling. Choose a sequence of named stops on one loop and count the number of moves between them. Clarify whether you are counting stations visited, gaps between adjacent stations, or transfers. For example, four consecutive stations contain three intervals between the first and last, provided the route travels between each adjacent pair once. Mark the starting point and route direction.
Original worked example
Illustrative scenario: a child writes five station names in order and places a small symbol between each adjacent pair. They count four intervals, not five. If each interval is assigned a fictitious equal 3-minute travel time for a pure arithmetic exercise, the model would give 12 minutes. The actual LRT schedule is not four uniform three-minute segments and must be obtained from current operator information.
An extension question
Make a second diagram showing the town-centre MRT as a transfer node. Ask how a trip changes if a passenger switches from the LRT to the North East Line. Count the transport legs rather than assuming a connecting station provides a direct train to every other station. Have the student explain in words why a diagram’s equal spacing does not guarantee equal geographic distances.
The common mistake and the safe boundary
Never publish classroom-assumed station times as live LRT journey data. Directions and service patterns can change with works. Children must stay behind platform markings and never block passenger flow to draw diagrams.
Primary source: Create an LRT-station counting and interval problem. Verify the current access and publication date for your route.
5. Solve a fictional hawker-meal budget at One Punggol
Where: One Punggol Hawker Centre on Level 2 of One Punggol.
What the site teaches
The People’s Association identifies a real Level 2 hawker centre inside One Punggol. Menus offer an everyday introduction to currency, addition, decimal subtraction and opportunity cost, but stall offerings and prices vary. A responsible educational guide uses clearly fictional amounts unless the exact current prices were personally read and dated. That prevents a maths example from becoming a false business listing.
What to do, step by step
Visit the publicly accessible food centre during its current operating period. Let the family set a private maximum spending amount, then use actual displayed menus to choose a reasonable meal. If you are teaching at home, invent a labelled example instead. Separate essential meal cost from optional snacks. Children can add costs, work out a safe remaining balance and check whether they accidentally counted the same item twice.
Original worked example
Illustrative menu, not current Punggol pricing: a meal costs S$4.80, a drink S$1.60 and fruit S$2.40. The combined cost is S$8.80. From a fictitious S$10.00 budget the remainder is S$1.20. If the family instead omits the fruit, the cost is S$6.40 and the remainder S$3.60. The choice should be about appetite and needs, not pressure to go without adequate food.
An extension question
Introduce a two-person constraint: both want meals, one would like a drink, and their total illustrative budget is S$15. Ask the child to propose two valid combinations and explain which is practical. Label all numbers fictitious and avoid giving advice about a particular family’s nutrition based on mathematics alone.
The common mistake and the safe boundary
Do not assert fixed hawker prices, use other diners’ purchases as examples or reserve public tables for a classroom exercise. Food-centre etiquette, dietary needs and appropriate portions matter more than mathematical neatness.
Primary source: Solve a fictional hawker-meal budget at One Punggol. Verify the current access and publication date for your route.
6. Compare unit prices at an operating Punggol shop
Where: A currently open supermarket or provision shop in Punggol, chosen from a verified mall directory.
What the site teaches
Unit price comparison helps a learner understand why a larger pack may have a lower price per gram while still costing more overall. It is a general arithmetic skill with real value for households. The exercise should not claim that a named mall stocks two exact products at two fixed prices in October 2026 unless those shelf labels were checked. Prices and promotions can change daily.
What to do, step by step
Choose two comparable non-perishable products of the same type and quality, reading their current shelf labels. Record mass or volume, total package cost and any loyalty restrictions. Convert both to the same unit, such as price per 100g. Compare the mathematical result with the household’s actual need. A lower unit cost is not an automatic reason to buy a pack too large to use safely before expiry.
Original worked example
Fictional calculation: Pack A contains 600g and costs S$5.40, or S$0.90 per 100g. Pack B contains 800g and costs S$6.40, or S$0.80 per 100g. Pack B is cheaper per 100g by S$0.10, yet the shopper pays S$1.00 more upfront. Whether B is the better purchase depends on budget, storage, product quality and whether the contents will actually be used.
An extension question
Ask whether a temporary multibuy deal changes the answer. Suppose Pack A is advertised as two for S$10.00, with all other example numbers still fictional. That is S$5.00 per 600g, about S$0.83 per 100g, still not necessarily the lowest compared with Pack B. Use exact fractions or reasonable rounding and explain what was rounded.
The common mistake and the safe boundary
Do not compare 100ml with 100g as if liquids all have identical density. Confirm that packages are comparable and that discounts apply to the user. Do not obstruct checkout lines or photograph customers while recording prices.
Primary source: Compare unit prices at an operating Punggol shop. Verify the current access and publication date for your route.
7. Use Punggol Regional Library to build a tiny data chart
Where: Punggol Regional Library, Levels 1–5 of One Punggol.
What the site teaches
The regional library is a legitimate public learning place, with collections that can support investigation. A small chart-making activity can turn numbers into a clear answer. For example, a learner might count titles by genre in their own reading list or track the number of pages read over several days. There is no need to count strangers, photograph borrowers or assume an unofficial survey of library users is allowed.
What to do, step by step
Borrow or select a few age-appropriate books following NLB’s normal conditions. Create a dataset from your own choices: title category, number of pages read on each day, or chapters completed. Choose a bar chart for counts or a line graph for a time sequence. Label axes and units, and distinguish the number of books from the number of people who read them. If using invented practice data, label it explicitly.
Original worked example
An illustrative week records reading minutes as Monday 12, Tuesday 15, Wednesday 10, Thursday 18 and Friday 20. The five-day total is 75 minutes, and the arithmetic mean is 15 minutes per day. The median after sorting 10, 12, 15, 18, 20 is also 15. Ask what the data does not show: reading quality, comprehension or a child’s exact effort cannot be inferred from minutes alone.
An extension question
Change Friday’s reading time from 20 to 50 minutes in a hypothetical chart. Discuss how the mean changes to 21 minutes while the median stays 15. Students discover why a single unusual value affects some summaries more than others. Connect this to fair interpretation of tables and graph scales, not to competition among classmates.
The common mistake and the safe boundary
A library’s public seating is not permission to survey unconsenting visitors or collect children’s personal data. Programmes and specialist spaces have separate access rules. Avoid calling a self-selected five-day log a population-wide measure of Punggol reading habits.
Primary source: Use Punggol Regional Library to build a tiny data chart. Verify the current access and publication date for your route.
8. Turn HDB’s Punggol Eco-Town features into a measured diagram
Where: HDB Explorer Trail learning materials and safe public views of Treelodge@Punggol.
What the site teaches
HDB’s Explorer Trail describes Treelodge@Punggol as its first eco-precinct, including an Eco-Deck, a Green Spine and a rainwater harvesting system. A mathematics trail can examine proportions and spatial arrangement while remaining honest about the limits of visual observation. A drawing of a planting deck is not evidence of actual volumes of water harvested, electricity saved or heat reduced.
What to do, step by step
Read HDB’s current Explorer Trail explanation. Draw an entirely schematic rectangle to represent a podium deck and divide it into zones for planting, circulation and seating. Assign labelled example dimensions, not claims about the real estate. Calculate area and fractional allocation for the invented model. If visiting a public area, record the features actually visible and follow posted signs; avoid entering private residential facilities.
Original worked example
Illustrative plan only: a rectangular model measures 20m by 12m, with a drawn 80-square-metre planting zone. Total model area is 240 square metres; planting makes up 80/240 = 1/3 or about 33.3%. This is a proportion inside the student’s invented schematic. It does not claim that one-third of Treelodge’s real area is planted.
An extension question
Redraw the same 240-square-metre model with 120 square metres of planting. Ask what changes in the fraction and what other needs the design must consider, such as passage width, rainwater drainage and accessible circulation. The lesson demonstrates a design trade-off without making unsupported engineering claims.
The common mistake and the safe boundary
Do not take measurements inside restricted HDB spaces or describe a concept sketch as an official design plan. HDB’s documented rainwater system has a stated purpose but not a performance figure inferred from a photograph.
Primary source: Turn HDB’s Punggol Eco-Town features into a measured diagram. Verify the current access and publication date for your route.
9. Model flow and volume after reading about Lorong Halus Wetland
Where: PUB’s Lorong Halus Wetland information and public learning trail, where open and safe.
What the site teaches
PUB describes the wetland as an engineered treatment system for water passing through the former landfill before reaching Serangoon Reservoir. The site offers rich opportunities for units, flow diagrams and relationships, but it should not be turned into unsupervised sampling or an imaginary claim about real treatment capacity. The key mathematical principle is understanding that a flow rate requires both a volume and a time.
What to do, step by step
Read the PUB overview and draw three boxes: source area, treatment wetland and receiving reservoir. Create a fictional numerical model on paper. Specify that the values are invented for arithmetic practice and not measured at Lorong Halus. Calculate total processed volume at a chosen hypothetical constant rate. Discuss why actual engineering systems have changing inflows, weather conditions and treatment limits.
Original worked example
Fictional worksheet: suppose a model pump moves 250 litres per minute for 12 minutes. Volume = 250 × 12 = 3,000 litres or 3 cubic metres. This is not a measurement of the wetland’s actual operation. If it moves 250 litres per minute for only 8 minutes, the model volume is 2,000 litres. The student checks that litres per minute multiplied by minutes produces litres.
An extension question
Ask whether a single average rate can prove water quality. It cannot: flow volume does not by itself tell us pollutant concentration, treatment efficiency or downstream safety. This leads to a data-quality question about the measurements an engineer would actually need. Keep the mathematics exact while stating clearly where the physical inference ends.
The common mistake and the safe boundary
Do not enter reed beds, treatment infrastructure or water. PUB’s student field-study activities have their own organiser and safety conditions. An ordinary family walk is not permission for water sampling.
Primary source: Model flow and volume after reading about Lorong Halus Wetland. Verify the current access and publication date for your route.
10. Explore scale, shadows and geometry in Punggol Digital District
Where: Public areas near Punggol Coast MRT and Punggol Digital District.
What the site teaches
JTC documents planned environmental design features such as passive shading and solar-related systems in Punggol Digital District. Publicly visible building facades and walkways can inspire scale drawing and angle questions. Their visible geometry is suitable for an educational model, but the actual performance of energy systems cannot be inferred simply from a shadow or an artist’s rendering.
What to do, step by step
Visit only officially open public spaces, or study JTC’s documentation from home. Choose one building outline or a shaded path as inspiration for a drawn model. Set an explicit paper scale, for example one centimetre equals two metres in the invented layout. Draw a 7cm covered walkway and interpret it as 14m in the model. Label both the scale and the fact that the dimensions are fictional, not a measured path.
Original worked example
Illustrative exercise: a rectangle on the drawing is 7cm long and 3cm wide, at a scale of 1cm to 2m. The represented model dimensions are 14m by 6m, giving 84 square metres. A learner who multiplies 7 × 3 × 2 and gets 42 has scaled lengths but forgotten that area scales by the square of the linear scale. This is a useful diagnosis for older students.
An extension question
Design a cardboard awning and observe its shadow under a safely operated small light. Change only the awning depth while holding the light position as fixed as possible. The result may demonstrate geometry under that model condition, not actual savings at Punggol Digital District. Compare photographic perspective and a scaled plan to explain why different representations answer different questions.
The common mistake and the safe boundary
Do not enter campus offices, technical rooms or construction works, and never climb for measurements. District facilities open in phases, so check current JTC public access rather than relying on a future masterplan.
Primary source: Explore scale, shadows and geometry in Punggol Digital District. Verify the current access and publication date for your route.
A parent-friendly diagnostic: where did the working go wrong?
A good teacher checks the first incorrect step, not merely the final answer. Suppose a child calculates the cost of two fictional meals at S$4.80 each, then adds a S$1.60 drink and produces S$10.20. The arithmetic may be correct if the expression was 4.80 × 2 + 1.60. But if the family ordered one meal, the error happened before the calculation: the quantities were misread. The repair is to annotate the question and identify the number of each item.
For a route, an error often begins with units. A student may compute 1,200 metres divided by 3 and call the answer 400 hours. The learner has mixed metres with kilometres per hour. Convert 1,200 metres to 1.2 kilometres first, then divide by 3km/h. The answer is 0.4 hours, or 24 minutes. Ask the child why multiplying by 60 converts hours to minutes and why the resulting time seems sensible.
For a scale drawing, another common error is treating area as though it scales linearly. If a shape’s actual lengths are twice the drawn lengths, the area scales fourfold. The learner must show what the scale relates, whether length or area, and preserve square units. A worked example with an invented 7cm by 3cm rectangle at a 1:200 scale makes this visible: lengths become 14m and 6m, so area is 84m², not 42m².
A chart can fail before arithmetic too. If one student’s five reading sessions are used to represent ‘all Punggol children’, the data does not support that population claim. Even perfect chart labels cannot repair a sample that was never designed for such a conclusion. Help the learner say ‘my own five sessions’ instead. Accurate evidence language is as important as number accuracy.
Three practical mathematics trail itineraries
A 45-minute waterway shapes-and-distance route
Choose a short safe public entrance near Punggol Waterway Park. Look at NParks’ official nature-walk description before leaving. At one viewpoint, draw a bridge outline and classify visible angles in the drawing. On a separate short segment, estimate distance using a verified map and calculate a clearly labelled hypothetical travel time. Do not attempt the whole 4.2km nature walk solely for a worksheet. End with a check of the first unit conversion the learner used.
A 90-minute town-centre budgeting and charts afternoon
Use One Punggol Hawker Centre for a family meal and read actual displayed prices if dining. Do not publish stall-specific pricing without a dated check. After a suitable meal, visit Punggol Regional Library and choose a small reading-log dataset based on the learner’s own choices. Work out a total, a simple mean and one clear bar graph at home or in an appropriate permitted space. This combines money arithmetic with responsible data presentation.
An older student’s environmental modelling project
Research HDB’s Explorer Trail, PUB’s Lorong Halus Wetland explanation and JTC’s Punggol Digital District sustainability information from home. Choose one site for a future safe visit, then build a paper model with expressly fictional dimensions. Test whether the calculations use correct units and ask what would require official engineering data. The student can complete the report without sampling reservoir water or entering a restricted building.
A ten-question self-check for students
- Which two NParks route lengths are actually being compared, and are they descriptions of the same route?
- If an outward walk is 650m and the return uses the same path, what is the total distance in kilometres?
- What is the difference between number of LRT stations and intervals between them?
- How can perspective change an apparent angle in a photograph?
- What does average speed include if the timer runs during a rest?
- Why must two food packages use the same weight or volume unit before comparing value?
- Why is a lower per-100g price not always the cheaper total purchase?
- What are the mean and median of your own five daily reading times?
- Why is a paper model of a wetland flow rate not evidence of PUB’s actual operating flow?
- When a drawing has scale 1cm to 2m, why does area use the square of the length factor?
Frequently asked questions
Is the Punggol Waterway Park nature walk 4.2km or 8.4km?
NParks describes a 4.2km easy nature walk and separately an 8.4km Punggol Waterway Park Connector. Use the exact named route when quoting a length.
Do children need to walk the full route?
No. A short safe segment, clearly mapped and timed, is sufficient for a field activity.
Can I measure real bridge angles from a phone photograph?
A photo shows a perspective projection; without calibration it is not an authoritative measure of the actual structural angles. Sketches can still teach angle vocabulary.
What are the four named Punggol Waterway Park bridges?
NParks identifies Jewel Bridge, Wave Bridge, Sunrise Bridge and Kelong Bridge among park highlights.
What is a good Primary 3 maths activity in Punggol?
Count route intervals, estimate short distances, make a reading-time bar chart or practise decimal prices with explicitly hypothetical examples.
How do I calculate walking speed?
Average speed is distance divided by elapsed time. Use consistent units and explain whether rests are included.
Can I calculate a fixed walking time from a park’s published distance?
Only under a clearly stated assumed speed. Real conditions and user needs affect the actual duration.
Is there a family budgeting exercise at One Punggol?
Yes. Use the real hawker centre for ordinary meal choices, or invented menu numbers for teaching. Prices and stalls change.
Why compare unit prices?
Price per common unit helps compare package value, while total spending, quality, expiry and household needs also matter.
Can I survey library visitors for a statistics project?
Do not collect people’s personal information or conduct unauthorised surveys. Your own reading log provides a safe dataset.
How can I practise fractions at Treelodge@Punggol?
Create a clearly fictional diagram with zones of stated model area and calculate proportions. Do not imply the model dimensions match the real site.
Can I measure Lorong Halus wetland flow myself?
A casual visitor should not enter ponds, collect samples or access treatment infrastructure without the required permission and safety arrangements.
What units work for water-flow calculations?
An illustrative rate in litres per minute multiplied by minutes gives litres. One cubic metre equals 1,000 litres.
What is a scale drawing?
It relates lengths in a diagram to corresponding represented lengths through a specified ratio. Area changes by the square of the length factor.
Are the prices and dimensions in this article real Punggol measurements?
No. Worked prices, model dimensions, flow values and exercise times are explicitly illustrative unless identified as official published facts.
How long should a family maths outing be?
Choose a duration that suits the learners and the weather. One focused task can be enough.
Where do I check Punggol park access?
Use current NParks park and connector pages plus on-site notices, not an old worksheet.
Can this count as a school assignment?
Follow the teacher’s original-work, observation, citation and safety rules. Clearly label model data and distinguish it from actual measurements.
Official references and related Punggol study guides
- Compare the 4.2km Waterway nature walk with the 8.4km park connector
- Look for angle types and symmetry near Waterway Park bridges
- Use a safe walking sample to understand average speed
- Create an LRT-station counting and interval problem
- Solve a fictional hawker-meal budget at One Punggol
- Compare unit prices at an operating Punggol shop
- Use Punggol Regional Library to build a tiny data chart
- Turn HDB’s Punggol Eco-Town features into a measured diagram
- Model flow and volume after reading about Lorong Halus Wetland
- Explore scale, shadows and geometry in Punggol Digital District
- NParks named 8.4km waterway connector
- LTA journey planner for live transport context
- MoneySense teaching children about money
- Punggol student activity guide
- Punggol urban planning and built-environment guide
- Punggol makers and prototype projects
The best answer includes a sensible reason
Choose one Punggol location, identify the real quantity, create or collect data appropriately, solve the question with units and explain the limits of the answer. A careful arithmetic example at a safe public viewpoint can be more useful than an exhausting ten-stop tour. Mathematics becomes durable when students know not only how to calculate but also what their calculation actually describes.


