
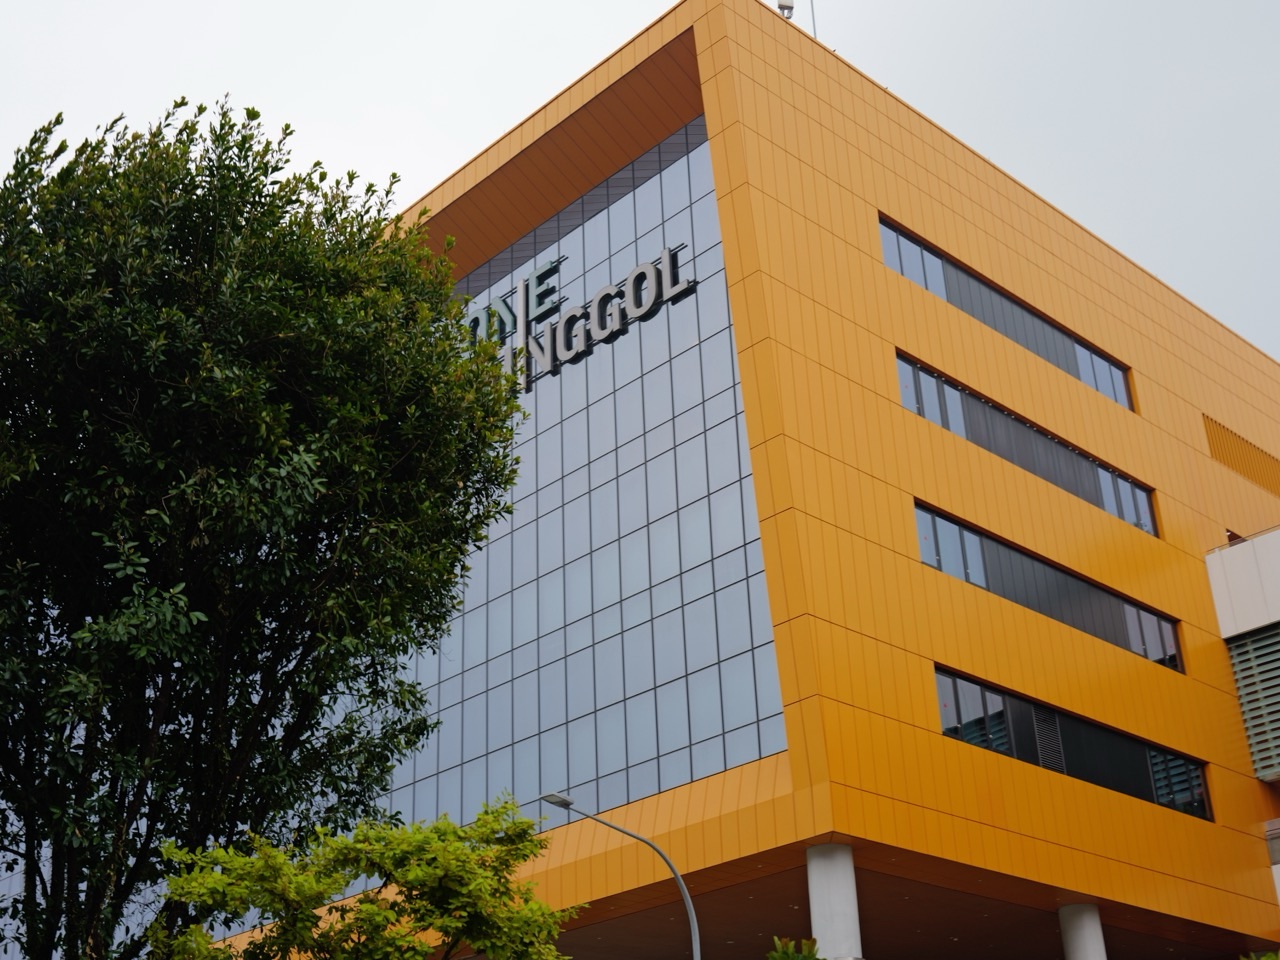
The top 10 things to do in Punggol for Economics students are to compare opportunity costs in a family afternoon, observe food choices at One Punggol Hawker Centre, calculate unit-price trade-offs at neighbourhood shops, contrast Oasis Terraces with Northshore Plaza, analyse rail fares and travel time, classify shared public services, model environmental externalities at Waterway Park and Lorong Halus, study the projected economy of Punggol Digital District, interpret national CPI properly, and write an evidence-based market-policy argument. These are ten economic inquiries—not a claim that any one shop or district has a guaranteed price, profit or job count.
Best first activity: compare two genuinely feasible family outings using time, money and the next-best choice forgone. For demand and supply, use a real hawker centre as context but fictional price–quantity schedules unless properly collected data are available. For national economics, use official SingStat and SEAB information; do not present a single Punggol menu as an inflation index.
This October 2026 guide separates Economics from the existing money-smart family guide. Budgeting asks whether an outing fits a household’s means. Economics asks how scarcity, prices, incentives, costs, competition, market failure and policy shape choices across consumers, firms and society. Worked numbers are explicitly fictional. In the 2027 G3 SEC syllabus listing, Economics is K343 and applies only to candidates from schools approved to offer it; the concepts remain useful beyond that formal subject.
Choose your Economics topic quickly
- Basic economic problem: scarcity, choice, opportunity cost and a hypothetical production possibility frontier.
- Microeconomics: consumer choices, demand, supply, unit pricing, market structure and firms’ incentives.
- Transport economics: generalised journey cost rather than fare alone.
- Market failure: public and shared services, externalities, environmental management and possible responses.
- Development and macroeconomics: official CPI methodology, human capital, projected jobs and agglomeration in Punggol Digital District.
- Evaluation: compare stakeholder perspectives and explain which evidence could change a conclusion.
Ask what changes, for whom and under which conditions
A sound answer begins with a clearly defined market or choice. A menu price alone cannot prove demand, a building’s projected capacity cannot prove actual jobs filled and a pleasant park visit cannot estimate the full social benefit of environmental investment. Each concept has a different type of relevant evidence. Use observed prices only with dates, official figures only with their original qualifiers, and hypothetical calculations only when labelled.
The next step is the mechanism. If a firm faces higher production costs, a basic model suggests a possible supply-side change. If consumers become more interested in a product, demand may change. These are different shifts and cannot be inferred reliably from a single queue. Explaining what other factors are assumed constant is part of the skill.
Finally evaluate who gains and who bears cost. A quicker route may benefit commuters who value time but may not suit someone needing accessible paths. A larger grocery packet may be cheaper per gram yet wasteful for a small household. A new public amenity may increase convenience while also requiring land and operating resources. Economics helps structure those trade-offs without declaring one outcome best for everybody.
Ten Punggol Economics learning activities
1. Choose between competing uses of a school-holiday afternoon
Where: A family planning an outing between Punggol Waterway Park, One Punggol and paid recreation.
Economic concept and real Punggol context
Economics begins with scarcity: time, attention, money and suitable transport cannot be used for every attractive activity simultaneously. An adult may want rest, a child may want play, and a teenager may want to read. The economic question is not which activity is universally best but what each choice requires the family to forgo. MoneySense describes distinguishing needs and wants, while the opportunity-cost concept concerns the next-best alternative lost when a choice is made.
How to investigate
Create a decision table with three genuine possible activities, a travel-time estimate drawn from appropriate current sources, their known admission conditions and a benefit each person values. Keep any invented cost or time clearly labelled. Ask the household to select the option that meets its needs and explain the next-best rejected choice. Be explicit that a zero-admission public park still requires time and may incur transport cost, and unsafe weather can rule it out altogether.
Worked classroom example
Fictional family choice: a short park visit yields an imagined satisfaction score of 7, a cinema visit 8 and a library visit 6 under the family’s chosen scale. If the cinema is selected and the park was the next-best feasible option, the opportunity cost is the park’s foregone benefit, not 7+6=13. These subjective scores are classroom teaching devices, not measured utility and certainly not monetary values.
Evaluation and further reasoning
Now impose a constraint: the paid cinema is sold out or the weather makes the park unsuitable. The ranking of feasible options changes, which shows why opportunity cost depends on the actual alternatives. A graph can represent a hypothetical frontier of reading time versus recreation time without claiming a real family’s satisfaction can be measured in universal units.
Limits of the evidence
Don’t frame meals, necessary transport or accessibility accommodations as mere optional luxuries. A family’s financial and health needs differ; economic models simplify decisions but do not replace judgement.
Primary reference: Choose between competing uses of a school-holiday afternoon. Verify current dates, prices and official definitions.
2. Compare real menus at One Punggol without inventing market prices
Where: One Punggol Hawker Centre, Level 2, 1 Punggol Drive.
Economic concept and real Punggol context
PA documents a hawker centre at One Punggol. It offers a practical example of consumers making decisions among meals, portions and vendors. Students can ask how price, product differences, queue length, location and dietary considerations affect choices, but a one-time visit does not reveal a stall’s complete demand curve or its operating profit. A menu displays an offer, not the exact quantity customers would purchase at every possible price.
How to investigate
Visit only during the centre’s published operating conditions. Compare the actual displayed menu prices for two reasonably similar meal categories and record your observation date. Explain non-price factors without surveying strangers or copying a vendor’s private business data. For a formal supply-demand diagram, use fictional prices and quantities. Draw demand downward and supply upward under basic assumptions, then label the equilibrium in the hypothetical model rather than assigning it to a Punggol stall.
Worked classroom example
Illustrative demand schedule: at S$4, consumers in a classroom model want 100 meals; at S$5, 80; at S$6, 60. These invented numbers depict a negative relationship holding other factors constant. A real hawker’s actual sales may respond to quality, ingredients, time of day and nearby choices. A student who sees one queue at S$5 cannot calculate price elasticity without additional observed changes and a sound method.
Evaluation and further reasoning
Ask how an increase in ingredient cost differs from an increase in consumers’ preference for a dish. The first may shift a firm’s supply; the second may shift demand. Draw both separately and describe the expected direction under textbook assumptions. Note that the actual equilibrium response requires real data and competing effects.
Limits of the evidence
Do not treat a current display as a permanent menu price or claim a stall’s revenue equals profit. Respect shoppers, dietary needs and shared seating; do not publish identifiable transaction information.
Primary reference: Compare real menus at One Punggol without inventing market prices. Verify current dates, prices and official definitions.
3. Investigate why unit price is not the same as household welfare
Where: An operating supermarket in Oasis Terraces or Northshore Plaza, using current store information.
Economic concept and real Punggol context
HDB identifies neighbourhood centres such as Oasis Terraces and Northshore Plaza as mixed retail and community facilities. A shop’s package sizes allow students to calculate unit prices, but Economics goes further than household arithmetic. A lower unit price may involve an upfront spending constraint, storage needs, quality differences or waste. Firms choose package sizes and promotions in response to costs and demand, while consumers face information and budget constraints.
How to investigate
Use two comparable food packages from a real publicly operating store, taking notes only where permitted. Record current shelf price, quantity and promotion conditions. Calculate cost per common unit, then ask whether the larger package is suitable for a household that cannot use it before expiry. For the economic analysis, identify price discrimination or product differentiation only if its definition and evidence genuinely fit; a bigger packet with a lower unit price alone is not proof of unlawful or unfair conduct.
Worked classroom example
Fictional examples: 500g costs S$5.00 (S$1.00 per 100g); 900g costs S$8.10 (S$0.90 per 100g). The larger packet has a lower unit cost but requires S$3.10 extra immediately. If the household needs only 500g and discards the remainder, the nominal per-unit advantage may not translate into real welfare. None of the figures claims today’s Oasis or Northshore pricing.
Evaluation and further reasoning
Introduce consumer surplus carefully. A consumer might value a product above its market price, but a classroom willingness-to-pay figure is hypothetical. Ask what extra information—household preference, quantities actually consumed and alternatives—would be necessary before calculating a meaningful estimate.
Limits of the evidence
Avoid turning a student’s exercise into a commercial ranking or asserting product availability on a future date. Food safety and nutrition still matter. A public shopper need not disclose their finances to a student.
Primary reference: Investigate why unit price is not the same as household welfare. Verify current dates, prices and official definitions.
4. Contrast Oasis Terraces with Northshore Plaza as location decisions
Where: HDB’s Oasis Terraces by Oasis LRT and Northshore Plaza by Samudera LRT.
Economic concept and real Punggol context
HDB describes Oasis Terraces as its first new-generation neighbourhood centre, with community spaces and an integrated polyclinic and childcare centre. Northshore Plaza is described as a seafront neighbourhood centre linked to residential blocks, Samudera LRT and Punggol Promenade through a community spine. The comparison introduces location economics, convenience, agglomeration and different customer purposes—not a claim that one centre has higher profits.
How to investigate
Read HDB’s official descriptions before selecting a short visit. Draw a map showing transport, housing, public amenities and retail for each centre at a similar scale. Note which combinations might lower the time cost of errands. Compare what HDB says about design with what is currently open. Avoid collecting private business accounts or counting customers without appropriate permission and a properly designed study.
Worked classroom example
A hypothetical shopper needs groceries and a healthcare appointment. Under an illustrative time model, separate destinations require 25+20 minutes travel whereas a co-located route might require 30 minutes total. The difference is 15 minutes in this fictional model, not a verified saving at Oasis Terraces. Whether it benefits a particular resident depends on appointment availability, transport, mobility and the destinations actually used.
Evaluation and further reasoning
Discuss possible benefits and costs of agglomeration: more footfall, shared amenities and convenience alongside crowding, rents and competition. Why might a retailer prefer a high-traffic centre despite greater cost? An answer needs evidence about consumers and operating conditions, not merely a promotional description of a building.
Limits of the evidence
Tenant mix changes and private medical or childcare rooms are not research sites. Do not claim observed crowd size measures demand across all seasons or days.
Primary reference: Contrast Oasis Terraces with Northshore Plaza as location decisions. Verify current dates, prices and official definitions.
5. Use public transport fares to distinguish money price and generalised cost
Where: Punggol MRT/LRT and Punggol Coast MRT, using LTA’s official fare calculator.
Economic concept and real Punggol context
LTA’s fare calculator gives card fares for specified journeys and fare categories. Economists also consider a generalised journey cost including time, walking effort, transfers and uncertainty. A nominally cheaper fare does not automatically mean a more attractive route to every user. A student should identify each component before combining unlike quantities and must avoid valuing another person’s time or mobility without consent.
How to investigate
Choose a realistic Punggol journey and use the current LTA tool to obtain its actual listed card fare, with the correct passenger category. Then create a fictional comparison of alternatives with labelled assumptions about waiting and walking. Treat time and money as different units unless explicitly adopting a hypothetical value-of-time parameter. Compare options for a person prioritising cost and another prioritising a step-free route. Use current operator service updates for real decisions.
Worked classroom example
Illustrative comparison: Route A costs S$1.80 and 35 minutes; B costs S$2.00 and 25 minutes. With an assumed value of time of S$0.10 per minute, the hypothetical generalised costs are S$5.30 and S$4.50 respectively. This is not a statement of today’s Punggol fares or what any person should value their time at. Changing that assumed value can reverse which route appears preferred.
Evaluation and further reasoning
Add accessibility as a non-negotiable constraint instead of assigning it a tiny score that can be outweighed by a small fare saving. Discuss how a model that optimises money alone can overlook the real user’s needs. This is a lesson in human-centred economics and modelling assumptions.
Limits of the evidence
Current fare categories and real service availability change. Punggol Point LRT and Punggol Coast MRT are different places. Never describe a classroom route as guaranteed accessible or operating.
Primary reference: Use public transport fares to distinguish money price and generalised cost. Verify current dates, prices and official definitions.
6. Distinguish private goods, shared services and public benefits at One Punggol
Where: Public areas of One Punggol library, community club and hawker centre.
Economic concept and real Punggol context
PA describes One Punggol as an integrated hub combining government services, a regional library, hawker centre and community spaces. Students can classify different economic features by rivalry and excludability, but not every publicly funded service is automatically a pure public good. A meal sold by a hawker is usually rival and excludable, while a public library offers collectively supported access subject to rules. Broader public benefits can arise through education and inclusion.
How to investigate
Make a two-by-two textbook table for rivalry and excludability, and place a few hypothetical examples in it. Explain why a free library seat can still be rival when someone occupies it, and why a public path may become congested even if access is generally open. Observe only public areas or use PA’s official documentation. Distinguish user charges, taxpayer-funded services and private sales without assuming the centre’s exact financing arrangements beyond what the agency publishes.
Worked classroom example
Illustrative thought exercise: only ten chairs are available and twelve readers want to use them simultaneously. Even if no entry ticket is charged, a seat is scarce and rival in that moment. That does not automatically make the library a privately sold good. The example reveals why words like ‘public’, ‘free’ and ‘non-rival’ must not be treated as synonyms.
Evaluation and further reasoning
Ask why education or community access might generate positive external benefits not fully reflected in a private purchase decision. Discuss whether the claim is a possible rationale rather than a measured benefit of this exact facility. A strong answer separates textbook categories from actual governance evidence.
Limits of the evidence
Do not enter care rooms or use visitor privacy as material for a survey. A public building is not permission to occupy spaces for an economics classroom without venue approval.
Primary reference: Distinguish private goods, shared services and public benefits at One Punggol. Verify current dates, prices and official definitions.
7. Examine environmental externalities around Waterway Park and Lorong Halus
Where: Punggol Waterway Park public paths and PUB’s Lorong Halus Wetland published materials.
Economic concept and real Punggol context
A negative externality occurs when an activity imposes costs on others that are not fully reflected in the private decision; a positive externality creates benefits beyond the immediate decision-maker. Water pollution and litter are accessible teaching examples, while an engineered treatment wetland or maintained public green space illustrates collective investment. The actual social costs of a particular site cannot be calculated from one photograph or visitor’s personal opinion.
How to investigate
Use PUB’s description of Lorong Halus as treating water affected by the former landfill. Draw a hypothetical diagram showing private costs, external costs and social costs for a fictional polluting activity; label every curve as conceptual. Separately make a park-use diagram listing possible benefits to recreation, wellbeing and environmental management without assigning invented dollar values. Identify which agency is responsible for the documented system and what performance evidence remains missing.
Worked classroom example
Fictional marginal-cost schedule at an arbitrary output: private marginal cost S$6 per unit and external marginal cost S$3. Social marginal cost in the simplified additive model is S$9. This is a textbook calculation, not an estimate for Punggol, the landfill or PUB. The example explains why a decision-maker considering only S$6 could understate social cost.
Evaluation and further reasoning
Discuss possible policy responses such as standards, pricing, public investment and education. Each has trade-offs, administrative needs and behavioural effects. Avoid assuming one policy always works best. Strong answers identify who bears costs, who benefits and how one would evaluate outcomes.
Limits of the evidence
Do not enter wetland treatment infrastructure, sample water or accuse named firms or residents of polluting without reliable evidence. This is an economics model, not an environmental enforcement investigation.
Primary reference: Examine environmental externalities around Waterway Park and Lorong Halus. Verify current dates, prices and official definitions.
8. Explore Punggol Digital District without converting capacity into actual jobs
Where: Public portions of Punggol Digital District and JTC’s official project information.
Economic concept and real Punggol context
JTC describes a 50-hectare business district integrating SIT and businesses, with figures of up to or planned capacity for 28,000 jobs and 12,000 students. These are useful economic-development context, but they must not be silently reported as verified current employment and enrolment. The interesting economic concepts are human capital, specialisation, agglomeration, knowledge spillovers and the relationship between education and production.
How to investigate
Read JTC’s official business and district pages, recording the date and wording attached to headline figures. Label projected jobs and student capacity separately from any actual live occupancy figures found in an authoritative source. If visiting, use public mall or hawker areas only. On paper draw a flow of potential interactions among students, research teams, firms, services and residents, marking any relationships not expressly documented as hypotheses.
Worked classroom example
A student reads 28,000 jobs and concludes exactly 28,000 residents were hired in 2026. The evidence does not establish that. A corrected sentence says JTC presents the district with a 28,000-job figure in its development overview; actual jobs occupied and their distribution require additional labour-market evidence. The correction prevents a planned capacity from becoming a false employment statistic.
Evaluation and further reasoning
Explain why workers and firms might benefit from proximity and knowledge exchange, and why housing, commuting, land costs and congestion could create trade-offs. Discuss the difference between total economic activity and the quality of life residents experience. Do not claim agglomeration benefits without specifying mechanisms and evidence.
Limits of the evidence
Do not enter private workplaces or campus labs as tourists. Business listings and promotional capacity figures are not employment records, and projections can be revised.
Primary reference: Explore Punggol Digital District without converting capacity into actual jobs. Verify current dates, prices and official definitions.
9. Study inflation with official national CPI instead of an invented Punggol inflation rate
Where: At home or the public library, using Singapore Department of Statistics information.
Economic concept and real Punggol context
Inflation concerns sustained changes in a price index across a defined basket and population; it cannot be measured from the price of one bowl of noodles between two visits. A Punggol learner can identify food, transport and services in everyday spending, then use the Department of Statistics’ official CPI information for national measurement. The key distinction is between a change in one price and a change in a representative price index.
How to investigate
Read SingStat’s explanation of the Consumer Price Index and note the reference period, basket and weighting method. At home use a fictional basket with fixed quantities to calculate the cost in two years. Compute percentage change from the first cost to the second and label it a toy price index, not official CPI. Then ask why the national measure needs many goods, services and household weighting information rather than a few nearby shop prices.
Worked classroom example
Fictional basket: two meal units costing S$5 each and one transport unit costing S$2 give a base cost of S$12. If later meal units cost S$5.50 and transport S$2.20, the same basket costs S$13.20, a 10% increase. This is a simple fixed-basket classroom calculation, NOT Singapore’s official inflation rate or a Punggol-specific statistic.
Evaluation and further reasoning
Discuss substitution: households may choose other products when relative prices change. A basic fixed basket may not represent that behaviour, which is one reason index construction requires careful methodology. The lesson is about interpreting an index, not forecasting actual prices or investment returns.
Limits of the evidence
Do not use two anecdotal stall receipts to claim Punggol inflation or assert a particular store caused national CPI changes. Different households experience price shifts differently.
Primary reference: Study inflation with official national CPI instead of an invented Punggol inflation rate. Verify current dates, prices and official definitions.
10. Practise evaluating a market-policy claim using evidence and counterarguments
Where: A safe home study, classroom or Punggol Regional Library research session.
Economic concept and real Punggol context
Economics writing becomes stronger when students separate description from explanation and evaluation. A headline such as ‘More food choices always benefit everyone’ is too absolute: selection may improve for some while competition, costs, congestion or access conditions change for others. Economics requires a clearly defined market, timeframe and stakeholders. Government and business publications provide useful evidence but have different purposes and levels of measurement.
How to investigate
Choose one nonpartisan local case such as an additional hawker option near transit or a planned business district. Write a claim, the mechanism that could support it, evidence from HDB or JTC, and a counterpoint. If a number comes from a project overview, retain ‘projected’ or ‘planned’ wording. Create a four-sentence argument using ‘because’, ‘however’ and ‘therefore’, avoiding claims that all people experience the same effect.
Worked classroom example
Model argument: ‘A new food centre may increase options for residents because more stalls can offer different products. However, benefits depend on pricing, accessibility and whether the desired stalls are open. JTC confirms an operating Punggol Coast Hawker Centre, but that does not establish that every household’s food spending fell. Therefore a measured welfare conclusion needs price, access and consumer evidence.’ This is economic reasoning, not invented sales data.
Evaluation and further reasoning
Rewrite from two perspectives: the customer needing a quick affordable meal and a small vendor paying rent. Explain why each may evaluate the same policy differently. Then identify what would change the conclusion, such as credible longitudinal price data or actual travel survey results.
Limits of the evidence
Do not make defamatory claims about businesses or individuals, or frame plausible hypotheses as verified local outcomes. Respect original sources and privacy when conducting any authorised interviews.
Primary reference: Practise evaluating a market-policy claim using evidence and counterarguments. Verify current dates, prices and official definitions.
How to draw a useful Economics diagram
Before putting a demand and supply curve on paper, label the product, geographic market and time period. Draw the price axis and quantity axis correctly. If the question describes a rise in production cost, consider how supply might shift, holding other factors constant, instead of moving along the existing supply curve without explanation. If preferences change, examine demand. A graph demonstrates model logic, not evidence that the precise model shift occurred in a Punggol stall.
For opportunity cost and a production possibility curve, name two hypothetical outputs and the assumed fixed resources. A point on a model frontier illustrates efficient use under the stipulated technology and resources; a point inside may illustrate underuse. Do not draw a curve based on a family’s preference score and claim to have measured the real local economy. The difference between a useful abstraction and a false statistic is whether its assumptions are obvious.
For inflation, the denominator matters. Percentage change equals the new value minus the old value, divided by the old value, multiplied by one hundred. A national CPI is built from a defined weighted basket, not whichever three prices a student found while buying lunch. State whether a chart concerns the official Singapore series or a tiny fictitious exercise.
Three effective Economics learning sessions
A Punggol town-centre microeconomics visit
Visit One Punggol’s public areas and look at the currently displayed food options at the hawker centre. Record only public information you can use appropriately. At home, draw a fictional demand–supply diagram for a generic meal, then explain why an actual stall’s price, queue and costs do not reveal its complete demand function. This keeps observation and model separate while making the concepts less abstract.
A local services and externalities case study
Read HDB’s neighbourhood-centre information and PA’s One Punggol page. Compare which facilities are private sales and which provide shared or publicly supported services. Then use PUB’s Lorong Halus explanation to discuss why environmental external effects can matter beyond one user. Choose one potential policy response, explain who might benefit and what would require real data for evaluation.
A macroeconomics-and-development research afternoon
Use SingStat for national price-index concepts, SEAB for the current syllabus listing and JTC for the development goals of Punggol Digital District. Distinguish the district’s headline jobs and student figures from actual occupied positions. Write a short evidence-led essay about possible knowledge and employment benefits and the costs or constraints needed for a balanced evaluation. No private business interviewing or worksite access is necessary.
Common Economics mistakes
- Treating opportunity cost as the sum of every rejected alternative instead of the value of the next-best feasible choice.
- Confusing a change in quantity demanded with a shift of the demand curve.
- Equating a posted menu price with equilibrium without quantity and market evidence.
- Claiming lower unit price always means higher consumer welfare.
- Calling every free-to-enter facility a non-rival pure public good.
- Mixing travel time and money without an explicit value-of-time assumption.
- Using fictional social costs as though PUB measured them at Lorong Halus.
- Presenting the district’s planned 28,000-job figure as the actual number employed today.
- Using one local receipt to calculate national or Punggol-wide inflation.
- Leaving out the stakeholder, time period, counterargument and limit of evidence.
Frequently asked questions
What is the basic economic problem?
Scarce resources cannot satisfy every want simultaneously, so people and societies must make choices and face opportunity costs.
What is opportunity cost?
The value of the next-best feasible alternative forgone when a decision is made.
Can an outing be free but still have an opportunity cost?
Yes. It can require time and forego another activity even when no admission fee is charged.
What can students study at One Punggol Hawker Centre?
Menu offers, consumer choice, demand hypotheses, differentiated products and the difference between price, revenue and profit.
Can a queue prove a stall’s demand curve?
No. A queue is one observation influenced by time, capacity, price and many other variables.
What is a demand shift?
A change in the relationship between price and quantity demanded due to a non-price determinant under a model.
What is the difference between price and unit price?
The posted purchase cost differs from cost per comparable quantity, such as price per 100 grams.
Is Oasis Terraces a new-generation neighbourhood centre?
HDB describes it as the first of its new-generation neighbourhood centres, with integrated services and public space.
What distinguishes Northshore Plaza?
HDB identifies its seafront design, community spine and links to housing, Samudera LRT and Punggol Promenade.
Can the LTA fare calculator give actual journey costs?
It calculates specified card fares with selected trip details and categories, subject to its published rules.
Why does time matter in transport economics?
Waiting, walking and transfers can affect a journey’s generalised cost beyond the money fare.
Are public libraries pure public goods?
A library offers public benefits and access, but particular seats and resources may be rival or subject to eligibility and limits.
What is a negative externality?
A cost imposed on others that is not fully reflected in a private decision, such as certain forms of pollution.
Does PUB measure a treatment percentage in this guide?
No. The environmental cost calculations are fictional. PUB documents the engineered treatment purpose of Lorong Halus Wetland.
How large is Punggol Digital District?
JTC describes a 50-hectare district integrating businesses and SIT’s campus.
Does the 28,000-jobs figure mean that many are employed today?
Not necessarily. JTC uses it in the district’s development description; actual occupied employment needs separate data.
What is inflation?
A sustained rise in the general price level commonly measured with a defined price index, not one shop price.
What is CPI?
The Consumer Price Index measures price changes for a defined consumer basket using official methodology.
Is Economics offered to all G3 students?
No. SEAB’s 2027 G3 list marks Economics K343 as subject to approved-school offering conditions.
How should an Economics answer end?
Explain the mechanism, evaluate different stakeholders and say which assumptions or missing evidence limit the conclusion.
Official Economics references and related Punggol guides
- Choose between competing uses of a school-holiday afternoon
- Compare real menus at One Punggol without inventing market prices
- Investigate why unit price is not the same as household welfare
- Contrast Oasis Terraces with Northshore Plaza as location decisions
- Use public transport fares to distinguish money price and generalised cost
- Distinguish private goods, shared services and public benefits at One Punggol
- Examine environmental externalities around Waterway Park and Lorong Halus
- Explore Punggol Digital District without converting capacity into actual jobs
- Study inflation with official national CPI instead of an invented Punggol inflation rate
- Practise evaluating a market-policy claim using evidence and counterarguments
- SEAB 2027 G3 Economics K343 listing
- MoneySense budgeting and economic choices
- SingStat consumer price and inflation data
- Punggol family budgeting companion
- Punggol enterprise and business research
- Punggol engineering constraints and systems
- Punggol environmental and human geography
Good Economics explains a choice rather than merely adding prices
Start with a clear Punggol example, identify the scarcity or incentive, build a labelled model and explain how the real world could differ from the assumptions. Economics becomes valuable when a student can say why choices have consequences, whose interests matter and which evidence would change the conclusion.


