
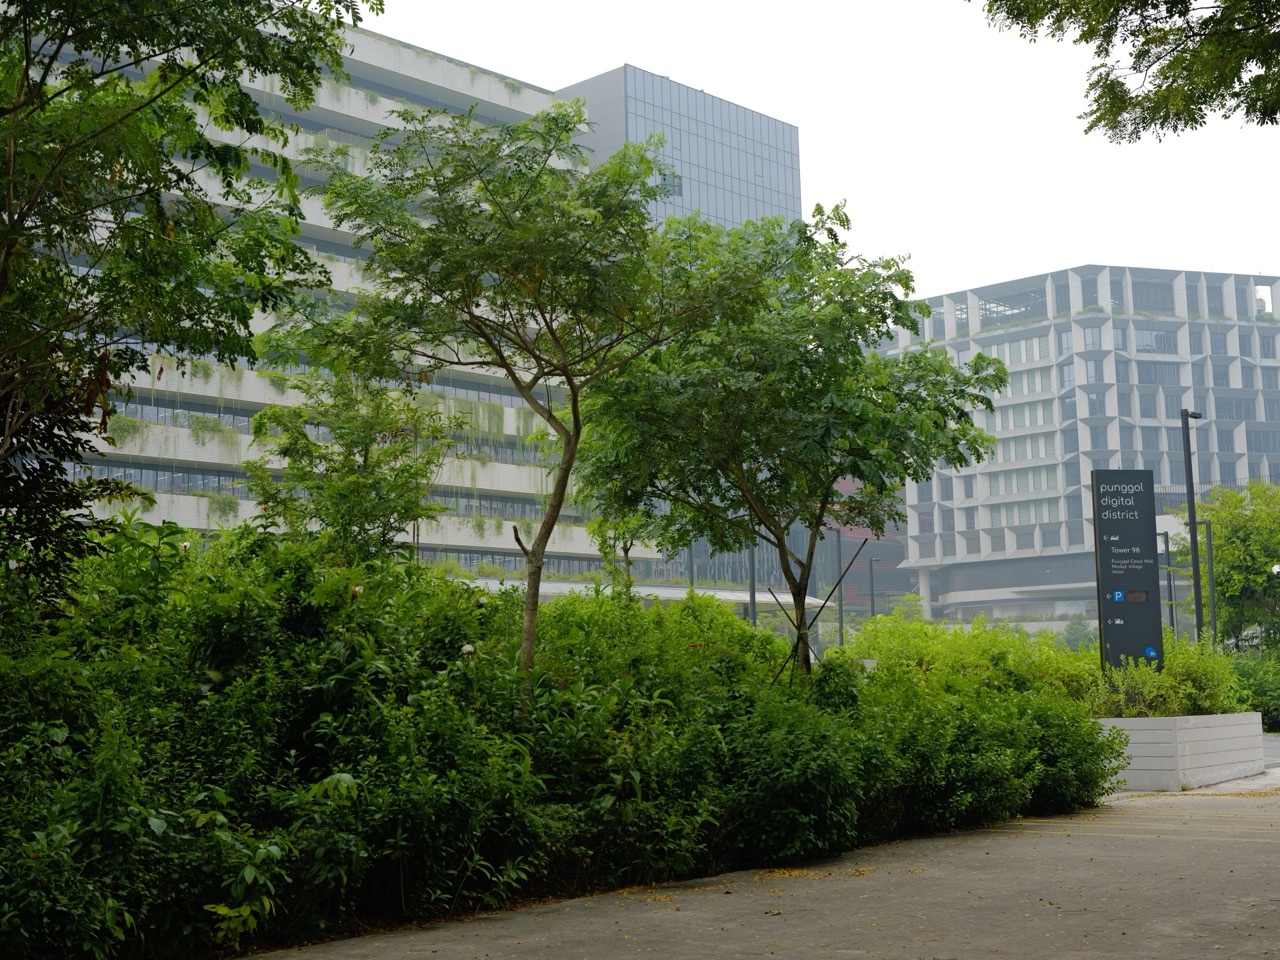
The top 10 things to do in Punggol for Computer Science students are to model MRT and LRT routes as graphs, study data.gov.sg’s PM2.5 API, clean fictional environmental records, join an approved coding and robotics starter session at MakeIT Punggol, build an original Waterway-themed game, design an uncertainty-aware bird data log, prototype One Punggol wayfinding, diagram Punggol Digital District’s smart grid, minimise unnecessary personal data and test a Punggol information app against current official sources.
Best starter project: make a graph of a few Punggol rail stations or build a five-row fictional environmental dataset and a validator. You can finish a real computer-science exercise from home without claiming to possess live data. NLB MakeIT at Punggol Regional Library is a genuine option for technology learning, with its own eligibility, registration, session and equipment rules.
This October 2026 guide is about computational thinking, algorithms, testing and responsible software design, not simply how to install apps. Every worked value is a labelled example unless attributed to an official source. Code should show when data is stale, regional, unverified or unavailable. A student prototype is not the same as a deployed government or commercial system.
Pick the right computing skill to learn
- Primary: events, loops, variables, state and an original block-coded game.
- Lower Secondary: graph modelling, data validation, debugging and simple functions.
- Upper Secondary: APIs, timestamps, missing values, testing matrices and user-interface choices.
- Advanced: cyber-physical architecture, system reliability, privacy and source provenance.
- Maker interest: enquire about NLB MakeIT’s real starter session instead of assuming equipment is available for casual use.
- Fieldwork interest: design data structures using lawful personal wildlife observations rather than collecting people’s identity or movement data.
Computational thinking starts before code
The first step is decomposition. Build a small function that answers a clear question instead of promising to build an app for the whole town. A useful problem could be finding the cheapest path in a fictional rail graph, computing the mean of valid numeric environmental readings, or displaying a cited park opening range. You should be able to state the expected output before choosing a language or framework.
Next identify the right representation. Stations are conveniently represented by graph nodes and edges. PM2.5 observations need timestamps, units and reporting regions. A game needs states and event rules. A venue-hours card needs the source date and cannot claim live availability if it has no live connection. Poor representations create bugs that attractive screens cannot repair.
Finally write tests that deliberately try to break the program. The ordinary case shows that the idea works under expected conditions. A missing timestamp, invalid station name, stale reading or repeated game key press shows how the application behaves under uncertainty. Record each error and make one correction at a time. Responsible programming includes knowing when not to guess.
Ten Punggol Computer Science projects
1. Turn the Punggol MRT and LRT network into a graph algorithm
Where: Current LTA rail maps covering Punggol MRT, the Punggol LRT loops and Punggol Coast MRT.
The computing concept
A railway map introduces graph theory because stations can become nodes, direct service connections can become edges and changes between services can carry a cost. Punggol MRT is an interchange linking the North East Line with East and West LRT loops. Punggol Coast is a separate North East Line station that opened in December 2024. A real transit map gives a meaningful structure for algorithms without requiring a student to trespass on railway premises.
Step-by-step project
Read LTA’s current operating network information, then choose just six or seven real nearby stations. Draw nodes and links on paper. For a classroom problem, attach invented positive weights to the links and clearly state that they are not actual journey times or fares. Solve a shortest-cost route first by listing possible paths, then use a suitable algorithm as confidence grows. Add a transfer rule and consider the difference between minimum stops and minimum total journey time. Confirm operating route directions separately before a real trip.
Worked example and likely bug
Fictional model: station A connects directly to C at a cost of 7, or goes through B with costs of 2 and 3. The direct path costs 7 units; A to B to C costs 5 units, so the latter is optimal within this tiny graph. An algorithm might produce an incorrect answer if a future line is accidentally included as an operating edge, or if its program confuses a label with a weighted cost. The student should catch the mistake before calling the output a real journey plan.
An extension for confident learners
Add an accessibility preference. The fewest-edge route may not be preferable if an important lift or walking link is unavailable. A model that has no live station accessibility feed must not invent its status. Return an uncertain flag and direct users to current operator information. Discuss how a software objective reflects the person’s actual need rather than an abstract fastest label.
Permission, privacy and evidence
Station diagrams are not geographical scale maps. Directions and temporary transport services can change. Do not present arbitrary weights as LTA fares, passenger volumes or operational times, and never access restricted railway control systems to obtain data.
Official reference: Turn the Punggol MRT and LRT network into a graph algorithm. Consult current documentation and site access information.
2. Read a real data.gov.sg environmental API specification
Where: At home, school or Punggol Regional Library using official public documentation.
The computing concept
Singapore’s data.gov.sg developer guide documents a real-time NEA PM2.5 API returning values for major reporting regions. Its specification includes a timestamp, region metadata, date filter and concentration units of micrograms per cubic metre. This is a strong introduction to data contracts: before writing a chart, a programmer must know where the data came from, what each field represents and what level of geographical precision the measurement supports. A regional value is not a personal sensor in someone’s Punggol flat.
Step-by-step project
Open the official real-time APIs guide and note the PM2.5 endpoint and documented query parameters. Draw a response schema with timestamp, region and numeric concentration. Mark whether every field is required, how missing readings should be represented and which unit is expected. For a first exercise, use fictional records that follow the expected structure. More advanced students can test the official endpoint under published rate limits, without storing credentials in public source code or making repeated excessive requests.
Worked example and likely bug
An invented record contains region North-East, time 09:00 SGT and PM2.5 concentration 18µg/m³. The reading is not an actual NEA measurement. Its region field is categorical and its concentration field numeric; the time must be interpreted within the correct timezone. If the app displays the fictional value under the heading Punggol Street-Level Live Reading, it has introduced false location and freshness claims even though the code renders correctly.
An extension for confident learners
Describe the difference between a client error, a response with no observations and a delayed update. For each, design an error message showing the information’s state rather than filling in arbitrary zeroes. A resilient environmental dashboard displays its last known timestamp and source, and does not pretend it knows a user’s indoor exposure.
Permission, privacy and evidence
Data.gov.sg documents rate limits and API-key arrangements. Production workflows should follow the current provider terms; secrets must not be embedded in public scripts or WordPress posts. For real environmental health decisions, rely on current NEA guidance, not a student demonstration.
Official reference: Read a real data.gov.sg environmental API specification. Consult current documentation and site access information.
3. Clean a five-record Punggol haze dataset and explain missing information
Where: An offline spreadsheet or beginner Python exercise using explicitly fictional regional data.
The computing concept
Computer Science includes data validation as well as coding syntax. Environmental time series can include duplicate timestamps, gaps, wrong field types and inconsistent units. A pretty graph cannot correct invalid inputs. Beginners can learn the distinction between a missing value and a genuine zero, and why combining 24-hour PSI and one-hour PM2.5 in the same numerical average is not valid. The lesson is useful for real open-data work without fabricating today’s weather.
Step-by-step project
Create a tiny table with five fictional hourly concentration readings and one missing entry. Add a separate version containing a duplicate timestamp or a text value in the numeric column. First sort by time, then check timestamp uniqueness, expected units and valid numerical fields. Keep a cleaning log describing every adjustment. Draw a graph with a gap for missing data rather than an invented dip to zero. Write a separate validator function and a summary function for more advanced learners.
Worked example and likely bug
Illustrative sequence: 10, 12, missing, 20 and 18µg/m³. The valid observed-value average in this fictional set is (10+12+20+18) divided by 4, which equals 15µg/m³. Dividing by five would treat the missing entry as a zero-like observation without evidence. A unit test should verify that the program returns four valid observations and one missing value, not five numeric observations.
An extension for confident learners
Test an entirely empty dataset and one whose dates are unordered. Consider whether two conflicting readings with the same timestamp should be flagged instead of quietly choosing whichever one appeared later in the file. Discuss provenance and version control: a transformation that cannot be explained or repeated creates less trust, even when it improves the graph’s appearance.
Permission, privacy and evidence
Do not describe invented values as NEA readings from a particular day. A regional environmental average cannot diagnose someone’s medical condition or give exact personal exposure; use official warnings for safety decisions.
Official reference: Clean a five-record Punggol haze dataset and explain missing information. Consult current documentation and site access information.
4. Practise debugging at NLB’s MakeIT coding and robotics sessions
Where: MakeIT at Punggol Regional Library, Level 4, 1 Punggol Drive.
The computing concept
NLB includes Robotics and Coding among the signature MakeIT learning areas and describes introductory Starter Sessions. The facility shows how software interacts with devices, but machines have training, eligibility, booking and safety requirements. A beginner should understand events, sequence, loops and conditions before trying to make a robot perform complicated tasks. A session listing is not proof that a place is open for immediate walk-in use.
Step-by-step project
Consult the official MakeIT page and select a genuinely available suitable programme. In a confirmed class, set a small authorised challenge, such as a virtual robot moving forward and stopping. Predict the next action, run the program, observe what happened and locate the first incorrect instruction. Change one command and retest. If there is no place in the session, use a paper flowchart or block-based coding tool at home instead of entering the makerspace and handling equipment.
Worked example and likely bug
A simulated robot is meant to go forward twice and then turn once. The first program repeats the turn command inside a three-iteration loop, so the end direction is wrong. The learner identifies where the repeated command was inserted, moves it outside the loop and runs the same test. The debugging win is explaining the control-flow mistake, not merely making a robot move somehow.
An extension for confident learners
Introduce a simulated distance sensor with a conditional: if the sensor value is below a chosen threshold, stop; otherwise move. Test the exact threshold boundary and a missing sensor value. Discuss why real hardware also needs calibration, safety interlocks and supervision. A successful simulation does not qualify someone to operate physical equipment alone.
Permission, privacy and evidence
NLB’s general MakeIT guidance recommends the equipment and programmes for ages 15 and above; specific sessions have conditions. Keep hands away from unfamiliar hardware and follow instructors. School or family coding is not permission to modify shared public robots.
Official reference: Practise debugging at NLB’s MakeIT coding and robotics sessions. Consult current documentation and site access information.
5. Build a tiny original Waterway Park game using events and variables
Where: At home with a suitable offline or permissioned block-programming tool.
The computing concept
IMDA’s Code for Fun highlights computational thinking, events, loops, variables, functions and conditionals. An original small game inspired by Punggol Waterway provides a good context because a character can cross a fictional bridge or collect observation cards without using real visitor information. The goal is deliberately modest: represent a player state, accept an input, recognise a winning condition and prevent duplicate rewards. Complexity can grow only after basic testing works.
Step-by-step project
Draw your own simple blue-water background and one original player sprite. Set a starting position, a target position and an integer score. On a real key press, move by one permitted unit. When the player reaches the target, mark the game completed and award one point. Add a restart event to reset the state. Write tests for too many inputs, negative movement, reaching a boundary and repeated key presses after completion. Save versions with descriptive names instead of overwriting every attempt.
Worked example and likely bug
Fictional game rule: start at position 0, advance one place per valid key press, and complete when position reaches 5. A buggy version increases score every time the player presses a key while already at position 5. The corrected state includes a completed flag so success is awarded exactly once. A learner should be able to explain why the extra condition fixed the state machine rather than merely report that the screen looks better.
An extension for confident learners
Add a simple help screen and keyboard instructions. Ask someone unfamiliar with the game to test it. If they cannot identify the controls, the problem may be user-interface design rather than a failed movement algorithm. This introduces the distinction among code correctness, usability and content accuracy.
Permission, privacy and evidence
Do not copy commercial artwork or audio without permission. The fictional game should not reward unsafe real-world actions like climbing railings or entering the park water. Keep any user data local and avoid collecting players’ identities unnecessarily.
Official reference: Build a tiny original Waterway Park game using events and variables. Consult current documentation and site access information.
6. Create a biodiversity record that preserves uncertain bird identification
Where: A safe public Punggol Waterway Park observation or purely fictional desktop dataset.
The computing concept
NParks lists birds such as the Black-naped Oriole among species associated with Punggol Waterway Park. For programmers, the important lesson is how a data structure preserves uncertainty and observation method rather than turning every yellow bird into a confirmed species. A personal wildlife log is not the same as NParks’ trained Garden Bird Watch survey. Good software must represent what the observer actually knows and what remains unverified.
Step-by-step project
Design fields for observation time, broad public site, organism group, probable identification, identification status, count and method. Write validation rules: counts cannot be negative, timestamps cannot be empty, and provisional records cannot silently become confirmed. If visiting, watch quietly from a lawful path and never track personal data about other users. A learner may start with fictional observations and compare the structure to an approved formal survey’s published method.
Worked example and likely bug
A fictitious observer sees one yellow bird whose distinctive field marks are not clear. The record should store an unknown bird, provisional identification status and count one. The buggy classifier maps all yellow birds to Black-naped Oriole and falsely increases the confirmed species count. The fix preserves unknown status until an appropriate source or evidence justifies a more precise identification.
An extension for confident learners
Create a function that computes the number of confidently identified species, excluding provisional labels. Compare that with total number of individual observations. A second test uses two records that may describe the same animal and explains why unique-animal counting needs a field method, not just duplicate-removal code.
Permission, privacy and evidence
Do not publish exact nest locations, photograph private homes intrusively or present a family log as an official biodiversity census. No application should encourage collecting or disturbing wildlife for an image.
Official reference: Create a biodiversity record that preserves uncertain bird identification. Consult current documentation and site access information.
7. Prototype clearer directions from Punggol MRT to One Punggol
Where: Official public transport and One Punggol wayfinding information, tested as a desk prototype.
The computing concept
A route-planning interface is a real software design problem involving destination selection, clear instructions and handling uncertainty. One Punggol includes a regional library and Level 2 hawker centre reached through public circulation. Designing for first-time visitors helps students understand that correct code can still be unusable if its labels are ambiguous, routes are outdated or lift access is assumed. An accurate prototype can be made without collecting any live user’s movement history.
Step-by-step project
Read the official public information for the station and community hub. Sketch a start screen asking what public destination the user wants, a simple route-information screen and a fallback page for route uncertainty. Avoid claiming the prototype can track live lift operations unless such data is genuinely connected. Give it to a consenting family tester and ask where the text becomes confusing. Adjust labels or hierarchy, then repeat the same scenario rather than adding elaborate animations.
Worked example and likely bug
A proposed interface has buttons L and H. One tester thinks L means Left while another thinks Library. The programmer changes them to full names with a meaningful directional explanation. The revised design is clearer in that test. It still does not prove actual barrier-free access, which must be checked with current operator and site information.
An extension for confident learners
Test a simulated lift outage using fictional data. A responsible design presents an unavailable or unverified route state instead of confidently sending a mobility-aid user through a nonexistent alternative. Explain why handling absent information can be more important than selecting the visually shortest path.
Permission, privacy and evidence
Do not imitate real government authentication pages, store personal itineraries without a justified purpose or install unauthorised signs in public. A desktop prototype is not an official live routing service.
Official reference: Prototype clearer directions from Punggol MRT to One Punggol. Consult current documentation and site access information.
8. Diagram Punggol Digital District’s solar grid as a cyber-physical system
Where: JTC’s published sustainability guide for Punggol Digital District near Punggol Coast MRT.
The computing concept
JTC describes a district-level smart grid integrating rooftop solar generation, battery storage, data and control technologies. This makes an excellent systems-engineering context: software uses inputs from physical equipment, but the real implementation’s operational code and sensor streams are not available merely because the district has public walkways. Students can use a conceptual architecture to learn about system boundaries, data flow and safe handling of sensor failure.
Step-by-step project
Read JTC’s public page and identify actual components it names: solar panels, energy storage, grid integration, power demand and digital systems. Draw arrows for electrical energy and different arrows for control or information. Clearly label the drawing as an educational abstraction. Choose fictional numeric inputs for a controller rule, and decide how your program reacts when a sensor supplies invalid data. Explain which details are confirmed by JTC and which are classroom assumptions.
Worked example and likely bug
Hypothetical controller: when model solar generation exceeds 4 units, report adequate solar; otherwise report additional supply may be needed. Test solar readings of 3, 4 and 5, and a missing reading. The exact equality case depends on the specification. A serious bug occurs when the missing value is silently replaced by 5 and the system claims adequate power without evidence. The fix is an explicit unknown state.
An extension for confident learners
Discuss why operational technology needs cybersecurity, testing, calibration and appropriate human oversight. Expected annual solar generation is an energy estimate, not a real-time power value. A diagram without electricity and control distinction can mislead users into believing software data physically powers the building.
Permission, privacy and evidence
Do not attempt to reach or query real district grid controllers, campus networks, batteries, rooftop panels or private technical facilities. The project is an offline learning model only.
Official reference: Diagram Punggol Digital District’s solar grid as a cyber-physical system. Consult current documentation and site access information.
9. Design a small Punggol app with minimal personal data
Where: Home, classroom or Punggol Regional Library public study space.
The computing concept
Good software starts with a purpose and collects only data needed for that purpose. A reading-time calculator can total minutes without full names and home addresses; a bird log can use broad public habitat labels without precise nest coordinates; a railway route solver can operate without knowing a family’s entire travel history. This is not a decorative privacy disclaimer: storage choices affect risks, access controls, testing and whether someone can trust the application.
Step-by-step project
Choose a harmless project, such as a local reading log with fictional records. List proposed fields and mark each as necessary, optional or unnecessary. Delete unnecessary identity, contact, medical and precise home-location fields before coding. Test with made-up data, not real users’ private information. If a school project ever requires real personal data, the institution should handle consent, policy and safeguards. Write a short retention plan for any local files you actually create.
Worked example and likely bug
An original demo asks for each child’s name, class, parent phone number, apartment address, chosen book and reading minutes. The first four identity fields do not help calculate time totals. A redesigned model uses an anonymous local session label and a number of minutes. It still supports a meaningful weekly chart while creating fewer privacy risks. The program should also handle empty sessions without displaying somebody else’s account.
An extension for confident learners
Imagine the prototype accidentally stores a photograph with a resident visible. The developer should avoid uploading the photo and should remove unnecessary data from the demo, not merely crop an icon on the screen. Discuss how indirect identifiers can combine to reveal identity even without an explicit name.
Permission, privacy and evidence
Do not scrape private sites, post identifiable minors’ data or publish API keys and passwords. An anonymous label is not guaranteed anonymisation if other fields can reidentify someone.
Official reference: Design a small Punggol app with minimal personal data. Consult current documentation and site access information.
10. Test a Punggol information app for outdated facts and graceful failure
Where: An offline student prototype using official park or library information as reference.
The computing concept
Software testing is the difference between an app that looks convincing and one whose information can be trusted. Punggol offers a simple check: NParks lists Coney Island Park’s opening hours as 7am to 7pm. A prototype that displays the park as open 24 hours contains a substantive user-facing bug. Developers must also manage missing data, invalid input and the boundary between a stored official description and a live guarantee of availability.
Step-by-step project
Build a small app card or spreadsheet that displays a venue name, documented hours, source URL and last-reviewed date. Create test cases for an empty venue name, misspelling, outdated hours, offline condition and an unverified service. Compare facts against the relevant current authority page, correct mismatches and keep the original bug record. Do not make unsupported promises such as a booking being confirmed. Test only your own program, not the provider’s production systems.
Worked example and likely bug
A fictional card incorrectly says Coney Island Park is open all night. A content-validation test compares it with the current NParks 7am–7pm listing and flags a mismatch. The corrected card displays the listed range plus a prompt to check current closures. At exactly 7pm, the program must not claim that entry is currently possible merely because the time equals the published closing value. A boundary case teaches why text and operating policy matter beyond arithmetic.
An extension for confident learners
Write a test matrix with normal, missing, boundary and stale-data cases. An empty list should produce a useful no-results message; a delayed API should show a timestamp; an unknown lift status should stay unverified. Add a short version log so another developer can tell which claims changed and why.
Permission, privacy and evidence
Testing your own mock-up is permitted; stress-testing, scraping or probing real government or venue services without approval is not. Keep sources attributed and avoid implying an educational prototype can perform real bookings, accessibility checks or official weather monitoring.
Official reference: Test a Punggol information app for outdated facts and graceful failure. Consult current documentation and site access information.
A reliable five-stage Punggol coding project
State the user problem
Identify one reader or user and what they need to accomplish. Does a traveller need to distinguish two stations, does a family need a correctly labelled environmental chart, or does a child need a small educational game? Set the task’s limits. A homework demonstration does not need logins, payments, personal addresses, live bookings or access to restricted infrastructure.
Specify data, types and units
A station name is text. A count is an integer that must not be negative. PM2.5 concentration has a unit and a time. A missing reading is unknown, not automatically zero. A game-completed state is a Boolean-like condition, not a repeated reward. Explicitly state whether a field is required, how it is validated and what happens when it is absent.
Write the expected result before running the program
Choose a tiny test case with a known answer. A hypothetical rail network might have two possible paths with totals of five and seven. A four-number data example may have a mean of fifteen. A small game should award one score only when a finish condition is first met. Writing the expected result before seeing the implementation helps prevent adapting the answer to a bug.
Test missing and wrong input
Supply a nonexistent station, no weather data, a duplicated timestamp and a repeated winning move. Each should produce a documented outcome, such as an error, a null result or a safe no-change state. Do not patch over a failed API by inserting a fabricated current reading. The application should be honest about what is known.
Document and test again
Save the test inputs, corrections, current source references and remaining limits. A useful short README explains what the project demonstrates, which data are fictional and why it should not be relied upon as an official public service. After each change, rerun earlier tests to make sure the fix has not broken something that worked.
Three practical computing sessions
A 45-minute graph lesson
Use current LTA information to copy a small subset of stations near Punggol. Make an adjacency list and attach deliberately fictional edge costs. Find a route and check its total. Change one cost and see whether the selected route changes. If you later travel, use current operator details rather than the fictional model’s numbers.
A data-quality afternoon
Read the data.gov.sg API guide, then create a sample local CSV containing fictional PM2.5 values with timestamps and units. Write a validator, plot or table only the valid values and show a gap for missing observations. Keep the source note clear so nobody reads the demonstration as a current public haze report. Advanced students may access genuine APIs under documented rate limits and permissions.
A maker or game weekend
Choose an approved MakeIT session if one is available, or build a block-coded Waterway-inspired game using your own graphics at home. Implement a simple event, a score variable, a winning condition and restart. Test the win condition twice and check that the score is not added repeatedly. The experience is about making the program predictable and understandable, not about producing the most complex animation.
The meaning of a missing reading
Take a fictional five-row concentration dataset containing four numbers and one missing value. The average should be computed from appropriate valid records under a documented rule, not from five values with the blank replaced silently by zero. The missing row can remain a gap in a chart. If the time period or geographic region is wrong, even a mathematically correct average may answer the wrong question.
Data can be incorrect without looking visibly strange. A duplicated time, mismatched unit, stale source or change to the API schema may create believable but wrong charts. Students should preserve provenance and a last-reviewed date. A program that explains its uncertainty is more trustworthy than one that always returns a confident number.
Privacy and safety rules for Punggol coding projects
- Use fictional data to learn algorithms and data-cleaning steps.
- Collect no personal data unless genuinely necessary and properly authorised.
- Keep API keys, passwords and authentication codes out of published demonstrations.
- Do not scrape accounts, photograph unsuspecting visitors for a model or store private routes unnecessarily.
- Respect copyright for game graphics, photographs and libraries.
- Do not claim access to JTC’s operational smart grid or restricted university networks.
- Use live operator sites for actual travel, entry and booking decisions.
- Test your own app, not external production systems without authorisation.
- Show timestamps and provenance for information that changes.
- Preserve uncertainty instead of silently inventing values.
Frequently asked questions
What is a good first Computer Science project about Punggol?
A small MRT station graph, fictional environmental dataset validator or original waterway game is a practical starting point.
Is Computer Science more than using digital apps?
Yes. It concerns algorithms, data representation, software design, debugging, testing and computing systems.
Can I learn coding at Punggol Regional Library?
NLB lists MakeIT on Level 4 with coding and robotics among its learning areas. Check current session availability and conditions.
Can younger children use MakeIT equipment freely?
Do not assume so. NLB lists general age recommendations and training, booking and safety requirements.
What does a graph represent?
A network of nodes and edges, useful for modelling connections such as public transport stations.
Is the fewest-stop railway path always the fastest?
No. Waiting, service direction, transfers and user accessibility requirements can change the best journey.
What is the official data.gov.sg PM2.5 API?
The developer guide documents an NEA regional PM2.5 endpoint at https://api-open.data.gov.sg/v2/real-time/api/pm25, subject to current provider terms.
Is a regional PM2.5 reading the value outside my home?
No. Major-region measurements do not represent a private street or indoor sensor precisely.
What is a timestamp?
A record of a date and time associated with an event or measurement, needed to interpret freshness and order.
What is a missing value?
An unavailable or unrecorded observation, which should not automatically be treated as a numerical zero.
Why should students validate data?
To detect wrong types, duplicates, impossible values, absent fields and inconsistent units before analysis.
Can a Punggol park game use famous game characters?
Use original or appropriately licensed materials rather than copying protected artwork or music without permission.
What is a condition in coding?
A rule that chooses behaviour based on whether a specified test is met.
What is a game-state bug?
An error in variables or events that produces incorrect behaviour, such as counting success repeatedly.
Can I create an app to count Punggol birds?
Yes, but it must preserve uncertain identifications and respect wildlife and visitor privacy; it is not automatically an official NParks survey.
Can my route app guarantee a working lift?
Not without an authoritative current status feed and suitable controls. Otherwise mark access as unverified.
Does JTC provide public access to its smart-grid controllers?
No such access should be assumed. Use JTC’s public descriptions for conceptual models only.
What should a student do if an API is unavailable?
Show an appropriate error or clearly dated cached value, and follow the provider’s rate limits.
Can I use real classmates’ personal information in a demo?
Use fictional or properly authorised minimal data; sensitive or unnecessary personal information should not be gathered casually.
What makes a coding project trustworthy?
Document sources, units, tests, assumptions, privacy choices, corrections and the limits of its outputs.
Official computer-science resources and related Punggol guides
- Turn the Punggol MRT and LRT network into a graph algorithm
- Read a real data.gov.sg environmental API specification
- Clean a five-record Punggol haze dataset and explain missing information
- Practise debugging at NLB’s MakeIT coding and robotics sessions
- Build a tiny original Waterway Park game using events and variables
- Create a biodiversity record that preserves uncertain bird identification
- Prototype clearer directions from Punggol MRT to One Punggol
- Diagram Punggol Digital District’s solar grid as a cyber-physical system
- Design a small Punggol app with minimal personal data
- Test a Punggol information app for outdated facts and graceful failure
- Data.gov.sg rate limits
- Data.gov.sg API key security
- IMDA secondary computing and digital-making programme
- Punggol beginner digital skills guide
- Punggol citizen-science data collection
- Punggol Mathematics trail and graph thinking
- Punggol Physics models
- eduKateSG structured teaching reference
Create a small program that knows when it could be wrong
Choose one genuine Punggol-inspired problem, decide how to represent it, test the ordinary case and then test uncertainty. Source real facts carefully, keep fictional inputs clearly labelled and protect people’s data. That combination of logical reasoning, useful tools and responsibility is what makes Computer Science valuable beyond a single coding exercise.


