
Schools and education at Punggol include data literacy: the ability to read a survey, tally, graph or statistic and explain what it genuinely tells us. Primary Mathematics develops age-appropriate data representation and interpretation, but correct bar heights are not enough. Pupils need to ask a clear question, know what each number counts, check the whole behind a percentage and avoid conclusions that exceed the evidence. A colourful infographic may be misleading if its scale, source, date or sample is unclear.
This guide shows Punggol parents how to teach neutral survey questions, frequency tables, graphs, percentages, averages, fair comparisons and the difference between a pattern and a cause. The exercises use fictional classroom and family data, not surveys of actual Punggol pupils. No child needs to collect personal information or approach strangers to practise the mathematics. Use current MOE level-specific syllabus details and teacher guidance for real school tasks, and authoritative sources for current local facts.
- Begin with a precise question and define the quantity being counted or measured.
- Survey questions should not lead or combine incompatible answers.
- Samples must be named honestly; a small group does not stand for every child.
- Use fictional or properly authorised anonymous data to practise.
- A tally table requires consistent categories and a checkable total.
- Percentages require a denominator; pie charts must describe a coherent whole.
- Graph scales, units and dates influence interpretation.
- Means summarise values without revealing all the variation.
- Different groups need comparable definitions and periods.
- A pattern does not automatically establish cause or predict the future.
Definition lock: data, samples, statistics and trustworthy conclusions
Data are observations, measurements or responses recorded using a defined procedure. A sample is the set of cases included in the data. A statistic is a summary such as a count, percentage or average. An inference is a conclusion proposed from the evidence, with a scope and level of certainty. Data literacy means evaluating the entire chain from question to source, representation and conclusion. It is not merely knowing how to make a spreadsheet calculate an average.
A six-step evidence checklist
- State the question precisely.
- Describe who or what was included.
- Check the units, time period and response categories.
- Confirm totals, axes and percentages.
- Separate observations from explanations.
- Write the supported conclusion and one important limitation.

1. Start with a question before collecting numbers
A pupil can create a tidy chart without knowing what the numbers are supposed to answer. That happens when data collection becomes an activity for its own sake rather than part of an investigation. A trustworthy study begins with a precise question: what are we trying to learn, which cases are relevant and what observation would provide an answer? A broad request such as ‘Find out what students think’ leaves too much undefined to support a meaningful conclusion.
Imagine a fictional class considering three optional reading-time activities. The narrow question might be, ‘Which one of these three activities did each of twenty imaginary students select for a particular session?’ This specifies the choices, the group and the occasion. It does not ask which activity is best for all children or which activity leads to the highest grades. The numbers can answer the original question only if the counting procedure matches it.
Teach the reasoning before the calculation
Ask the child to write the question at the top of the paper before making a tally table. Then identify the quantity being recorded: one selection, one person, one event or one measurement. These can differ. If one person selects two activities but the table is labelled ‘number of students’, the total could mislead. The child should decide whether multiple responses are allowed and whether that choice changes the meaning of the figures.
Data collection may not always be necessary. A question about the official number of lessons in a national programme may be answered by the responsible institution’s published information. A question about a fictional game can be explored with invented outcomes. Asking real classmates for personal information is not a default requirement. Parents can teach the statistical method using safe, anonymous or clearly labelled hypothetical data.
A misleading shortcut and an independent check
A common mistake is choosing the conclusion first and collecting numbers that make it look plausible. If a child wants to prove that puzzles are the most popular activity, the categories or wording may be adjusted to favour puzzles. Instead, decide in advance which results would support the idea and which would challenge it. A question is useful when the pupil is willing to accept an unexpected answer.
For transfer, change from activity choices to a Science task measuring lengths of paper strips. The child should identify that the values are now measurements in a unit rather than single-choice categories. Which table fields are appropriate, and which assumptions about counting individual people no longer apply? The new setting reveals whether they understand the question–data relationship.
2. Survey wording can change an answer before anyone responds
An effective survey question is understandable, appropriately neutral and matched to the information needed. A leading question such as ‘Isn’t drawing the most enjoyable activity?’ embeds the writer’s preferred answer. A double question such as ‘Do you like reading and sports?’ cannot show whether a yes means one or both. If the aim is to compare choices, the wording must allow a respondent to give an interpretable answer without being pushed toward a particular response.
A paper exercise can use fictional children with known preferences. Suppose one enjoys reading but not team sports, a second enjoys sports but not reading, and a third likes both. Ask whether a single yes-or-no question about ‘reading and sports’ can faithfully distinguish all three. The student should see the ambiguity before any numbers are collected. Revising the question is part of the mathematical work, not merely an English lesson.
Teach the reasoning before the calculation
Response options also need care. ‘Often’, ‘sometimes’ and ‘a lot’ may mean different things to different people. A question asking how many days an activity occurred during the past week may be clearer, provided the respondent can reasonably remember it and the topic is appropriate. But a specific numerical scale is not automatically better for every question. A child’s preference may require a different form of answer from a count of events.
Parents can teach neutrality by writing two versions of an imaginary school survey and asking which would be easier to answer honestly. The goal is not to remove every human judgement from research. It is to make the wording transparent enough that results are not secretly created by the question itself. If an opinion is being collected, label it an opinion; do not rewrite it as an objective measurement.
A misleading shortcut and an independent check
A common error is changing wording midway through the task. If the first half of the sample answers a question about favourite activity and the second half answers what they did yesterday, the frequencies are not directly comparable. The student should recognise the problem before adding totals. Sometimes a survey must be redesigned and repeated rather than repaired through arithmetic.
For independent transfer, offer a new question about a fictional class voting on a poster design. Let the child remove a biased phrase, define the answer options and explain what the resulting table could legitimately report. A good response names the limit of the conclusion, not only a grammatically improved sentence.
3. A sample is not the same as a population
Data collected from a small group describe that group under the conditions in which the information was obtained. They do not automatically represent everyone in a school, estate or country. The distinction between a sample and the broader population is one of the most important ideas parents can teach when children encounter a survey. It prevents an interesting observation from being presented as a universal fact.
Suppose an imaginary reading club asks twelve members which book genre they enjoy. Eight select mystery. The result tells us that eight of those twelve surveyed members selected mystery, under the stated question. It does not prove that two thirds of all Punggol children prefer mystery. The members may have joined the club because they already enjoy certain kinds of books, and their choices may change when the options change.
Teach the reasoning before the calculation
Choosing participants affects what a result can mean. An invented survey taken only at a sports event may overrepresent people who enjoy sports compared with the whole school. A larger version of the same biased sample does not automatically become representative. Students should ask who was included, who could not be included, and why the selection process might matter to the claim being made.
Privacy must come before novelty. A school project about categorical data does not need classmates’ names, medical information, family income or home addresses. Teachers may provide anonymous or fictional datasets so children can practise tallying and graphing without asking personal questions. A parent should not instruct a child to survey strangers outside a school or publish a list of classmates’ answers for the sake of a ‘real’ project.
A misleading shortcut and an independent check
A frequent mistake is assuming a sample of one hundred is always more trustworthy than a sample of ten. The larger group may reduce some kinds of random variation but can still be selected poorly or asked a misleading question. At primary level, children can learn this practical limitation without formal university statistics. The source and selection method are part of the evidence.
For transfer, compare two fictional groups: thirty pupils from a chess club and thirty pupils chosen for a general school activity. Ask which claims each group could help answer, and which claims require more information. The learner should not describe one group as better people or superior students. The issue is suitability of evidence for a question.
4. Tally tables need rules, labels and a checkable total
A tally table records repeated observations in defined categories. Every mark must represent a consistent event or response, and the categories must be interpretable. Before recording, ask whether the groups overlap and whether one observation may appear more than once. Without those choices, a neat table may hide double counting. Making the counting rule explicit helps the learner understand what a frequency actually means.
Use fictional activity selections: seven paper puzzles, five number games and eight picture books. The total is twenty selections. If the exercise states that exactly twenty pupils each chose one category, it is also twenty pupils. Without that rule, it could be twenty selections from fewer people. The distinction is small in wording but large in meaning, especially when charts later display the figures.
Teach the reasoning before the calculation
Have the child record the tally marks and then translate them into numerical frequencies. Next, reconstruct the original total and compare it with the provided fictional data. This two-way checking shows whether a transcription error occurred. A learner who obtains the correct sum by chance but cannot say what was counted still needs support with the question, not just praise for addition.
Errors may include a missing tally, duplicate counting or inconsistent categories. They are often execution problems that a careful procedure can address. Ask the pupil to trace a small set of observations and mark exactly where the record diverged. Repeating ‘be careful’ does not explain how to improve. A short checking routine is more practical than copying the whole table again with neater handwriting.
A misleading shortcut and an independent check
Teachers may use age-appropriate printed tables, physical counters or digital tools. The representation should fit the intended concept and the learner’s readiness. A spreadsheet is not required to count twenty fictional responses. For an older child, transferring the same dataset between a table and a graph can become a useful test of accurate representation.
For independent transfer, give a different fictional dataset about the colours of twenty-five tokens and ask whether the categories form a complete partition. If one token can count in two categories, the child should identify the ambiguity before calculating. That is the mathematical move that matters.
5. Fractions and percentages need a clearly defined whole
A percentage expresses a proportion of a whole per hundred. Children may remember the calculation while forgetting which group is the whole. An article claiming ‘sixty per cent prefer reading’ has a different meaning if the denominator is ten children, twenty children or the whole school. The number of cases, question wording and sample conditions affect interpretation, even when the percentage arithmetic is correct.
In an imaginary group of twenty single-choice responses, twelve select reading. Twelve divided by twenty is 0.6, or sixty per cent. If another group of two hundred has twelve reading selections, the percentage is six per cent. The same count creates a different proportion because the denominator changed. The pupil should say ‘twelve out of twenty’ before converting it into the more compact percentage.
Teach the reasoning before the calculation
Pie charts can represent proportions when categories form a complete whole. A child should check that the slices refer to the same group and that their proportions are sensible. One pie may describe preferred activities among a group of twenty; another may describe the types of books borrowed by a different group of fifty. Comparing their slice sizes without recognising the differing populations can be misleading.
Some questions have overlapping responses, making a simple pie chart unsuitable. If a respondent may select both reading and music, the sum of category counts may exceed the number of respondents. A pie chart suggesting that every person belongs to exactly one category would misrepresent the data. Teach children to decide whether the display fits the measurement rather than choosing the most colourful option automatically.
A misleading shortcut and an independent check
A child’s first instinct may be to equate a fifty-one per cent result with overwhelming support. The arithmetic difference from forty-nine per cent is two percentage points. Whether that difference is important depends on sample size and context, and no broad population claim follows from a tiny invented dataset alone. Careful wording is more accurate than a dramatic headline.
For transfer, provide fifteen out of twenty-five responses in a fictional category. The proportion is sixty per cent, just as twelve out of twenty was. Can the learner explain both the equality of proportions and the difference in actual counts? That shows understanding rather than mechanical conversion.
6. Graphs need truthful scales, titles and units
A bar graph helps readers compare values, but only when the bars and axes describe the data faithfully. Begin by reading the title, category labels, vertical scale and any unit before comparing heights. The pupil should not assume that every printed grid line equals one. A bar with five visible intervals may represent twenty-five observations if each interval stands for five.
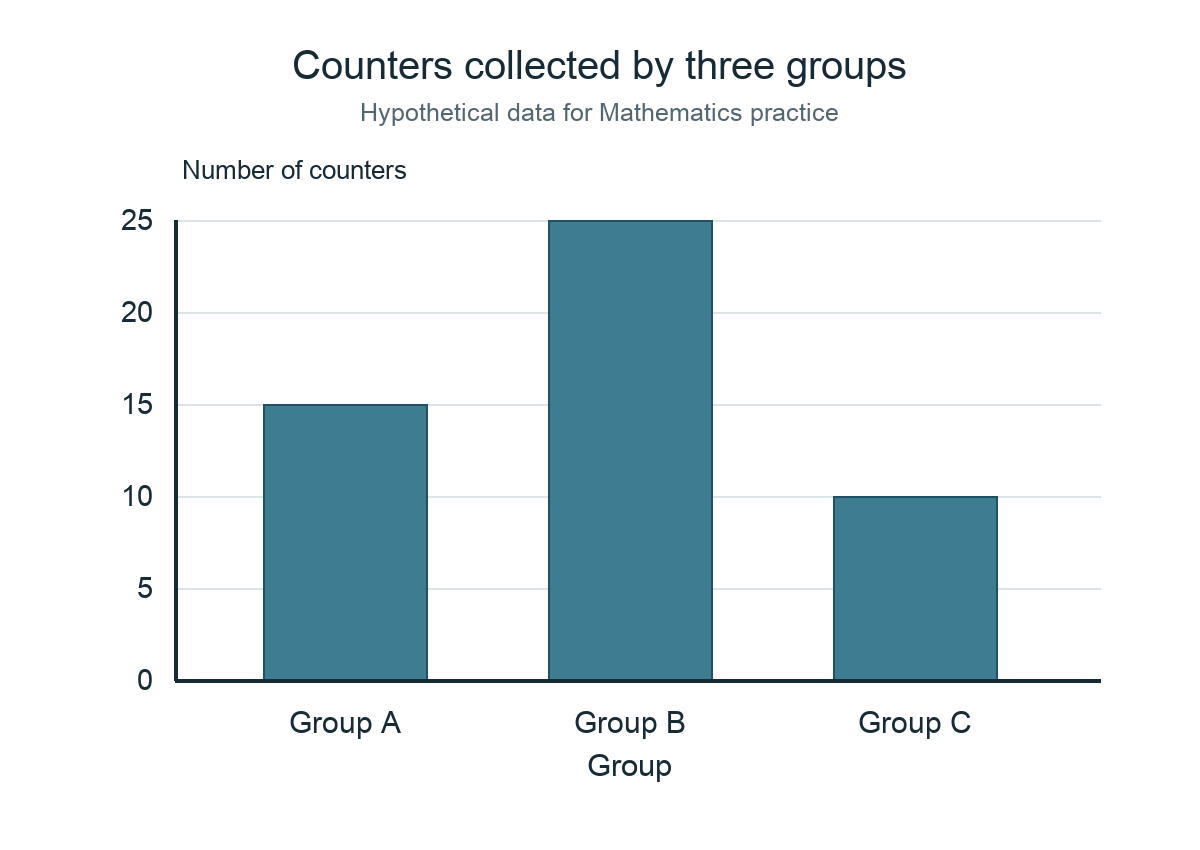
Consider an illustrative chart in which Group A has fifteen counters, Group B twenty-five and Group C ten. The total is fifty. A properly labelled zero-baseline bar chart can make the relative sizes visible. A student should be able to recover the frequencies from the graphic and explain that Group B has the largest count. The chart does not prove anything about children’s intelligence or the long-term popularity of a subject.
Teach the reasoning before the calculation
A distorted impression can arise when a graph starts its vertical axis at a value close to the smallest observation. If two values are ninety-eight and one hundred, an axis beginning at ninety-seven may make the bars look vastly different. Ask the child to identify the actual numerical difference. A truncated axis can have analytical uses when disclosed, but it should not quietly exaggerate the claim.
Line graphs often display changes over an ordered scale, such as time. Readers need to check the intervals on the horizontal axis and the units on the vertical axis. A line connecting two observations can aid visual interpretation but does not automatically describe what occurred at every moment between them. Nor does a rising line establish the cause of the rise. The reader must distinguish representation from explanation.
A misleading shortcut and an independent check
An attractive infographic may omit a source, date or sample description. The absence matters because a chart about a school year can become misleading after programmes change. If data came from an invented practice set, label them fictional. If they came from an official publication, identify the responsible institution and relevant date instead of presenting the graphic as universal truth.
For independent transfer, give a new chart with the same values but a changed scale and missing unit. Can the learner identify the missing information and explain which conclusions are still justified? That is stronger data literacy than simply naming the tallest bar.
7. An average cannot reveal every difference among observations
Averages help summarise numerical data, but the summary is not the entire distribution. At suitable levels, pupils learn the mean as the sum of values divided by the number of values. They should also understand the limitations of the number. Two groups can have the same mean while individual outcomes differ considerably, so a claim based only on averages may omit important information.
Take three fictional game scores of four, eight and twelve. The total is twenty-four and the mean is eight. Another set contains one, eight and fifteen; its total is also twenty-four, giving the same mean of eight. The two groups have different spreads. A parent can ask which details the average preserves and which it hides, without needing to introduce advanced statistical terminology too early.
Teach the reasoning before the calculation
A common calculation error occurs when the child divides by the number of categories rather than the number of individual values. If the data include repetitions, the count still matters. Ask the pupil to label each observation and check the total before dividing. A suitable reverse check multiplies the claimed mean by the number of observations and sees whether the total is recovered.
Not every set of information has a meaningful numerical average. Coding red as one and blue as two does not make an average colour of 1.5 a useful interpretation of the pupils’ preferences. The data type determines which summary can answer the question. Categories may be better described by frequencies; numerical measurements may permit suitable averages.
A misleading shortcut and an independent check
Parents should not treat an average school mark as a complete description of learning. A child may have strong understanding in one topic and a major gap in another. The mean can summarise performance under particular conditions, but it cannot specify which explanation should come next. Examine the underlying tasks and work with the teacher before drawing a broad conclusion.
For transfer, present a new dataset with one unusually large value. Ask whether the mean still communicates the typical individual experience well and what additional values a reader should inspect. The pupil has learned a useful limit when they can make the distinction without being given a fixed phrase.
8. Compare groups only when the definitions and time periods match
Two charts may look compatible because both contain numbers, but their underlying questions can differ. One may record books borrowed, another books read, and a third library visits. Adding or ranking these measures without explanation would create a false comparison. A careful student asks what was counted, over which period and under which conditions before performing a calculation.
Imagine a fictional report showing thirty visitors during a twenty-minute session and twenty visitors during a five-minute session. The larger total does not mean the first session had a higher arrival rate. The pupil should first notice that the durations differ. At an appropriate level, a rate can be calculated if the measurements are compatible. The key is selecting a comparison that actually answers the question.
Teach the reasoning before the calculation
An alternative issue arises with group size. A fictional large class may borrow more books in total than a smaller class, yet a raw-total ranking does not show borrowing per pupil. Ask what denominator would be appropriate and whether both classes were observed under comparable conditions. Even a correctly calculated rate may not establish interest, motivation or reading skill.
Different dates also matter. An official programme statistic from 2024 should not silently be treated as the current 2026 result. A proposed 2027 initiative may not yet be operating. When students use published statistics, they should record the source and period, then state whether the conclusion concerns past observations or current arrangements. This habit is especially useful in a town where facilities and programmes change.
A misleading shortcut and an independent check
Some children are encouraged to choose a winner whenever two figures appear. A mature response may instead be, ‘The data cannot be compared directly.’ Ask what additional information would make the comparison fair. That answer is not an evasion; it identifies the real problem with the evidence. Sometimes a careful refusal to calculate is more mathematical than quick arithmetic on incompatible numbers.
For transfer, compare two fictional school activities where one table records correct answers and another records completed attempts. Can the pupil explain why the totals measure different things and suggest an appropriate common definition? This tests whether the child sees beyond the surface appearance of numbers.
9. Patterns, causes and predictions are different conclusions
A chart may show a pattern without explaining what caused it. If a fictional group completes more puzzles on a day when the session is longer, duration is one possible influence, but the chart alone does not establish every reason for the change. Students should learn to separate a descriptive statement about values from a causal explanation that requires additional evidence.
One helpful writing routine uses two headings: ‘The data show’ and ‘A possible explanation is’. The first sentence should be directly supported by the recorded values. The second must be appropriately qualified unless the design provides a basis for a stronger conclusion. A child can practise this with imaginary measurements without investigating actual classmates or collecting sensitive information.
Teach the reasoning before the calculation
Prediction adds another layer. An invented sequence of ten, twelve and fourteen observations might tempt a pupil to assume the next count must be sixteen. That continuation follows one simple rule but is not guaranteed for real-world data unless the model and conditions support it. A graph describes a recorded period; extrapolation requires assumptions that the reader should recognise.
AI-generated dashboards and polished online charts can be persuasive even when the numbers are fictional or poorly sourced. Teach children to check the publisher, date, units and original dataset where possible. An elegant chart is not an authority on its own. Never invent a Punggol school statistic and present it as a verified result simply because it would look attractive in a learning article.
A misleading shortcut and an independent check
Be careful with stories about individuals. A chart showing low participation in one fictional session does not justify calling students lazy or uninterested. The data may reflect absence, scheduling or the design of the task. A responsible conclusion avoids assigning motives without evidence and protects student dignity. Mathematics and ethical communication reinforce one another here.
For transfer, present three statements about a new fictional graph: one directly supported, one plausible but unproven and one contradicted. Ask the learner to identify each and give the relevant numerical evidence. That is a stronger outcome than drawing a second chart with more decorative elements.
Four-week family exercise: from a question to an honest conclusion
Week one: write a neutral fictional question with clearly defined options and sample size. Week two: tally invented answers and build a labelled table, checking the total. Week three: draw a truthful bar chart and compare it with a version that uses a potentially misleading scale. Week four: use an unfamiliar dataset to calculate a suitable proportion or average, then write one supported claim and one limitation. No actual classmates’ responses, identifying information or public surveys are necessary.
Frequently asked questions
Is data literacy part of primary Mathematics?
Yes. The MOE Primary Mathematics syllabus includes data representation and interpretation at level-appropriate stages. Check the current syllabus and school scope for exact expectations.
Do pupils need to survey real classmates?
No. Fictional or teacher-provided data can teach counting, percentages, charts and critical interpretation. Real surveys require suitable school permission and privacy safeguards.
What makes a survey question misleading?
Leading wording, combined questions, undefined time periods or inconsistent response options may cause the recorded answers to mean something different from the intended question.
Why must a percentage name its denominator?
The percentage describes a part of a defined whole. Identical counts can give different proportions when the whole changes.
Can two groups with the same average perform differently?
Yes. The individual values and spread may differ even when means are equal. A mean is a summary, not a complete description.
Does a line graph prove why something changed?
Not automatically. It shows a recorded relationship or pattern; a causal claim needs additional relevant evidence and suitable conditions.
Can a child trust an infographic because it looks professional?
No. Inspect its source, date, axes, units, sample and claim. Graphic design quality cannot guarantee data accuracy.
Will a data project automatically raise examination marks?
No. It supports important interpretation and reasoning skills, but formal outcomes depend on the actual curriculum, readiness, instruction and assessment conditions.
Your Next Step
Give your child a short table of invented numbers and ask what each value represents before any arithmetic. Change one condition—such as the denominator or the observation period—and ask whether the original conclusion still holds. The objective is a careful mathematical reader who can notice when attractive charts or confident claims leave out necessary information.
Official sources and related Punggol reading
- MOE Primary Mathematics Syllabus, Statistics and Mathematical Processes
- MOE Primary Curriculum Syllabus Directory
- MOE SchoolFinder
- Schools and Education at Punggol | Mathematics Reasoning, Models and Real-World Problem Solving
- Schools and Education at Punggol | Digital Information Literacy, Search and Source Verification
- Schools and Education at Punggol | Social Studies, Neighbourhood Inquiry and Civic Thinking
- Schools and Education at Punggol | Primary Science Fair Tests, Variables and Reliable Evidence
Editorial reference date: 1 November 2026. All example data, samples, charts and scores are fictional unless explicitly attributed. This article does not report results from any named pupil, class or school.


