
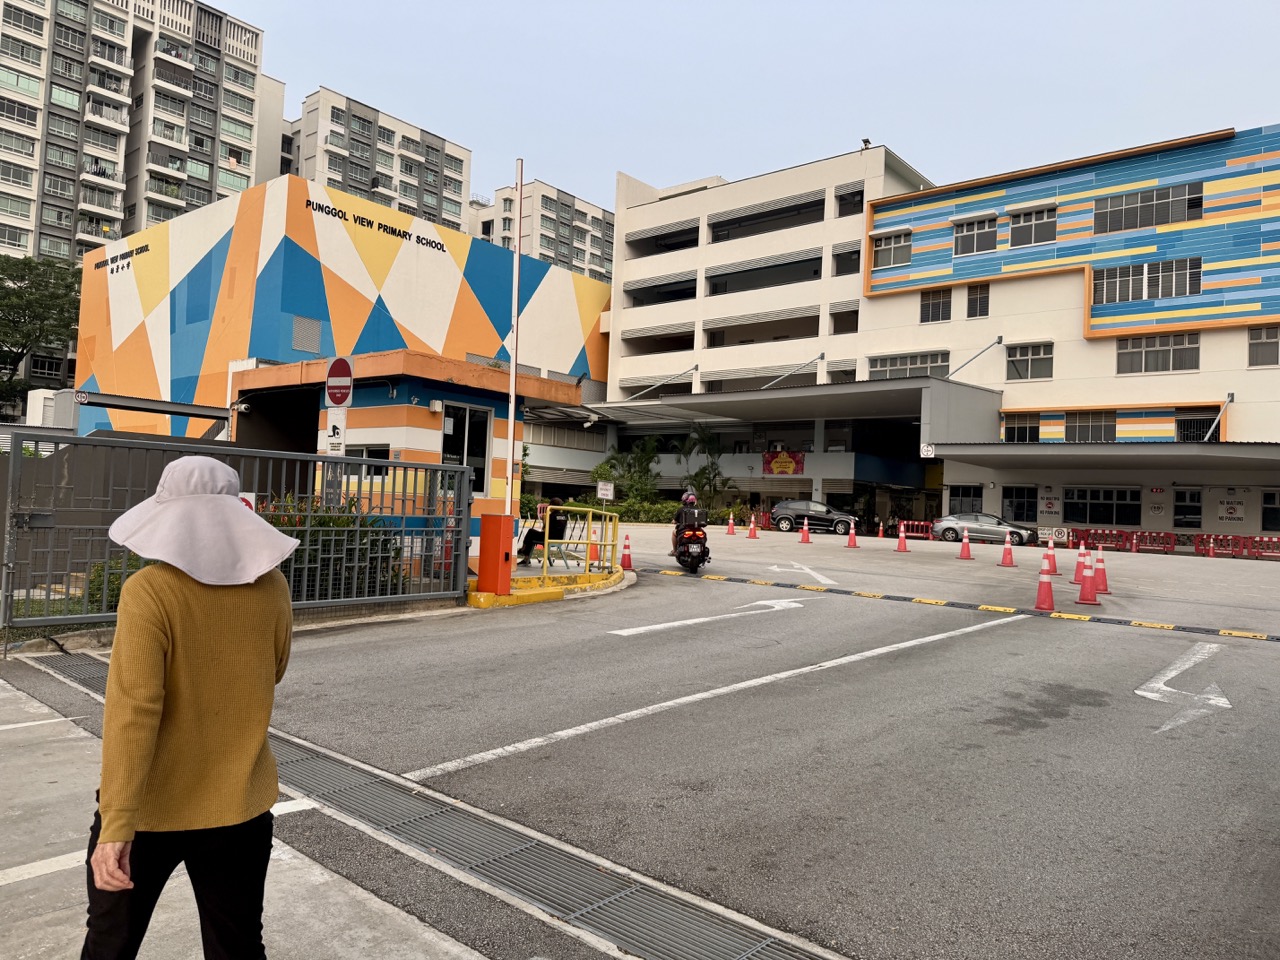
Quick answer. The OECD released PISA 2025 results on 8 September 2026. Singapore’s 15-year-old students averaged 560 points in Science, 563 in Mathematics and 535 in Reading. Compared with OECD averages of 482, 463 and 461, these are strong results. Singapore was the highest-performing system in reading and second in Science and Mathematics behind the participating Beijing–Shanghai–Jiangsu–Zhejiang regions of China. PISA does not award grades to individual Punggol secondary schools or issue students a PSLE or SEC result.
The important educational finding is broader than a ranking. Some 90% of Singapore’s assessed students reached at least baseline Science proficiency compared with 74% on average across OECD participants, while 26% performed at the two highest Science levels compared with 7% for the OECD average. The country note also reports that the achievement gap between higher- and lower-performing students widened from 2022 to 2025. Strong national results therefore coexist with genuine differences in individual readiness and support needs.
PISA 2025 primarily examined how students apply scientific literacy, with additional measures of mathematics, reading and computational problem-solving. Singapore’s students scored particularly well on digital problem-solving, while the OECD collected information about curiosity, perseverance, support and school belonging. The country note says 78.1% of Singapore’s students reported a sense of belonging at school, compared with an OECD average of 76.2%. These are survey responses, not diagnoses or guarantees about a specific child.
The OECD tested 6,551 students across 157 schools in Singapore, representing an estimated 42,500 fifteen-year-olds. A Punggol parent should read this as sample-based evidence about an education system, not proof that a particular tuition centre, neighbourhood or school produces the same outcomes. This guide explains the official numbers, scientific reasoning, digital learning, statistical uncertainty, what parents can ask teachers and why the 2027 SEC, PSLE and other international tests are different. Source check: 23 October 2026.
The latest Singapore PISA 2025 results
| Domain | Singapore average | OECD average | International rank |
|---|---|---|---|
| Science | 560 | 482 | Second |
| Mathematics | 563 | 463 | Second |
| Reading | 535 | 461 | First |
These are scaled mean scores, not school percentages. Rankings refer to participating PISA 2025 systems; OECD country data are published September 2026.
1. What PISA is designed to measure
The Programme for International Student Assessment (PISA) is administered by the OECD as an international study of what students around age fifteen know and can apply. It includes problems situated in real or plausible contexts, and collects information about student backgrounds and learning experiences.
That aim differs from issuing an examination certificate or determining whether a child gets a place in a named Singapore school. A government can use results to understand strengths and areas for improvement, while individual pupil decisions require other information.
Parents should keep the population studied, test domain and purpose together whenever quoting a score. A result without its source and meaning is easy to misuse.
2. September 2026 is the date the 2025 results appeared
Although the assessment is called PISA 2025, the OECD published the new international findings on 8 September 2026. Therefore a guide written in October 2026 should use the 2025 cycle rather than continue calling 2022 the latest available set.
The assessment year and release year are two different dates, which is common for large international surveys that require sampling, scaling and checking across education systems.
When comparing a child’s present secondary curriculum to PISA results, remember the students assessed were fifteen in 2025. They are not the same individuals currently entering Primary 1 or sitting their first 2027 SEC papers.
3. The Singapore sampling facts
The OECD country note identifies 6,551 participating students from 157 schools in Singapore, representing about 42,500 fifteen-year-olds—roughly 95% of the age cohort under its population definition. Across participating systems worldwide, more than 760,000 students were assessed.
These numbers show why PISA can describe national learning patterns, but they do not mean every local school or student was tested. A result from a sample still has statistical uncertainty and coverage conditions.
Parents should not demand a PISA certificate from their teenager or assume a missing individual score proves that the student’s school did not participate in educational evaluation.
4. Why fifteen-year-olds are assessed
PISA focuses on an age cohort approaching the later stages of compulsory schooling in many countries, rather than requiring every education system to have the same school year structure. Singapore’s Secondary 3 and Secondary 4 students can therefore be represented depending on the age and cohort definition.
Comparing fifteen-year-olds is different from comparing Primary 4 pupils studying the same grade-level syllabus. It tests whether teenagers can apply their learning after many years of schooling.
A family should distinguish this from grade-specific international studies such as TIMSS or PIRLS. Mixing their scores together produces a misleading picture because the populations and scales differ.
5. Science was the major PISA 2025 domain
The 2025 cycle emphasised Science. The OECD examined scientific explanation, evaluating how an enquiry is designed, and judging scientific information to support decisions. Mathematics and Reading remained assessed as additional domains, while digital problem-solving was introduced.
Science here is not merely memorisation of technical vocabulary. Students may need to decide whether a conclusion follows from evidence, which measurements matter or whether an explanation is plausible.
That helps parents understand why ordinary classroom inquiry, careful report-writing and meaningful problem-solving can contribute to later readiness even when they do not resemble a multiple-choice revision paper.
6. Singapore’s Science result was 560
Singapore’s mean Science score of 560 was above the OECD average of 482 in the 2025 release. The OECD Education GPS records Singapore as second among participating systems on the mean Science measure, behind the four Chinese regions grouped as B-S-J-Z.
The number 560 is a PISA scaled score, not 560 correct answers or a mark out of 1,000. The instrument’s reporting method permits comparisons and interpretation of proficiency levels under OECD procedures.
A pupil’s local Science examination percentage cannot be directly converted into a PISA score without a valid statistical linking design. Tuition advertising that treats them as interchangeable is misleading.
7. Singapore led Reading, not every measured subject
In PISA 2025, Singapore averaged 535 in Reading, the highest mean in the international comparison. In Mathematics Singapore averaged 563 and ranked second behind B-S-J-Z, which scored 612. The Chinese regions also led Science, at 597.
This is important because simplified headlines sometimes say that Singapore came first in everything. Strong performance deserves accurate reporting rather than unnecessary exaggeration.
The parent question is what students can actually do with reading, mathematical reasoning and scientific evidence, not only whether a national rank can be attached to every domain.
8. Why high national achievement is not every child’s experience
The OECD reports that the gap between Singapore’s higher- and lower-performing students widened in Science, Reading and Mathematics between 2022 and 2025. A national average can rise or remain high even when some pupils require more specific support.
That does not mean every low score reflects laziness, inadequate parenting or a permanent cognitive limitation. Students enter classrooms with different prior knowledge, language experience and learning circumstances.
A teacher should look at actual work, explain the first unreliable reasoning step and check a fresh example. National benchmarking highlights policy questions; classroom diagnosis identifies what one learner needs now.
9. Baseline Science proficiency is about useful understanding
The OECD’s baseline threshold is Level 2. It describes the ability to recognise explanations for familiar scientific phenomena and identify simple cases where a conclusion is valid from data.
Singapore had about 90% of students at this level or above, compared with about 74% across OECD systems. That is an important national achievement, but the remaining group deserves attention rather than public stigma.
A parent can build the underlying habit by asking what the experiment showed and which statement is justified. The aim is reasoned explanation rather than repeated copying of model answers.
10. Science’s highest levels require transfer
The PISA country note says around 26% of Singapore’s students attained Science Levels 5 or 6, compared with 7% across OECD countries. Students at these levels can apply knowledge creatively and autonomously to unfamiliar contexts.
An advanced response might evaluate the design of a scientific enquiry or challenge an assertion that the supplied data cannot support. It often involves explaining why a tempting answer is inadequate.
Children develop this capacity through well-taught prerequisites, varied examples and opportunities to discuss evidence. Completing next year’s worksheet without understanding the current concept is not equivalent to high-level scientific literacy.
11. PISA proficiency is not a Singapore school grade
PISA uses its own described proficiency levels and scaled scores. Singapore’s PSLE Achievement Levels, G1/G2/G3 SEC grades and A-Level subject grades are issued under separate national qualification systems with different assessment purposes.
A pupil who obtains Science AL2 at PSLE does not automatically score PISA Level 2, and a 2027 G3 Science A1 cannot be entered into an OECD PISA calculator. The labels may resemble one another but are not interchangeable units.
Parents should follow the relevant examination authority for school placement and certification. OECD data are used for understanding broad educational outcomes, not awarding local credentials.
12. Original Science worked task: changing two variables
Imagine two fictional school plants. Plant A receives warmer water and more light, while Plant B receives cooler water and less light. Plant A grows taller. A student concludes that warmer water alone caused the difference.
That conclusion is unjustified because more than one plausible explanatory factor changed. To study the effect of water temperature, the learner would hold light and other relevant conditions as comparable as possible while varying only the planned temperature safely.
For transfer, ask how to investigate the effect of light while holding water conditions alike. The important skill is identifying the design flaw, not memorising one plant-related explanation.
13. How to turn the plant task into an actual investigation
A stronger investigation defines the factor being changed, the outcome to measure, materials, safety conditions and method for recording data. It also considers whether repeated trials would help distinguish a pattern from ordinary variation.
The child should not be directed to perform hazardous heating, chemical or electrical procedures at home to make a school project more impressive. Age-appropriate observation and school supervision are sufficient for learning the principle.
A written conclusion should state what was observed and identify limitations. This develops the honest scientific communication that international assessments and responsible work both value.
14. Original evidence task: observation versus explanation
Consider the statement, “There were droplets on the outside of a cold bottle.” That reports an observation. “The bottle leaked” is a possible explanation but not the only one; water vapour can condense on a cool external surface.
The child should decide which new observation or safe comparison would help distinguish the explanations. An intact dry interior or a second suitable container could provide relevant evidence under appropriate conditions.
Ask a changed question about mist appearing on a cool mirror. The learner who explains condensation there has applied the principle to a new context rather than memorising one bottle scenario.
15. Why evidence and inference are different
An inference is a reasoned interpretation, while an observation is something directly recorded. Both are important, but presenting an inference as if it were measured can create a false scientific claim.
For example, a classroom may observe fewer students walking to school on a rainy day. That does not prove rain is the sole cause without checking other relevant conditions and how the count was conducted.
Parents can help children use cautious language: “The observations are consistent with…” rather than “This definitely proves…”. Precision is an intellectual strength, not a reluctance to learn.
16. Sample size changes what a conclusion can claim
Five students providing a survey response may reveal useful questions but cannot establish the views of all teenagers in Punggol. A small convenience group of children attending one tuition provider will not represent every school and family.
PISA is designed as a population study with sampling procedures and statistical methods, unlike a casual online poll. Even well-designed samples carry uncertainty and require transparent population definitions.
Students should learn what a sample represents before interpreting averages or presenting policy conclusions. More numbers collected from the wrong group can still produce a biased estimate.
17. An original Punggol survey-bias example
A fictional pupil asks fifteen friends in an advanced Mathematics tuition group whether students enjoy school Maths. Twelve say yes, producing an observed proportion of 12/15 = 80% within that group.
It would be misleading to report that 80% of all Punggol secondary students enjoy Mathematics. The sample was selected from a setting already connected to subject interest and extra support, not from a representative student population.
For transfer, ask how a school might sample pupils across classes and subject levels with appropriate consent. That is a more useful statistical habit than reporting a large percentage without its source.
18. PISA used more than one test booklet
OECD’s Singapore country note explains that assessed pupils completed a two-hour test and received different combinations of questions and subjects. Each student did not answer every item in the entire international study.
That makes it wrong to imagine a single printed PISA paper that every teenager in Singapore sat under identical content conditions. Results emerge through an organised large-scale assessment and scoring design.
When using international data, students should understand the study’s method before treating scores as a school examination rank. The OECD’s technical reports and country notes provide that context.
19. Why OECD questionnaires matter
PISA also collected information about student experiences, attitudes, home and school life, with school principals answering questions about the learning environment. These responses help analysts investigate educational opportunities and challenges beyond direct test scores.
A student survey item is not a clinical diagnosis, and a self-reported attitude does not prove one causal explanation for academic outcomes. Responses can still be informative at population scale.
Teachers and parents should distinguish “students report feeling…” from “a psychological professional assessed…”. Accurate interpretation protects both evidence and the dignity of children represented in surveys.
20. School belonging is measurable but not universal
The OECD Singapore note reports that 78.1% of respondents felt they belonged at school, slightly higher than the OECD average of 76.2%. That leaves a meaningful group who did not report the same experience.
A national proportion cannot establish whether one child feels isolated. Families should ask students directly about friends, trusted adults and classroom participation and take specific concerns seriously.
A school can nurture belonging through respectful routines, fair group participation and appropriate peer support. Such work is an educational responsibility even when it does not change a headline test rank immediately.
21. Learning curiosity is another reported outcome
Some 73.1% of Singapore’s PISA respondents said they like learning new things at school, compared with an OECD average of 68.8%. Another 80.6% said they like knowing how things work.
These findings can inform discussions about inquiry and educational engagement, but they do not prove any one teaching programme caused the difference. Surveys measure stated responses in the assessed context.
Parents can nurture curiosity by welcoming questions and discussing how conclusions are reached. It is helpful to let a learner explore a genuine question without every conversation turning into tuition preparation.
22. Perseverance is more than finishing a worksheet
The PISA 2025 Singapore country data include self-reported perseverance, goal-setting and help-seeking. The purpose is to understand habits that can support learning and problem-solving in a changing world.
A child who seeks clarification after an unsuccessful attempt can demonstrate an important learning strategy. Persisting blindly with the same incorrect method is not necessarily productive perseverance.
A teacher can encourage pupils to inspect the failed step, change an approach and test an unfamiliar example. This gives persistence an educational purpose instead of celebrating time spent regardless of progress.
23. Computational problem-solving is a distinct measure
PISA 2025 introduced an assessment of Learning in the Digital World that included computational problem-solving and self-directed learning in a digital environment. The computational findings were released in September 2026, while separate analyses of self-directed learning were scheduled for 2027.
Digital problem-solving is not identical to typing speed or using an AI chatbot confidently. It can require modelling, logical reasoning, designing an approach and testing what a computational result means.
A secondary learner should understand the principles and constraints of a task. Owning a personal learning device does not automatically create digital competence.
24. Singapore performed strongly in digital problem-solving
The OECD places Singapore among the leading participating systems in computational problem-solving, alongside Macao and the participating Chinese regions. Its indicators show strong Singapore performance relative to international averages.
That result should not be converted into a claim that every fifteen-year-old can programme professionally or that all secondary schools teach identical advanced computing modules. The OECD test has specific tasks and reporting definitions.
Students who enjoy computing can explore suitable school courses and safe project activities while learning to explain their algorithms. The official national course availability remains a separate school-level matter.
25. Original coding-logic task: a moisture threshold
Imagine a fictional school project that signals “check the plant” whenever a moisture sensor returns a value below 30 under its defined scale. If the threshold is changed to 40, additional readings from 30 to 39 now trigger the message.
A pupil who says changing the threshold has no effect may not understand the comparison condition. The educator can write sample values and ask the learner to predict each output before testing the program.
For transfer, reverse the condition to trigger when readings are at or above a chosen value and ask for a fresh explanation. The task illustrates logic, not an instruction to connect sensors or water devices without supervision.
26. A successful chatbot answer still needs checking
Generative AI may produce fluent explanations that include a faulty calculation, imagined source or unsupported causal conclusion. A student should be able to check the evidence and reason through the task independently.
For instance, if a chatbot asserts that an average of three numbers proves each number is the same, the student can provide a counterexample such as 10, 20 and 30: the mean is 20 although the values differ.
Responsible digital literacy involves verifying important information, respecting privacy and recognising a tool’s limits. A polished machine-generated paragraph is not itself proof of student understanding.
27. The difference between PISA and TIMSS
TIMSS is an IEA international study focused on Mathematics and Science achievement at specific school grades, notably Primary 4 and Secondary 2 equivalents. PISA focuses on students around fifteen and the application of knowledge to problems.
Their scales, age groups, curriculum coverage and sampling designs differ. A TIMSS score of 615 and a PISA score of 563 cannot be compared by subtraction to claim a country’s performance worsened by 52 points.
This article concentrates on PISA 2025’s Science, digital skills and wellbeing. A separate eduKate mathematics guide addresses TIMSS 2023 mathematics and comparative results in greater depth.
28. The difference between PISA and PIRLS
PIRLS, run by the IEA, examines reading literacy in a grade-based primary cohort, most commonly Primary 4. Its reading constructs and score scale are distinct from PISA’s fifteen-year-old reading measures.
A Primary 4 school’s participation in a PIRLS assessment does not create a PSLE grade. Families should not ask their child for a PIRLS 2026 score as if it were a normal school report issued instantly in the same year.
The companion Punggol PIRLS article explains the current reading cycle. This guide addresses the newly released 2025 PISA system evidence, not the unfinished PIRLS result release.
29. Why scores from different tests cannot be averaged
Imagine fictional scores of 80% on a school Science assessment, AL3 at a different stage and 560 points on a national PISA scale. Their numerical values belong to different measurement systems.
Calculating (80 + 3 + 560)/3 does not have a meaningful educational interpretation. It combines a percentage, an ordinal achievement band and a scaled population score as though they shared units.
Before calculating, students should identify what each variable measures and whether combining them is justified. Dimensional analysis is not only a science skill; it is an essential habit in data literacy.
30. National rankings do not rank local Punggol schools
PISA’s Singapore results are estimates about the participating national population. A family cannot infer that a particular Punggol school ranked first internationally or that any named secondary campus deserves credit for the national mean alone.
Individual school admissions and learning quality require other evidence, including programme fit, subject offerings, student support, teacher feedback and authentic pupil progress. A competitive historical PSLE cutoff measures a different process from Science literacy.
Punggol parents should use PISA to frame the importance of reasoning, not as a substitute for examining the actual school their child attends.
31. A gap between groups needs careful interpretation
The OECD country note reports widening differences between the highest- and lowest-performing student groups. It also analyses relationships with socioeconomic background, illustrating that educational outcomes involve more than individual effort.
An association between background and performance does not mean every child from a particular household will attain a predictable score. Statistical patterns should encourage equitable support rather than stereotypes.
Teachers can identify real learning barriers such as unfamiliar academic language or missing prerequisite knowledge. Families can seek appropriate school help without waiting for a national study to label their child.
32. Grade progression and individual learning support
A fifteen-year-old may be studying at different subject levels under Singapore’s Full Subject-Based Banding framework, particularly near the 2027 SEC transition. Their classroom curriculum and assessed national examinations follow relevant G1, G2 or G3 arrangements.
PISA’s age-based study does not replace those syllabuses. A pupil who finds a G2 Science concept difficult needs targeted help with that content, not generic instructions to “raise the PISA score”.
A useful plan begins with the specific lesson outcome, authentic error and a changed problem to verify transfer. Broader international indicators cannot provide that diagnosis for one child.
33. The 2027 SEC has a different purpose
From 2027, the SEC records results in relevant secondary subjects at G1, G2 or G3 levels. It is a national qualification administered by SEAB, unlike an OECD sampled assessment used for international comparison.
The SEC’s subject codes, written papers, practical requirements and grading rules determine individual qualification outcomes. PISA provides system-level context about capabilities students can apply beyond traditional school tasks.
Parents should verify the actual SEC subject level required for future ITE, polytechnic or JC programmes. No PISA score can replace an official subject qualification for admission.
34. PSLE scores are not PISA predictions
The PSLE assesses primary-school pupils within Singapore’s national examination framework and reports Achievement Levels for Secondary 1 posting. PISA studies an older age group and uses different content and statistical methods.
A child scoring AL1 in Primary 6 Mathematics may continue developing well, but it does not mathematically guarantee any future PISA performance level. Interests, teaching and learning needs evolve in the intervening years.
Parents should support secure foundations and curiosity rather than attempt to predict a national international-assessment ranking from a single primary result.
35. School-level science enquiry can develop transfer
A meaningful Science lesson might ask students to compare two explanations, design a fair test and decide whether the observed results favour one explanation. The teacher can change the situation to see whether pupils still understand the underlying principle.
This connects national syllabus learning with the broader idea of scientific literacy measured by PISA. It does not require schools to abandon examinable content or teach protected OECD items.
Students benefit when they can explain unfamiliar evidence honestly. A polished copied response may perform poorly when the wording or experimental context changes.
36. An honest school project should report uncertainty
Suppose a fictional group measures a small improvement in classroom waste sorting over one week. They should report the number of observations, how categories were defined and whether conditions were comparable.
A claim that the activity permanently improved recycling habits across Punggol would require stronger evidence than one classroom week. Acknowledge limits while proposing a sensible follow-up.
This builds scientific judgement, source literacy and responsible citizenship. The project becomes educational because students understand what their findings do and do not support.
37. Parents can ask better questions about Science learning
Instead of asking only “How many marks did my child get?”, ask which idea was difficult, what evidence the learner used and whether the method works in a new context. A student who can explain why a fair test is fair has learned something useful beyond one worksheet.
If the child misunderstands a concept, request a representative example and discuss a narrow teaching goal. Do not immediately commission a large tuition programme because Singapore’s national score changed by a few scale points.
Individual learning is improved through precise feedback. Large-scale international comparisons serve a different purpose.
38. A four-week family scientific-literacy routine
Week 1: read one age-appropriate scientific claim and ask the child to distinguish observation, inference and fact-checkable evidence.
Week 2: discuss a safe hypothetical investigation, identifying its variable, measured outcome and controlled conditions. Avoid hazardous home experiments.
Week 3: examine a small fictional dataset and ask what the mean, sample size and limitations permit the learner to conclude. Try a new set of values.
Week 4: review one current school Science difficulty with the teacher’s guidance, correcting the specific reasoning step and testing an unfamiliar question. Protect adequate rest and curiosity.
39. A fictional Punggol secondary family reviewing PISA
Imagine a Secondary 3 student near Punggol Coast who enjoys technology but finds Science written explanations hard. Their parent reads that Singapore scored highly on PISA and assumes the pupil ought to be an advanced Science student automatically.
Instead, the teacher identifies that the learner knows the phenomenon but does not distinguish measured results from causal inference. The family practises concise evidence-led answers and checks new problems.
The national benchmark provides context but did not diagnose the child. The individual explanation and changed task show whether the student is learning more securely.
40. The role of language in science questions
A Science question may contain words such as “infer”, “control”, “evaluate” or “conclude”. A learner may understand a diagram while misunderstanding the written instruction. That is a real barrier even if the scientific concept is otherwise secure.
Ask the student to describe the task orally, then compare the explanation with the written response. If vocabulary is the issue, teach its meaning in scientific context rather than repeat unrelated calculations.
This also explains why Reading literacy matters to Science outcomes. The subjects remain distinct, but communication influences the ability to show knowledge accurately.
41. Why comparing girls and boys needs care
The OECD reports a negligible, statistically non-significant mean gender difference in Singapore’s PISA 2025 Science score. Differences appeared in other domains, but a population pattern cannot determine one boy’s or girl’s potential.
A family should not tell a daughter she is naturally less suited to a particular technical field or a son that he cannot enjoy literature. Educational support must follow individual interests and evidence.
Fair interpretation preserves the distinction between a national statistical estimate and the choices and abilities of particular children.
42. Self-reported school belonging deserves follow-up
A national survey can identify broad patterns in relationships and school experiences, but an individual pupil who feels excluded needs an appropriate school conversation rather than a spreadsheet comparison.
Ask who the child trusts, how ordinary disagreements are handled and whether there are repeated incidents requiring intervention. School counselling and peer support follow the institution’s actual procedures.
The 78.1% national belonging figure does not prove every Punggol child is comfortable. Using it responsibly means recognising both the positive majority and the need to listen to those whose experience differs.
43. A national mean cannot justify an admissions promise
An advertisement may quote Singapore’s international result and imply that joining one tuition centre guarantees similarly excellent grades. That is a misuse of population-level evidence. The OECD did not evaluate the individual commercial provider through this national country score.
Families should ask for real teaching methods, specific feedback and a way of checking unfamiliar tasks, rather than accept national statistics as proof of one tutor’s outcomes.
An institution’s ethical marketing should distinguish what it knows from what it hopes. Education decisions deserve specific, relevant evidence.
44. The strongest classroom lesson from PISA
PISA reminds educators to examine whether students can use knowledge outside a familiar worksheet pattern. A pupil may know a formula but need more practice deciding which information matters or interpreting the limitations of an experiment.
This does not mean abandoning national syllabuses or replacing every lesson with speculative real-world activities. Secure foundational teaching and thoughtful transfer complement each other.
The progression is consistent: identify an idea, explain it clearly, practise correctly and ask a changed question. That method helps children understand rather than merely remember.
45. Check the publication year before sharing an infographic
PISA 2025 results were released in September 2026. A colourful chart dated 2015 or 2022 may use earlier participants, scores and rankings. Reposting it as the latest national evidence would misinform readers.
Verify the cycle, domain, population and statistical source. If a number is from the Education GPS indicators, preserve its unit and context instead of converting it into an invented percentage.
Responsible information-sharing is itself part of the scientific and digital literacy that international assessments aim to describe. A small source check can prevent a large public misconception.
46. PISA is one source, not the whole education system
Singapore families navigate preschool, P1 registration, PSLE, Full SBB, SEC and post-secondary admission frameworks that PISA neither administers nor replaces. School wellbeing, CCA opportunities, learning supports and household logistics also matter to an individual pupil.
PISA helps compare broad outcomes and examine trends. It cannot choose an appropriate school, diagnose dyslexia or guarantee a university offer.
Readers should combine official MOE and SEAB information with teacher observations and the child’s actual interests and capabilities. That produces a more balanced education plan than treating an international rank as the answer to every question.
47. What to ask after reading the OECD report
Ask which subject strengths and gaps the report identifies nationally, whether a statement concerns test performance or questionnaire responses, and how the sample represents the cohort. Ask whether a numerical difference is described as statistically significant.
Then return to the child’s own learning. Which concept is secure? Which unfamiliar task caused difficulty? How is the school supporting it?
A credible parent decision moves from trustworthy context to individual evidence. It does not treat national data as a personal report card or a commercial endorsement.
48. The final Punggol parent takeaway
The September 2026 PISA release documents strong Singapore performance, particularly in reading and scientific literacy, while highlighting changing performance gaps and the importance of student engagement. It is evidence about the national system rather than any one estate or school.
Punggol parents can use the findings to value reasoning, honest evidence, safe digital exploration and supportive relationships. They should not try to produce a PISA score for an individual child who was never part of the sampled study.
Meaningful progress is shown when a learner can explain an idea, recognise an unsupported claim and adapt to unfamiliar problems with appropriate support.
Frequently asked questions
What is PISA?
The OECD Programme for International Student Assessment studying the knowledge and application skills of students around age fifteen.
When did the latest PISA results appear?
The PISA 2025 Volume I results were released on 8 September 2026.
What was Singapore’s PISA 2025 Science score?
560 scaled points, compared with 482 across OECD participants.
Did Singapore rank first in PISA 2025 Science?
No. It ranked second by mean Science score, behind B-S-J-Z (China).
What was Singapore’s Reading score?
535 scaled points, the highest mean Reading score in the participating systems.
What was Singapore’s Mathematics score?
563 scaled points, second in the international comparison.
Is a PISA score a percentage mark?
No. It is a scaled estimate under OECD’s international assessment framework.
How many students took PISA 2025 in Singapore?
The OECD country note identifies 6,551 students from 157 schools.
Did every Punggol secondary school sit PISA?
Do not infer that. The published national sample does not identify every local school’s participation.
Is PISA an examination leading to the 2027 SEC?
No. PISA is an international system study; the SEC is a national secondary qualification administered by SEAB.
How many Singapore students reached baseline Science proficiency?
About 90%, compared with approximately 74% on average across OECD participants.
How many reached the top two Science proficiency levels?
About 26%, compared with 7% on average across OECD participants.
Did performance improve in every subject since 2022?
No. The OECD reports declines in Singapore’s mean Reading and Mathematics outcomes and little change in Science.
Did Singapore’s achievement gaps widen?
The OECD notes widening differences between higher- and lower-performing students across Science, Mathematics and Reading.
What is the PISA Science major domain?
An emphasis on applying scientific knowledge, evaluating enquiry design and using scientific information to make decisions.
Does PISA measure computational problem-solving?
Yes. The 2025 cycle introduced Learning in the Digital World assessment components, with computational results released in 2026.
Are digital problem-solving and AI usage identical?
No. Using an AI tool is not equivalent to independently modelling, testing and evaluating a problem.
Does PISA diagnose an individual pupil’s learning needs?
No. Teachers and appropriate professionals assess individual work and needs.
How does PISA differ from TIMSS?
PISA is age-based and application-oriented, while TIMSS is a grade-based Mathematics and Science achievement study.
How does PISA differ from PIRLS?
PIRLS measures primary reading literacy at a grade-based level, with different sampling and score scales.
Can we average a TIMSS score and a PISA score?
No. They are different scaled measures for different populations and constructs.
What proportion of Singapore respondents felt they belonged at school?
The OECD country note reports 78.1%, compared with 76.2% across OECD participants.
Do national rankings guarantee an individual school’s quality?
No. Schools need to be evaluated through their actual curriculum, supports, student experience and other relevant evidence.
What original tasks help develop Science literacy?
Fair-test design, observation-versus-inference, transparent data interpretation and explaining limitations on unfamiliar examples.
Should parents buy PISA-specific tuition for Primary 1?
No such national requirement follows from PISA, which assesses fifteen-year-olds. Focus on the child’s current curriculum and foundations.
What should a Punggol family do first with PISA data?
Read the dated OECD Singapore country note, understand what it measures, then discuss the child’s actual learning goals with their school.
Official OECD sources and related Punggol articles
- OECD PISA 2025 Singapore country note, released 8 September 2026
- OECD Education GPS Singapore PISA 2025 score and wellbeing indicators
- OECD PISA 2025 Volume I international comparisons
- OECD PISA 2025 Executive Summary
- OECD PISA Education GPS country reports
- MOE Secondary Full Subject-Based Banding
- SEAB Singapore-Cambridge SEC 2027
- Punggol Mathematics TIMSS 2023 and PISA 2025 comparison
- Punggol 2026 PIRLS Primary 4 Reading assessment
- Punggol secondary Full SBB and SEC 2027
- Punggol classroom assessment and marking guide
- Punggol Student Wellbeing and Cyber Wellness Guide
- Immutable Clementi Mathematics concept-first teaching reference
Editorial review — 23 October 2026. The science, mathematics, reading and student-experience data are grounded in OECD PISA 2025 publications dated 8 September 2026. Worked plant, data, programming and family examples are invented teaching cases. A PISA country result is not an admission, clinical or school-quality determination.


