
Quick answer. The latest OECD PISA Mathematics results, published on 8 September 2026 for PISA 2025, place Singapore second among participating education systems with a mean score of 563, behind B-S-J-Z (China) at 612 and above the OECD average of 463. The latest regular IEA TIMSS cycle, TIMSS 2023, places Singapore first in Grade 4 Mathematics at 615 and Grade 8 Mathematics at 605. These are international sample-based achievement-scale results, not school exam percentages, and they do not rank individual Punggol schools or predict a child’s PSLE Achievement Level.
This guide explains what parents and pupils can correctly learn from Singapore’s Mathematics results: who was assessed, why PISA and TIMSS are different, how average, proficiency, ranking, confidence, change and equity should be interpreted, and why a strong system average can coexist with individual conceptual gaps. Every worked numerical example below is an original teaching illustration; only the explicitly sourced report figures are presented as official international results.
Verified 21 October 2026. PISA 2025 was released by the OECD in September 2026, so citing PISA 2022 as the newest published cycle would be out of date. TIMSS 2023 results were released in 2024. Sources include the OECD country report and IEA TIMSS 2023 results, with a separate reference to MOE’s Mathematics syllabus. Do not convert any national result into invented Punggol school statistics.
The national Mathematics figures in one minute
- PISA 2025 Mathematics: Singapore 563, second among participating systems, OECD mean 463; released 8 September 2026.
- PISA 2025 top Mathematics system: B-S-J-Z (China) 612.
- PISA Mathematics 2022: Singapore 575, compared with 563 in 2025.
- TIMSS 2023 Grade 4 Mathematics: Singapore 615, first.
- TIMSS 2023 Grade 8 Mathematics: Singapore 605, first.
- Ages: PISA samples age 15; TIMSS assesses fourth and eighth grades.
- Reading caution: TIMSS and PISA scores are different scales and samples, not PSLE ALs or SEC G-levels.
- Parent action: use international data for context, pupil work for an actual learning diagnosis.
Jump to the statistical concept or interpretation
- 1. The latest PISA Mathematics result is from 2025
- 2. PISA assesses 15-year-olds, not Primary 4 pupils
- 3. PISA 2025 was science-focused but reports Mathematics
- 4. The latest TIMSS data is from the 2023 cycle
- 5. Singapore led TIMSS 2023 at Grade 4 Mathematics
- 6. Singapore also led TIMSS Grade 8 Mathematics
- 7. TIMSS Grade 4 and Grade 8 are different samples
- 8. PISA and TIMSS are not scored on one interchangeable scale
- 9. PISA 2022 to 2025 shows a lower Mathematics average
- 10. The OECD average also changed
- 11. A national average hides variation among pupils
- 12. The PISA 2025 performance gap widened
- 13. Low performers and high performers should both be visible
- 14. Being top performing is different from being perfect
- 15. PISA outcomes are not PSLE Achievement Levels
- 16. A rank is an ordering, not a measure of distance
- 17. Uncertainty matters when country means are close
- 18. The TIMSS centrepoint is not a passing grade
- 19. A representative sample is not every child
- 20. Sampling weights are not optional decorations
- 21. Statistical significance differs from practical importance
- 22. Causal claims need more evidence than a score table
- 23. MOE Mathematics is about problem-solving, not rank chasing
- 24. Graph literacy is part of reading the studies
- 25. Percentages and percentage-point changes differ
- 26. Gender averages should not turn into expectations for a child
- 27. Equity matters even with high overall performance
- 28. An individual error log is better than country-rank anxiety
- 29. A school choice requires local evidence, not TIMSS rankings
- 30. Teacher support and parent confidence are not measured by one ranking
- 31. The PISA 2025 digital problem-solving domain is a separate measure
- 32. The right follow-up to a national report is an honest question
- 33. A six-week reader’s route from national scores to local learning
Why rank headlines are not a complete education guide
An international result is a scientific estimate about education systems. It is not a direct classroom observation for every student. The teaching goal is therefore statistical literacy: define the population, read the scale, understand a distribution, examine uncertainty and avoid unsupported causes. The same mathematical habits make a parent better at reading a child’s school report. A strong education system does not require every child to be identical; appropriate targeted instruction should respond to strengths and specific misconceptions.
1. The latest PISA Mathematics result is from 2025
What the official data or mathematical concept means. The OECD released its PISA 2025 results on 8 September 2026. Singapore scored 563 in Mathematics, ranking second among participating systems behind B-S-J-Z (China), which scored 612. The OECD average was 463. This is more recent than the previously published PISA 2022 Mathematics result, and any 2026 article describing 2022 as the latest cycle is outdated.
Original worked interpretation. Comparing Singapore’s 563 with the OECD average of 463 gives a difference of 100 PISA scale points. These are points on a constructed proficiency scale, not 100 percentage points on a school exam. A valid conclusion must keep the study, population, units and year attached to any reported number.
Misreading to avoid. A family hears ‘563’ and assumes that an individual pupil scored 563 out of 600 or that Singapore’s children averaged 93.8% on a national paper. A plausible-looking calculation can still answer an invalid comparison when scales or reference populations differ.
Reader or teaching check. Label the study year, publication date, assessed age group and score scale. Open the OECD Singapore country note and distinguish national averages from personal school results. Before repeating the result, verify the source and ask for a changed synthetic example that tests the same statistical principle.
2. PISA assesses 15-year-olds, not Primary 4 pupils
What the official data or mathematical concept means. PISA, the Programme for International Student Assessment, samples 15-year-old students and examines their capacity to apply knowledge and solve problems. Its purpose differs from MOE’s topic-based school assessment and from the PSLE. The test includes Mathematics, reading, science and other domains depending on the cycle.
Original worked interpretation. A fictional 15-year-old interprets two travel routes from a small table, compares total distance and selects a suitable mathematical representation. Such applied reasoning is part of the PISA intent even when the numbers are not difficult. A valid conclusion must keep the study, population, units and year attached to any reported number.
Misreading to avoid. A parent uses a PISA average as a prediction of the child’s Primary 6 Achievement Level, ignoring the difference in age, content and statistical design. A plausible-looking calculation can still answer an invalid comparison when scales or reference populations differ.
Reader or teaching check. Read the OECD description of PISA’s target population and domains before comparing it with a national curriculum or an individual school exam. Before repeating the result, verify the source and ask for a changed synthetic example that tests the same statistical principle.
3. PISA 2025 was science-focused but reports Mathematics
What the official data or mathematical concept means. The OECD PISA 2025 cycle had science as its major domain, while Mathematics and reading still appear in its performance results. A main-domain shift changes the detail of what was emphasised, so readers should not assume every cycle gives the same assessment emphasis. PISA 2022 had Mathematics as a major domain.
Original worked interpretation. A researcher comparing 2022 and 2025 should read which instruments and trend methodology support the comparison, rather than treating two scores as identical classroom tests repeated with the same questions. A valid conclusion must keep the study, population, units and year attached to any reported number.
Misreading to avoid. A reader assumes ‘PISA 2025 science major domain’ means the 563 Mathematics result cannot exist, or that PISA 2025 was only a science test. A plausible-looking calculation can still answer an invalid comparison when scales or reference populations differ.
Reader or teaching check. Use the OECD 2025 Volume I report and country note, stating clearly which domain was the major focus and which subjects were still assessed. Before repeating the result, verify the source and ask for a changed synthetic example that tests the same statistical principle.
4. The latest TIMSS data is from the 2023 cycle
What the official data or mathematical concept means. TIMSS is IEA’s Trends in International Mathematics and Science Study, designed around mathematics and science curricula at fourth and eighth grades. Its latest regular international cycle currently available is TIMSS 2023, with results published in 2024. It differs in age and design from PISA.
Original worked interpretation. A Punggol Primary 4 pupil’s grade broadly corresponds to TIMSS Grade 4, while a Secondary 2 pupil’s stage corresponds to Grade 8. That correspondence does not mean their own school necessarily participated. A valid conclusion must keep the study, population, units and year attached to any reported number.
Misreading to avoid. Some websites incorrectly call TIMSS 2023 a 2023 publication or equate its sampling with Singapore’s PSLE cohort. A plausible-looking calculation can still answer an invalid comparison when scales or reference populations differ.
Reader or teaching check. Record assessment year 2023, results-release year 2024 and the two assessed grades. Use IEA or an official education-authority report for precise data. Before repeating the result, verify the source and ask for a changed synthetic example that tests the same statistical principle.
5. Singapore led TIMSS 2023 at Grade 4 Mathematics
What the official data or mathematical concept means. In TIMSS 2023, Singapore’s Grade 4 Mathematics average was 615 points, the highest reported national/economy mean in the study. The next reported Chinese Taipei average was 607. The TIMSS scale uses a fixed international centrepoint of 500 rather than treating every point as an ordinary exam mark.
Original worked interpretation. The numerical difference 615−607=8 scale points describes reported means, not an eight-mark difference on the same school test. Statistical comparisons require uncertainty information rather than only the ranking. A valid conclusion must keep the study, population, units and year attached to any reported number.
Misreading to avoid. A parent claims all Singapore Primary 4 children scored at least 615 or that the score establishes the exact standing of a named Punggol school. A plausible-looking calculation can still answer an invalid comparison when scales or reference populations differ.
Reader or teaching check. Use IEA’s TIMSS 2023 national results and distinguish average, sample, rank and significance. Avoid claiming any school’s unpublished mean. Before repeating the result, verify the source and ask for a changed synthetic example that tests the same statistical principle.
6. Singapore also led TIMSS Grade 8 Mathematics
What the official data or mathematical concept means. At Grade 8, corresponding broadly to Singapore Secondary 2, Singapore’s TIMSS 2023 Mathematics average was 605. The IEA results placed Singapore first on the reported mean, with Chinese Taipei at 602. These values refer to the Grade 8 scale and sample, not to the same children assessed at Grade 4 in 2023.
Original worked interpretation. A reported three-point difference between 605 and 602 is a comparison of aggregate means. It should not be presented as certainty that every student in one system outperformed peers in the other. A valid conclusion must keep the study, population, units and year attached to any reported number.
Misreading to avoid. A tuition advertisement treats Grade 8 605 as an individual pass mark or calculates a school-level ranking by borrowing the national number. A plausible-looking calculation can still answer an invalid comparison when scales or reference populations differ.
Reader or teaching check. Name the grade, scale and sampling population whenever reporting the result. Avoid unsupported individual, classroom or local-neighbourhood interpretations. Before repeating the result, verify the source and ask for a changed synthetic example that tests the same statistical principle.
7. TIMSS Grade 4 and Grade 8 are different samples
What the official data or mathematical concept means. The two TIMSS grades represent different student populations at different stages. Their national means cannot be subtracted as proof that one cohort ‘lost ten points’ while progressing through school, because the results are not a within-student longitudinal score change.
Original worked interpretation. The arithmetic 615−605=10 is correct but does not estimate the growth of a particular child from Primary 4 to Secondary 2. The studies assessed distinct grades and their achievement scales must be interpreted appropriately. A valid conclusion must keep the study, population, units and year attached to any reported number.
Misreading to avoid. A parent reads the two headline values and declares that Singapore Mathematics learning gets ten points worse in four school years. A plausible-looking calculation can still answer an invalid comparison when scales or reference populations differ.
Reader or teaching check. Use a genuinely longitudinal design or relevant trend scales before discussing individual growth. For a single child, compare their own concept mastery and appropriate school evidence. Before repeating the result, verify the source and ask for a changed synthetic example that tests the same statistical principle.
8. PISA and TIMSS are not scored on one interchangeable scale
What the official data or mathematical concept means. Although both studies use mathematical proficiency scales, their domains, ages, item sampling, scaling and reference populations differ. A TIMSS score of 615 cannot be compared directly with a PISA score of 563 to infer a 52-point decline in Singapore Mathematics knowledge.
Original worked interpretation. Calculating 615−563=52 is arithmetically possible, but the result has no valid interpretation as a national learning decline across these two separate studies. A valid conclusion must keep the study, population, units and year attached to any reported number.
Misreading to avoid. The reader treats every education score as if it came from the same hundred-mark Mathematics paper. A plausible-looking calculation can still answer an invalid comparison when scales or reference populations differ.
Reader or teaching check. Place the study name, grade, scale and assessment purpose beside each number in a comparison table and only compare like with like when supported. Before repeating the result, verify the source and ask for a changed synthetic example that tests the same statistical principle.
9. PISA 2022 to 2025 shows a lower Mathematics average
What the official data or mathematical concept means. Singapore’s PISA Mathematics average was 575 in 2022 and 563 in 2025, a reported difference of 12 scale points. The OECD country note says the 2025 Mathematics result was lower than in 2022. That observation should be read with the OECD’s trend and sampling analysis rather than turned into a claim about every individual student.
Original worked interpretation. Subtracting 575−563 gives 12. That is a difference in country/economy mean PISA points over time, not a 12% decline and not evidence that any particular pupil lost twelve school marks. A valid conclusion must keep the study, population, units and year attached to any reported number.
Misreading to avoid. A parent announces that one Secondary 3 child is necessarily weaker than a Secondary 3 pupil three years earlier because of a population average trend. A plausible-looking calculation can still answer an invalid comparison when scales or reference populations differ.
Reader or teaching check. State the years and official finding accurately, then return to actual pupil learning evidence and the national curriculum rather than turning the macro trend into a personal prediction. Before repeating the result, verify the source and ask for a changed synthetic example that tests the same statistical principle.
10. The OECD average also changed
What the official data or mathematical concept means. PISA Mathematics average across OECD countries was 472 in 2022 and 463 in 2025. Its decline of nine scale points shows that Singapore’s trajectory occurred in a broader pattern. This context can inform policy-level discussion but should not erase specific strengths and weaknesses within Singapore.
Original worked interpretation. Singapore’s 563 in 2025 exceeds the OECD 463 average by 100. The 2022 gap of 575−472 was 103 points. Comparing gaps is different from comparing ranks, and neither determines an individual’s AL. A valid conclusion must keep the study, population, units and year attached to any reported number.
Misreading to avoid. A reader says Singapore lost its entire advantage because its average fell, without looking at the change in reference systems or the actual gap. A plausible-looking calculation can still answer an invalid comparison when scales or reference populations differ.
Reader or teaching check. Use consistent years and scale units. Distinguish national trend, OECD trend and the rank among participating education systems. Before repeating the result, verify the source and ask for a changed synthetic example that tests the same statistical principle.
11. A national average hides variation among pupils
What the official data or mathematical concept means. An average summarises one aspect of a score distribution. Two populations with equal means can have very different amounts of variation and very different numbers of learners near proficiency thresholds. A parent seeking help for one child needs more detailed learning evidence.
Original worked interpretation. Five fictional Maths scores 4,4,6,6,10 average six, while five scores 6,6,6,6,6 also average six. The first set includes wide variation that the identical average conceals. A valid conclusion must keep the study, population, units and year attached to any reported number.
Misreading to avoid. A tutor says the national mean proves every child receives the same high level of mastery. A plausible-looking calculation can still answer an invalid comparison when scales or reference populations differ.
Reader or teaching check. Ask about distribution, percentiles and proficiency levels in addition to means. For a child, inspect original work and independent changed problems. Before repeating the result, verify the source and ask for a changed synthetic example that tests the same statistical principle.
12. The PISA 2025 performance gap widened
What the official data or mathematical concept means. The OECD Singapore 2025 country note reports that the gap between students in the top and bottom tenth of the score distribution widened in Mathematics, reading and science between 2022 and 2025. Singapore can therefore have a high overall mean while still facing equity and support challenges. Both observations matter.
Original worked interpretation. A small fictional class has ten scores ranging from 40 to 95, while another ranges from 65 to 85. Similar averages could conceal very different top–bottom gaps and corresponding support needs. A valid conclusion must keep the study, population, units and year attached to any reported number.
Misreading to avoid. A parent interprets ‘ranked second’ as evidence there can be no students in Singapore needing Mathematics learning support. A plausible-looking calculation can still answer an invalid comparison when scales or reference populations differ.
Reader or teaching check. Read both average and dispersion findings. Use school-supported targeted intervention when a learner has a persistent conceptual gap, rather than assuming a rank guarantees mastery. Before repeating the result, verify the source and ask for a changed synthetic example that tests the same statistical principle.
13. Low performers and high performers should both be visible
What the official data or mathematical concept means. The OECD’s 2025 Singapore note reports that about 89% of Singapore’s 15-year-olds attained at least Level 2 in Mathematics, while more than a third reached top Level 5 or 6. These are proficiency categories in PISA, not subject levels G1/G2/G3 under Full SBB.
Original worked interpretation. If 89% in a hypothetical sample of 1,000 met a criterion, 890 would meet it and 110 would not. The actual PISA statistic is derived from a representative sample and statistical weighting, not a simple census of exactly 1,000. A valid conclusion must keep the study, population, units and year attached to any reported number.
Misreading to avoid. A reader interprets PISA Level 2 as G2 Mathematics or PISA Level 6 as the same thing as Singapore PSLE AL6. A plausible-looking calculation can still answer an invalid comparison when scales or reference populations differ.
Reader or teaching check. Write the exact framework beside the level. PISA proficiency categories, PSLE ALs and SEC G-levels are different instruments and cannot be swapped. Before repeating the result, verify the source and ask for a changed synthetic example that tests the same statistical principle.
14. Being top performing is different from being perfect
What the official data or mathematical concept means. The OECD’s 2025 PISA Mathematics statistics put Singapore’s share of top performers at around 37% at Levels 5 or 6, considerably above many international averages. That is a proportion of assessed pupils within a defined framework, not a claim that the other students are failures.
Original worked interpretation. Even if a third of a population reach a high threshold, that says nothing on its own about one particular pupil’s need for support with fractions or graphs. A valid conclusion must keep the study, population, units and year attached to any reported number.
Misreading to avoid. A school article turns a national high-performer share into a test that every child should reach the same category immediately. A plausible-looking calculation can still answer an invalid comparison when scales or reference populations differ.
Reader or teaching check. Use the published proficiency descriptions and avoid labels for individuals without their own evidence. Encourage depth and support at suitable levels. Before repeating the result, verify the source and ask for a changed synthetic example that tests the same statistical principle.
15. PISA outcomes are not PSLE Achievement Levels
What the official data or mathematical concept means. PSLE Standard Mathematics uses AL bands for a national Primary 6 examination. PISA uses a different age cohort, proficiency scale and sampling design. A country ranking or score does not directly predict a child’s AL or Secondary school posting.
Original worked interpretation. A P6 learner receives AL3 in a PSLE-related school assessment context. That label should be interpreted under MOE’s AL rules, not by dividing PISA 563 by an arbitrary denominator. A valid conclusion must keep the study, population, units and year attached to any reported number.
Misreading to avoid. A parent tries to convert a PISA country mean into AL1 through AL8 with an invented formula. A plausible-looking calculation can still answer an invalid comparison when scales or reference populations differ.
Reader or teaching check. Refer to MOE/SEAB scoring rules for an individual national exam and use PISA only for correctly stated system-level context. Before repeating the result, verify the source and ask for a changed synthetic example that tests the same statistical principle.
16. A rank is an ordering, not a measure of distance
What the official data or mathematical concept means. Rank one or two identifies a position among reported means. It does not tell how large the differences are, whether they are statistically distinguishable or whether every school in one system outranks another. Rankings can also change when the participant set changes.
Original worked interpretation. Three hypothetical education systems have averages 600,599 and 520. Their ranks are one, two and three, but the first-second gap is one while the second-third gap is 79. A valid conclusion must keep the study, population, units and year attached to any reported number.
Misreading to avoid. A reader assumes each difference of one rank corresponds to an equal fixed difference in mathematical skill. A plausible-looking calculation can still answer an invalid comparison when scales or reference populations differ.
Reader or teaching check. Present the actual scale points and uncertainty information alongside ranks. Do not convert rank into a universal ‘years ahead’ claim. Before repeating the result, verify the source and ask for a changed synthetic example that tests the same statistical principle.
17. Uncertainty matters when country means are close
What the official data or mathematical concept means. International sample surveys estimate averages from selected students. The estimates have sampling and measurement uncertainty, so a difference between two rounded means may not necessarily indicate a statistically significant difference. Official reports mark such comparisons rather than leaving readers to infer certainty.
Original worked interpretation. Imagine two independent estimates 605 and 602 with illustrative standard errors of three points each. The standard error of their difference would be about √(3²+3²)=4.24. A three-point gap would be small relative to that illustration. A valid conclusion must keep the study, population, units and year attached to any reported number.
Misreading to avoid. A parent sees a three-point TIMSS gap and declares it unquestionably large without consulting actual confidence intervals and sampling design. A plausible-looking calculation can still answer an invalid comparison when scales or reference populations differ.
Reader or teaching check. Use the official tables and significance footnotes. Do not substitute this hypothetical standard-error example for the studies’ actual uncertainty estimates. Before repeating the result, verify the source and ask for a changed synthetic example that tests the same statistical principle.
18. The TIMSS centrepoint is not a passing grade
What the official data or mathematical concept means. TIMSS uses a fixed scale centrepoint of 500 established for international trend reporting. The centrepoint helps interpret system-level achievement over multiple cycles; it is not a cutoff for passing a subject or an individual standardised test.
Original worked interpretation. Singapore Grade 4 615 lies 115 scale points above the centrepoint. That does not mean the students achieved 115% or passed a paper with 615 available marks. A valid conclusion must keep the study, population, units and year attached to any reported number.
Misreading to avoid. The learner sees ‘500’ and assumes everything below it is a failure or that a score of 615 is out of 1,000 raw test items. A plausible-looking calculation can still answer an invalid comparison when scales or reference populations differ.
Reader or teaching check. Read IEA methodology about the fixed achievement scale. Distinguish the statistical reference from curriculum pass criteria. Before repeating the result, verify the source and ask for a changed synthetic example that tests the same statistical principle.
19. A representative sample is not every child
What the official data or mathematical concept means. Large-scale studies use sample designs to infer results for defined student populations. Sampling weights and school/student selection matter, as does coverage of the target population. A national result must not be mistaken for a direct observation of a named pupil.
Original worked interpretation. A fictional study samples 100 pupils from a population of ten thousand. An average from the sample is an estimate under its design, not a record of every individual score. A valid conclusion must keep the study, population, units and year attached to any reported number.
Misreading to avoid. A website claims that because PISA reported a national mean it has measured the personal ability of every Singapore fifteen-year-old. A plausible-looking calculation can still answer an invalid comparison when scales or reference populations differ.
Reader or teaching check. Check sampling and weighting documentation and use careful phrasing such as ‘Singapore’s participating population estimate’ rather than inventing individual records. Before repeating the result, verify the source and ask for a changed synthetic example that tests the same statistical principle.
20. Sampling weights are not optional decorations
What the official data or mathematical concept means. If some groups are sampled at different rates, analysis may use weights so their contribution represents the target population. A simple arithmetic mean of raw sampled scores can differ from a properly weighted national estimate. Researchers should not recreate an official result without its methodology.
Original worked interpretation. Suppose one sampled student represents ten population students and scores 80, while another represents thirty and scores 60. Weighted mean is (10×80+30×60)/(10+30)=65, not the unweighted average seventy. A valid conclusion must keep the study, population, units and year attached to any reported number.
Misreading to avoid. A student averages the two scores without considering that they represent unequal numbers of people. A plausible-looking calculation can still answer an invalid comparison when scales or reference populations differ.
Reader or teaching check. Use a weighted-mean table and explain the population each observation represents. Follow official IEA/OECD released datasets and survey design documentation for actual research. Before repeating the result, verify the source and ask for a changed synthetic example that tests the same statistical principle.
21. Statistical significance differs from practical importance
What the official data or mathematical concept means. A detectable population-level score difference need not be large in educational terms, and a potentially important difference may be estimated imprecisely in a small sample. Sound interpretation considers magnitude, uncertainty, cohort and curriculum context together.
Original worked interpretation. With a massive dataset, a difference of one scale point might be statistically detectable but small as a practical teaching issue. With a tiny sample, a ten-point difference might have wide uncertainty. Neither conclusion follows from the difference alone. A valid conclusion must keep the study, population, units and year attached to any reported number.
Misreading to avoid. A parent interprets every statistically significant result as a huge educational gap, or every nonsignificant result as proof that no difference exists. A plausible-looking calculation can still answer an invalid comparison when scales or reference populations differ.
Reader or teaching check. Report effect size and statistical uncertainty separately and explain what decision or intervention the comparison is intended to inform. Before repeating the result, verify the source and ask for a changed synthetic example that tests the same statistical principle.
22. Causal claims need more evidence than a score table
What the official data or mathematical concept means. International studies describe achievement and student contexts. They can inform research but do not establish that one single textbook, after-school programme or tutoring technique caused a country’s rank. Many factors can influence observed performance.
Original worked interpretation. A country uses bar models and has high assessment scores. That association alone cannot prove bar models are the only or sufficient reason for the high score. A valid conclusion must keep the study, population, units and year attached to any reported number.
Misreading to avoid. A tutoring website promises to replicate Singapore’s national rank for one pupil by copying a single branded worksheet routine. A plausible-looking calculation can still answer an invalid comparison when scales or reference populations differ.
Reader or teaching check. Look for intervention studies or credible causal designs before making causal claims. Describe plausible mechanisms without presenting them as proven sole explanations. Before repeating the result, verify the source and ask for a changed synthetic example that tests the same statistical principle.
23. MOE Mathematics is about problem-solving, not rank chasing
What the official data or mathematical concept means. MOE’s mathematics framework centres problem solving with concepts, skills, processes, metacognition and attitudes. International results are useful context for evaluating a system, but a learner’s day-to-day progress depends on understanding numbers, relationships, units, representations and checking.
Original worked interpretation. A child calculating 30÷5=6 should also know whether six represents groups or objects per group in the stated story. A correct numeric answer with the wrong noun reveals an interpretation gap. A valid conclusion must keep the study, population, units and year attached to any reported number.
Misreading to avoid. A parent believes more worksheets and higher speed automatically cause national-rank-level mathematical expertise. A plausible-looking calculation can still answer an invalid comparison when scales or reference populations differ.
Reader or teaching check. Ask for an original explanation and a changed independent example. Record concept, modelling, computation and checking as distinct skills. Before repeating the result, verify the source and ask for a changed synthetic example that tests the same statistical principle.
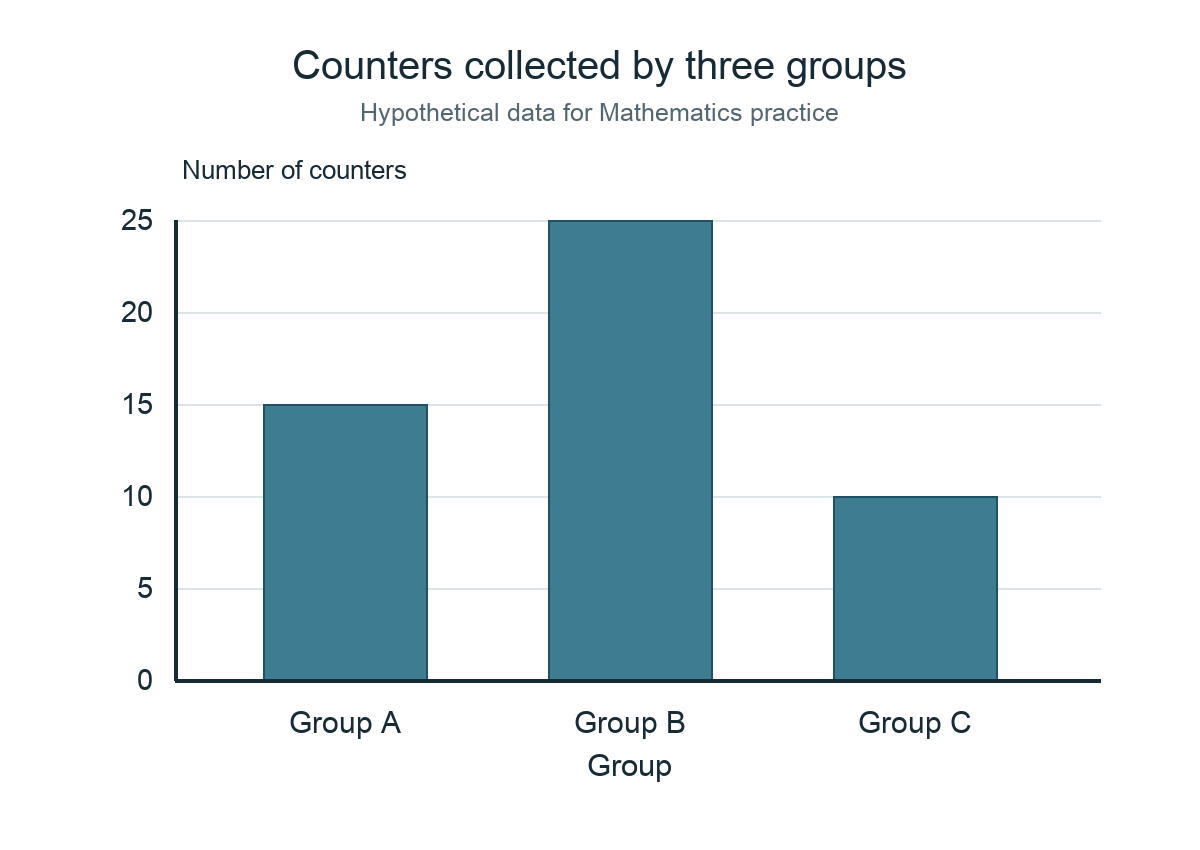
24. Graph literacy is part of reading the studies
What the official data or mathematical concept means. International assessment reports contain charts with scales, axes, confidence intervals and subgroup distributions. Readers need ordinary school Mathematics to interpret them correctly. A dramatic bar chart can mislead if its baseline or reference group is hidden.
Original worked interpretation. A graph shows averages 563 and 575 on an axis beginning at 550; the visual gap may seem large relative to the displayed range, but its numeric difference remains twelve PISA scale points. A valid conclusion must keep the study, population, units and year attached to any reported number.
Misreading to avoid. A child or parent says a taller bar is twice as high without checking that the axis starts above zero. A plausible-looking calculation can still answer an invalid comparison when scales or reference populations differ.
Reader or teaching check. Read the title, unit, axis and source before making a proportional comparison. Reconstruct the numbers in a table. Before repeating the result, verify the source and ask for a changed synthetic example that tests the same statistical principle.
25. Percentages and percentage-point changes differ
What the official data or mathematical concept means. A rise from 10% to 15% represents five percentage points and a fifty-percent relative increase. These statements answer different questions and cannot be interchanged. International reports often use percentage points for changes in population shares.
Original worked interpretation. If a fictional proficiency group rises from 20% to 25%, the change is five percentage points; the relative change is 5/20=25%. Neither should be reported simply as ‘up five percent’ without meaning. A valid conclusion must keep the study, population, units and year attached to any reported number.
Misreading to avoid. A writer labels a five-percentage-point difference as a 5% relative increase, understating or misrepresenting the comparison. A plausible-looking calculation can still answer an invalid comparison when scales or reference populations differ.
Reader or teaching check. Name the denominator and starting share before calculating. Write both measures when they add value and label them explicitly. Before repeating the result, verify the source and ask for a changed synthetic example that tests the same statistical principle.
26. Gender averages should not turn into expectations for a child
What the official data or mathematical concept means. PISA 2025 reports subgroup statistics, including boys’ and girls’ mean Mathematics outcomes. Aggregated differences do not establish a child’s potential or justify a stereotype. Within-group variation can be much larger than a gap between subgroup averages.
Original worked interpretation. Two hypothetical groups have means 60 and 62, but individual scores in both may range from 30 to 95. An individual’s need for fraction support must be diagnosed from their work, not the group average. A valid conclusion must keep the study, population, units and year attached to any reported number.
Misreading to avoid. A parent predicts mathematical ability solely from a child’s gender after seeing a national chart. A plausible-looking calculation can still answer an invalid comparison when scales or reference populations differ.
Reader or teaching check. Use subgroup results only for responsible system-level discussion and preserve access to suitable teaching for every student. Before repeating the result, verify the source and ask for a changed synthetic example that tests the same statistical principle.
27. Equity matters even with high overall performance
What the official data or mathematical concept means. A country can achieve a high average while some learners need more foundational support. The OECD Singapore note emphasises high overall proficiency and a widening top-bottom gap, which suggests that aggregate success and differentiated teaching should be discussed together.
Original worked interpretation. A fictional school has students who need number-line support and peers ready to explore probability. Both can make progress through suitable tasks; forcing identical worksheet difficulty may leave one group unsupported. A valid conclusion must keep the study, population, units and year attached to any reported number.
Misreading to avoid. A reader treats national excellence as evidence that a child struggling with Mathematics must be unwilling to learn. A plausible-looking calculation can still answer an invalid comparison when scales or reference populations differ.
Reader or teaching check. Identify a specific misconception, use school support or qualified tutoring appropriately and evaluate delayed transfer without stigmatising the student. Before repeating the result, verify the source and ask for a changed synthetic example that tests the same statistical principle.
28. An individual error log is better than country-rank anxiety
What the official data or mathematical concept means. A small personal record of first wrong steps and independent reattempts gives actionable information. A national sample average cannot tell a parent whether their child misapplied a negative sign, lost a fraction reference whole or misread a graph scale.
Original worked interpretation. A pupil says 0.35>0.4 because 35>4. The conceptual repair is to express 0.4 as forty hundredths, larger than thirty-five hundredths. Recheck with 0.6 and 0.57 several days later. A valid conclusion must keep the study, population, units and year attached to any reported number.
Misreading to avoid. A parent interprets the national PISA result as a demand for the child to achieve a particular rank in every school test. A plausible-looking calculation can still answer an invalid comparison when scales or reference populations differ.
Reader or teaching check. Record the date, original task, precise misconception, correction and a delayed independent variation; align it to the child’s syllabus. Before repeating the result, verify the source and ask for a changed synthetic example that tests the same statistical principle.
29. A school choice requires local evidence, not TIMSS rankings
What the official data or mathematical concept means. No TIMSS or PISA national average establishes the outcomes of a named Punggol primary or secondary school. School selection should consider MOE-published offerings, admissions rules, the child’s needs, commute and current programme fit. Any official school-specific results must be sourced separately.
Original worked interpretation. A Punggol family compares two schools’ actual Mathematics offerings and support arrangements without assigning either an invented ‘PISA score’. The country’s 563 score applies to the participating national population. A valid conclusion must keep the study, population, units and year attached to any reported number.
Misreading to avoid. A business website copies Singapore’s top TIMSS rank beside one school name, implying that school itself was assessed and ranked first. A plausible-looking calculation can still answer an invalid comparison when scales or reference populations differ.
Reader or teaching check. Use MOE SchoolFinder and school notices for local choices; present national study statistics only as national results with explicit limits. Before repeating the result, verify the source and ask for a changed synthetic example that tests the same statistical principle.
30. Teacher support and parent confidence are not measured by one ranking
What the official data or mathematical concept means. The OECD and IEA gather contextual information about student learning conditions, but a country’s mean score cannot fully describe any student’s motivation, wellbeing or classroom experience. Strong instruction involves feedback, conceptual clarity and appropriate challenge.
Original worked interpretation. A child who successfully explains the difference between area and perimeter after a teacher’s intervention has made meaningful progress, regardless of whether a national rank changed this year. A valid conclusion must keep the study, population, units and year attached to any reported number.
Misreading to avoid. A parent pressures a pupil with a league-table headline rather than addressing a specific conceptual difficulty. A plausible-looking calculation can still answer an invalid comparison when scales or reference populations differ.
Reader or teaching check. Discuss a real example of the child’s progress with their teacher and agree on a short, sustainable next action. Before repeating the result, verify the source and ask for a changed synthetic example that tests the same statistical principle.
31. The PISA 2025 digital problem-solving domain is a separate measure
What the official data or mathematical concept means. PISA 2025 reports computational problem solving as a distinct assessment domain about navigating digital environments and using computational thinking to solve problems. Singapore performed strongly, but its score is not the same metric as Mathematics, even when numbers are similar.
Original worked interpretation. A student comparing alternative digital routes may need to plan actions, test constraints and interpret information. That differs from calculating a simple numerical average, even though both require reasoning. A valid conclusion must keep the study, population, units and year attached to any reported number.
Misreading to avoid. A reader sees two scores around 563 and assumes they are identical exam papers or that computational problem solving was graded as SEC Computing. A plausible-looking calculation can still answer an invalid comparison when scales or reference populations differ.
Reader or teaching check. Label the domain and OECD source carefully. Treat it as complementary evidence about students’ problem-solving skills. Before repeating the result, verify the source and ask for a changed synthetic example that tests the same statistical principle.
32. The right follow-up to a national report is an honest question
What the official data or mathematical concept means. National results can prompt research questions about curriculum, pedagogy, equity and student experiences. A productive question names a population, measurement and evidence rather than asserting one causal answer. This makes public results useful without reducing children to a league table.
Original worked interpretation. Ask whether a chosen intervention improves students’ independent fraction explanations using pre/post work samples and a suitable comparison. Do not treat a single high international rank as proof of the intervention’s effectiveness. A valid conclusion must keep the study, population, units and year attached to any reported number.
Misreading to avoid. A school project proposes to prove Singapore’s rank was caused entirely by tuition, without measuring exposure or accounting for other influences. A plausible-looking calculation can still answer an invalid comparison when scales or reference populations differ.
Reader or teaching check. Specify hypotheses, data permissions, sampling design, outcome measures and limitations before making an empirical claim. Before repeating the result, verify the source and ask for a changed synthetic example that tests the same statistical principle.
33. A six-week reader’s route from national scores to local learning
What the official data or mathematical concept means. A practical family or student plan can begin by checking official sources, then reading scales, studying a few statistical concepts and using a child’s authentic work to identify next steps. The exercise need not become a high-stakes comparative ranking.
Original worked interpretation. Week one compare TIMSS and PISA metadata; week two examine means and sample sizes; week three study distribution and proficiency levels; week four discuss trend interpretation; week five analyse a child’s conceptual error; week six review a fresh independent attempt. A valid conclusion must keep the study, population, units and year attached to any reported number.
Misreading to avoid. A reader memorises ranks but cannot explain what the assessed ages, scales or sample uncertainties mean. A plausible-looking calculation can still answer an invalid comparison when scales or reference populations differ.
Reader or teaching check. Write a short summary with correct source dates, one supported conclusion and one explicit limitation. Then choose a suitable mathematics learning task for the student in front of you. Before repeating the result, verify the source and ask for a changed synthetic example that tests the same statistical principle.
Four extended numerical examples about education data
Why two equal averages can conceal unequal learning needs
Suppose fictional class A has scores 40,50,60,70,80 and class B has 60,60,60,60,60. Both means are 60. Yet class A contains far more variation and may require differentiated tasks in several directions. The range for A is forty; for B it is zero. Calling both classes identical because their means match would miss their distribution. Similarly, a national Mathematics average alone does not describe every learner’s level, wellbeing or concept mastery.
Why the same numerical change is not the same relative change
Singapore PISA Mathematics was 575 in 2022 and 563 in 2025, a difference of −12 scale points. The raw relative change 12/575 is about 2.09%, but such a percentage is not a recommended PISA trend metric because the achievement scale is not a ratio scale with a meaningful zero. The accurate report is a decline in reported scale points under the OECD’s trend methodology, with the country note providing significance and context. It must not be described as twelve percent fewer mathematical skills.
Why a weighted estimate differs from a simple sample average
A synthetic survey samples two pupil groups at different rates. One respondent scoring 80 represents ten target-population pupils; another scoring 60 represents thirty. A properly weighted toy average is (10×80+30×60)/40=65. An unweighted average is seventy. The arithmetic difference shows why international survey methodology and sampling weights matter. This toy two-record example is not a reconstruction of OECD or IEA weights, and official estimates require their published datasets and procedures.
Why a national proficiency share does not determine an individual’s level
If a population share of 89% meet a proficiency threshold, approximately eleven of every hundred would fall below that threshold in a perfectly representative simplified illustration. A given Punggol child could be in either part of that distribution; knowing the national percentage gives no direct diagnosis of their fractions or graphs. The family should examine actual work, ask the teacher about one recurring error and check a fresh independent task. This separates statistical context from a decision about a particular learner.
Six-week guide to reading scores responsibly
Week 1 — verify the newest sources
Open the OECD September 2026 Singapore country note and IEA TIMSS 2023 results. Record their years, assessed ages, subject domain, scales and publication dates.
Week 2 — understand means, distributions and ranks
Calculate a mean and range from a tiny synthetic dataset. Explain why ranks and point differences carry different information.
Week 3 — distinguish scales and populations
Make two columns labelled PISA and TIMSS. Write target population and units, then explain why subtracting their national headline scores is not a valid learning comparison.
Week 4 — study changes with uncertainty
Compare PISA 2022 and 2025 on the same reported scale, read the OECD trend explanation and practise a fictional standard-error example without calling it actual PISA uncertainty.
Week 5 — discuss equity and local support
Use the finding that national averages and performance gaps can both matter. Review one real school Mathematics question and identify a specific learning need.
Week 6 — explain one supported conclusion and one limit
Write a short summary using the right date and source, with one numerical fact, its interpretation and a clear statement about what cannot be inferred for a named school or pupil.
PISA, TIMSS and Mathematics parent FAQs
What is Singapore’s latest PISA Mathematics result as of October 2026?
PISA 2025, published 8 September 2026: Singapore scored 563, second among participating systems, with an OECD average of 463. Confirm the study cycle, population and original report when quoting the figure, and use individual schoolwork for personal learning decisions.
What system scored first in PISA 2025 Mathematics?
B-S-J-Z (China), a reported group of Beijing, Shanghai, Jiangsu and Zhejiang, scored 612. Do not describe it as a single individual school. Confirm the study cycle, population and original report when quoting the figure, and use individual schoolwork for personal learning decisions.
Is Singapore still first in TIMSS Maths?
The TIMSS 2023 results placed Singapore first for Grade 4 Mathematics with 615 and Grade 8 Mathematics with 605. Confirm the study cycle, population and original report when quoting the figure, and use individual schoolwork for personal learning decisions.
Does TIMSS 2023 assess the same age as PISA 2025?
No. TIMSS covers Grade 4 and Grade 8; PISA assesses 15-year-old students. Confirm the study cycle, population and original report when quoting the figure, and use individual schoolwork for personal learning decisions.
Why can I not subtract TIMSS 615 minus PISA 563?
The studies have different achievement scales, populations and frameworks. That difference is not a valid measure of learning decline. Confirm the study cycle, population and original report when quoting the figure, and use individual schoolwork for personal learning decisions.
Did Singapore’s PISA Mathematics mean fall from 2022?
Yes. The reported mean changed from 575 in 2022 to 563 in 2025; OECD country notes describe a lower result. Confirm the study cycle, population and original report when quoting the figure, and use individual schoolwork for personal learning decisions.
What percentage of Singapore students met PISA Mathematics Level 2 in 2025?
The OECD Singapore note reports around 89% attained Level 2 or above. Confirm the study cycle, population and original report when quoting the figure, and use individual schoolwork for personal learning decisions.
Is PISA Level 2 the same as Singapore G2 Mathematics?
No. PISA proficiency levels are assessment-scale categories, while G1/G2/G3 are school subject levels under Full SBB. Confirm the study cycle, population and original report when quoting the figure, and use individual schoolwork for personal learning decisions.
Does a PISA rank predict a Primary 6 child’s PSLE AL?
No. Different populations, qualifications and grading systems are involved. Confirm the study cycle, population and original report when quoting the figure, and use individual schoolwork for personal learning decisions.
Does Singapore’s national result rank individual Punggol schools?
No. National participating-population statistics are not verified school-specific scores. Confirm the study cycle, population and original report when quoting the figure, and use individual schoolwork for personal learning decisions.
What is the TIMSS scale centrepoint?
500 on the fixed TIMSS trend achievement scale, not a school passing mark. Confirm the study cycle, population and original report when quoting the figure, and use individual schoolwork for personal learning decisions.
Is a difference of three TIMSS points significant?
Not necessarily. Use the actual report’s uncertainty and significance information, not an unsupported guess. Confirm the study cycle, population and original report when quoting the figure, and use individual schoolwork for personal learning decisions.
How should parents use an international report?
Understand its national context, then use schoolwork and teacher feedback to identify concrete learning needs. Confirm the study cycle, population and original report when quoting the figure, and use individual schoolwork for personal learning decisions.
Does an international result prove a particular tuition method caused success?
No. Causal claims require evidence about the method, comparison conditions and alternative explanations. Confirm the study cycle, population and original report when quoting the figure, and use individual schoolwork for personal learning decisions.
What report should I cite for PISA 2025?
OECD PISA 2025 Results Volume I and its official Singapore country note, both published in September 2026. Confirm the study cycle, population and original report when quoting the figure, and use individual schoolwork for personal learning decisions.
What report should I cite for TIMSS 2023?
The IEA TIMSS 2023 International Results and official participating-country tables. Confirm the study cycle, population and original report when quoting the figure, and use individual schoolwork for personal learning decisions.
OECD, IEA and MOE primary sources
The source shelf separates PISA 2025 official results, TIMSS 2023 official results and Singapore curriculum guidance. The invented pupil and class datasets throughout the examples are illustrations of statistical ideas, not confidential or school-specific records.
- OECD PISA 2025 Singapore country note, published 8 September 2026
- OECD PISA 2025 mathematics performance chapter
- OECD Education GPS PISA 2025 Singapore Mathematics indicators
- IEA TIMSS 2023 international report and results
- IEA TIMSS 2023 report publication and sample description
- US NCES accessible TIMSS 2023 Grade 4 and Grade 8 result comparisons
- MOE Singapore Primary Mathematics curriculum
- Clementi immutable editorial and mathematical teaching floor
Continue through the Punggol Mathematics system
- Primary 1–6 Mathematics, PSLE and secondary bridge
- Mathematics assessments from WA to PSLE, SEC and A-Level
- Maths Olympiads and enrichment in Punggol
- Mathematical modelling and real-world problems
- Statistics and Data Science Mathematics from Secondary to University
International Mathematics results are most valuable when interpreted accurately. Singapore’s strong average performance deserves recognition, while national variation and individual differences show why teaching still needs diagnostics, supportive feedback and appropriate challenge. A child is not a rank: the next useful question is which mathematical relationship they can now explain and independently transfer.


