
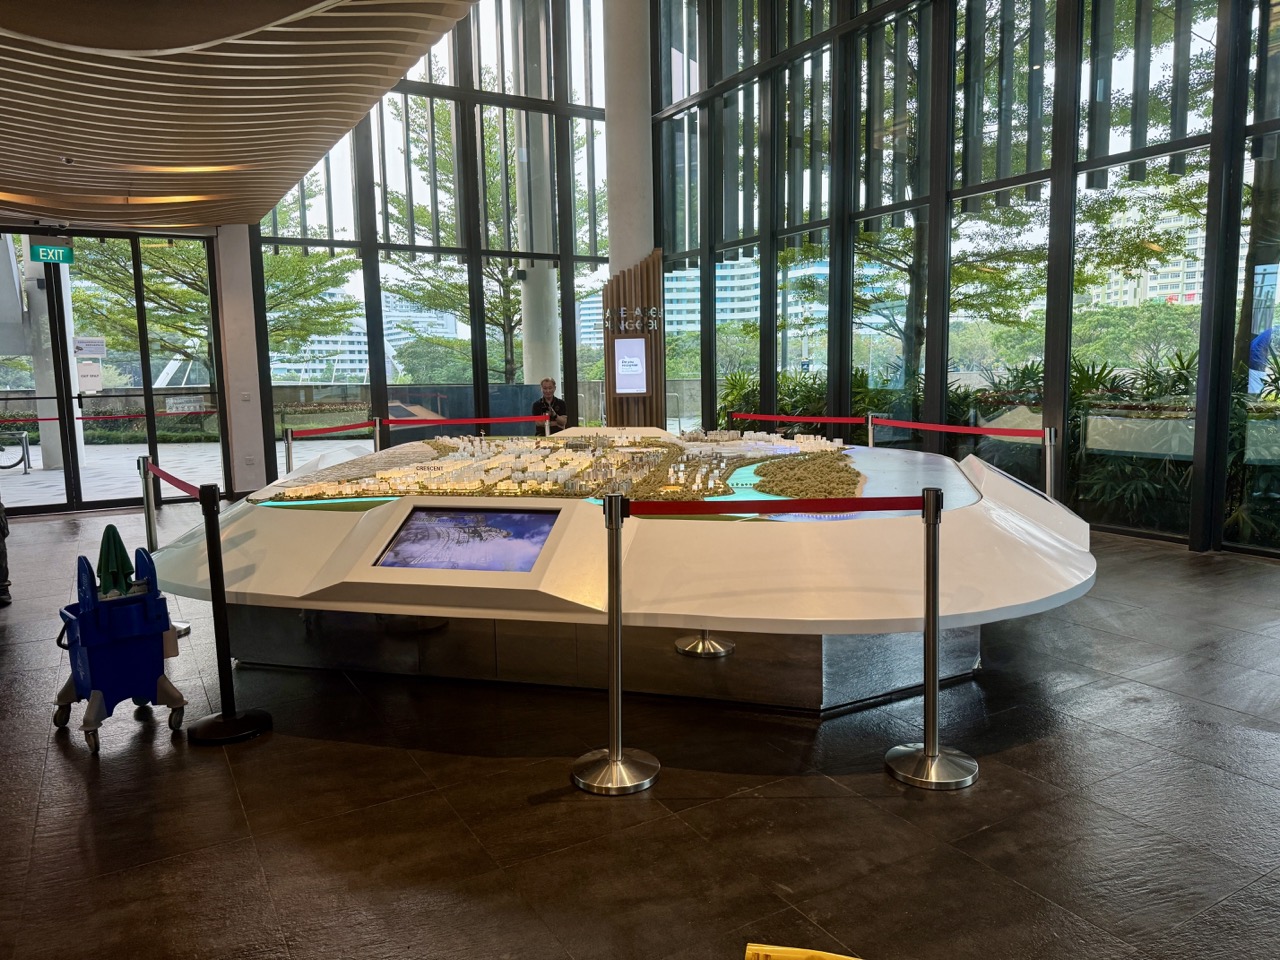
- Use SLA OneMap to locate a real public destination without guessing coordinates
- Distinguish WGS84 latitude-longitude from Singapore’s SVY21 grid
- Solve a scale and distance problem using the actual Punggol Waterway connector label
- Compare the topology of Punggol MRT and its two LRT loops
- Map a library visitor’s access network rather than drawing a misleading circle
- Test historical georeferencing with NLB’s Punggol Story Map
- Read Punggol Digital District’s planned footprint without assuming every path is open
- Use SingStat planning-area population data without turning polygons into personal profiles
- Evaluate a safe routing map for step-free public access
- Build an ethical geospatial atlas of ten Punggol public facts
- SLA OneMap coordinate conversions
- SLA OneMap population-query coverage and supported years
- JTC open district amenities and trail stages
- Punggol Geography field observations
- Punggol urban planning context
- Graph algorithms and careful data modelling
- Demographic inference and ethics
- eduKateSG step-by-step error repair learning model
The best map identifies both place and uncertainty
Punggol offers a compact introduction to geospatial science because public transport, waterway paths, older names, integrated services and phased new development overlap. Build a small accurate dataset before designing a large map. Check the feature geometry, coordinate reference system, source date and actual access, then repair the first mismatch. Spatial information becomes valuable when it helps a reader act correctly without exposing people or inventing precise locations.
- Map a building centroid as though it is a verified public entrance.
- Confuse WGS84 degrees with SVY21 or Web Mercator projected coordinates.
- Use extra decimal places as a substitute for locating the correct feature.
- Treat a schematic train map as a geographic scale drawing.
- Confuse 4.2km park nature walk and 8.4km park connector as one route.
- Use a straight-line buffer as proof of walking or step-free accessibility.
- Georeference an old historical map with fabricated exact control points.
- Present the whole planned Heritage Trail as open because it appears on a masterplan.
- Compare planning-area proportions without total population or time reference.
- Publish private household positions, sensitive wildlife locations or API secrets.
Frequently asked questions
What is geospatial science?
The study and use of data about location, spatial relationships, coordinates, maps and geographically distributed processes.
Is GIS the same as reading a normal map?
GIS can store and analyse structured spatial data, sources and geometry, beyond viewing a basemap.
What is OneMap?
SLA’s authoritative Singapore mapping platform with public map tools and documented APIs.
Can OneMap find Punggol addresses?
It provides search and geocoding services for supported roads, addresses and public places, subject to current data and terms.
What is a CRS?
A coordinate reference system that defines how location coordinates relate to Earth or a projected map.
What is WGS84?
A geographic reference system commonly used for latitude and longitude, represented as EPSG:4326.
What is SVY21?
Singapore’s local projected coordinate system, represented as EPSG:3414.
Why can I not interchange latitude with SVY21 X?
They use different definitions and units; valid transformation is required.
What is map scale?
The ratio between a distance shown on a map and the represented ground distance, under the map’s stated projection and conventions.
Is Punggol Waterway Park Connector 8.4km?
NParks lists the named park connector as 8.4km, while a separate nature walk is listed as 4.2km.
Is Punggol Coast MRT the same as Punggol Point LRT?
No. They are separate stations on different operating rail services.
What is graph topology?
The structure of connections among nodes, independently from exact visual distances.
What is a network service area?
The area reachable along an identified transport or pedestrian network under defined travel rules or costs.
Can a circular 500m buffer prove a five-minute walk?
No. Route geometry, crossings, speed, access and conditions matter.
Can I plot an exact historic village home from an old Punggol story map?
Not without evidence sufficient for that precision. Historical maps can be approximate and may predate later land changes.
Does a Punggol Digital District map prove every walkway is open?
No. Planned alignments and current operational access must be checked separately.
Which official source contains Punggol planning-area demographics?
SingStat publishes geographic-distribution datasets, and OneMap documents population-related API services with specific supported years.
Is a population proportion the same as an absolute count?
No. A proportion requires a denominator, and absolute numbers also depend on population size.
Can I make a step-free walking map from ordinary line geometry alone?
Not reliably. You need appropriate verified accessibility attributes and current operational conditions.
Can a student publish an online geospatial atlas?
Yes, using appropriately licensed public data, safe general locations, verified metadata and clear uncertainty labels.
Authoritative mapping sources and related Punggol learning
- Use SLA OneMap to locate a real public destination without guessing coordinates
- Distinguish WGS84 latitude-longitude from Singapore’s SVY21 grid
- Solve a scale and distance problem using the actual Punggol Waterway connector label
- Compare the topology of Punggol MRT and its two LRT loops
- Map a library visitor’s access network rather than drawing a misleading circle
- Test historical georeferencing with NLB’s Punggol Story Map
- Read Punggol Digital District’s planned footprint without assuming every path is open
- Use SingStat planning-area population data without turning polygons into personal profiles
- Evaluate a safe routing map for step-free public access
- Build an ethical geospatial atlas of ten Punggol public facts
- SLA OneMap coordinate conversions
- SLA OneMap population-query coverage and supported years
- JTC open district amenities and trail stages
- Punggol Geography field observations
- Punggol urban planning context
- Graph algorithms and careful data modelling
- Demographic inference and ethics
- eduKateSG step-by-step error repair learning model
The best map identifies both place and uncertainty
Punggol offers a compact introduction to geospatial science because public transport, waterway paths, older names, integrated services and phased new development overlap. Build a small accurate dataset before designing a large map. Check the feature geometry, coordinate reference system, source date and actual access, then repair the first mismatch. Spatial information becomes valuable when it helps a reader act correctly without exposing people or inventing precise locations.
- Location and geocoding: find a correct public address and state what the returned point means.
- Coordinate systems: distinguish degrees from projected coordinates and document the CRS.
- Map scale: convert units and identify which named route is being measured.
- Networks: model real station connections without assuming equal travel time.
- Accessibility: compare a circular radius with usable walking routes.
- Historical geography: align maps without assigning false modern coordinates to old settlements.
- Urban planning: distinguish a boundary or proposed link from open pedestrian infrastructure.
- Population mapping: preserve time, denominator and area boundaries.
- Cartographic ethics: omit private or sensitive locations and display uncertainty clearly.
The first geospatial question is what geometry represents the thing
A regional library may be shown as a public building point, a footprint polygon or an entrance location. A park connector is a path line rather than one dot. A planning area is an administrative polygon, not a specific household. Each representation supports different questions. A map can be technically valid while answering the wrong problem if it uses a building centroid to promise a wheelchair entrance or a straight-line distance to estimate walking time.
Coordinate metadata matters equally. OneMap documents WGS84 geographic coordinates and Singapore’s SVY21 projected system; confusing their numeric fields can put a point far from the intended location or create invalid positions. Even properly converted coordinates can be uncertain if the underlying input was only a guessed pin. Precision on screen does not establish accuracy on the ground. Students must record the CRS and the feature represented.
Finally, time is part of geography. LTA station services, park gate rules, construction phases and population distributions change. The effective opening of a path is not deduced from a masterplan alone, and a 2020 demographic API table is not automatically current for 2026. A trustworthy geospatial analysis records data currency, source and the status of unverified links.
Ten Punggol geospatial mapping exercises
1. Use SLA OneMap to locate a real public destination without guessing coordinates
Where: One Punggol at 1 Punggol Drive, using OneMap’s authoritative Singapore base map.
The mapping problem
OneMap is Singapore’s authoritative national map produced by SLA, with search and reverse-geocoding services covering local places and addresses. A geospatial student should begin by distinguishing a human-readable address, an officially named building and a coordinate pair. These are related but not identical forms of location information. When an online article calls a place ‘near Punggol MRT’, it has not supplied a precise official coordinate or demonstrated which pedestrian entrance is best. Searching the full verified One Punggol address provides a dependable starting record for map work.
Safe mapping procedure
Open OneMap’s public map or its documented search service and locate 1 Punggol Drive. Record the exact address string returned and the place type, using the name supplied by the source rather than an invented shortened label. Note whether the selected point represents a building, address centroid or entry location; these may differ. Make a screenshot only in accordance with map reuse terms, or draw an original diagram. Create a separate route question such as how a visitor would travel from Punggol MRT, then use routing information rather than a straight line to answer it.
Original worked example
A student uses a map’s display centre to create a latitude and longitude for the library entrance, claiming it is accurate to six decimal places. The point might be the building centre rather than the entrance. The correction records that it is a mapped building location with uncertain doorway precision and consults the venue’s directions for the actual visitor approach. Giving more decimal places does not make an unverified point correct.
A more demanding GIS question
Compare ordinary search with reverse geocoding using a documented public sample point. Ask what happens if two addresses share a large complex or an entrance lies on a different road. Discuss why geocoding results need verification and why a ‘best match’ algorithm can still return the wrong Punggol venue when the name is ambiguous.
Access, accuracy and privacy limits
Do not publish private family addresses or identify the homes of residents. OneMap API use may require account registration and tokens; follow official terms and avoid putting tokens into public WordPress source code.
Official mapping source: Use SLA OneMap to locate a real public destination without guessing coordinates. Check the dataset’s supported dates and licensing.
2. Distinguish WGS84 latitude-longitude from Singapore’s SVY21 grid
Where: A desktop OneMap coordinate-conversion lesson using fictional or OneMap’s own example coordinates.
The mapping problem
OneMap documents coordinate conversions among WGS84 EPSG:4326, SVY21 EPSG:3414 and Web Mercator EPSG:3857. These systems express location in different coordinate spaces. WGS84 provides angular latitude and longitude while Singapore’s SVY21 projected grid expresses easting and northing in a local system. A numeric pair without its coordinate reference system (CRS) can be misplotted or interpreted as an ordinary street distance. Coordinate literacy comes before placing pins on a map.
Safe mapping procedure
Read OneMap’s coordinate-converter page and write a table with the CRS name, EPSG identifier, type of coordinates and broad purpose. Use a documented example supplied by OneMap or a fully fictional point, clearly labelled, rather than a private location. Convert it using the official tool when properly authorised, and check both input order and output labels. For a paper test, compare why a latitude of approximately one degree north does not mean one metre north. Record output precision and note that projection transformations involve definitions and possible rounding.
Original worked example
A developer takes a sample pair labelled X=30,000 and Y=40,000 in SVY21 and pastes it into an application expecting WGS84 latitude and longitude. The point is invalid or misleading because the units and ranges differ. The correction identifies the source CRS and applies the documented transformation before mapping. It avoids treating X and longitude as the same field simply because both are horizontal coordinates.
A more demanding GIS question
Discuss Web Mercator’s visual convenience for online map tiles and its distortions, particularly toward high latitudes. Explain why projected units can be appropriate for local calculations when used correctly, while straight-line distances on an unverified pixel image cannot simply be read as actual walking travel. A good GIS file always documents the original CRS.
Access, accuracy and privacy limits
The OneMap conversion API may require a valid authentication token and has rate limits. Do not publish a token, invent successful transformations or claim a coordinate pair has been surveyed when it came from a simple web map.
Official mapping source: Distinguish WGS84 latitude-longitude from Singapore’s SVY21 grid. Check the dataset’s supported dates and licensing.
3. Solve a scale and distance problem using the actual Punggol Waterway connector label
Where: NParks Punggol Waterway Park and named Punggol Waterway Park Connector.
The mapping problem
NParks describes a 4.2-kilometre Waterway Park nature walk and separately an 8.4-kilometre Punggol Waterway Park Connector. Two nearby geographic features can share words in their titles while having different route extents. A correct geospatial analysis must identify which polyline the number applies to before calculating anything. It also distinguishes geographic distance, traced path length and actual travelled distance when a path is diverted or a visitor takes a side route.
Safe mapping procedure
Read the official pages for both named routes and create a small metadata table with name, source, published length and relevant map description. Convert 4.2km to 4,200m and 8.4km to 8,400m; do not assume their exact geometries or travel overlap from the numerical ratio. On paper draw a hypothetical 1:10,000 route map, where one centimetre represents one hundred metres, then calculate the length represented by a three-centimetre line. Label the paper map illustrative, not a downloaded survey of Punggol.
Original worked example
At 1:10,000 scale, three centimetres on the fictional drawing represent thirty thousand centimetres in the modelled ground, or three hundred metres. A learner first reports thirty kilometres because they multiply without reconciling units. Another learner divides 8.4 by 4.2 and says the connector is exactly two loops of the nature walk. The ratio is two, but the geographic route relationship has not been established. Both errors need different corrections.
A more demanding GIS question
Discuss why a path drawn as several straight segments can underestimate a winding actual route and why GPS traces can contain noise near buildings. Propose a method to compare the official named polyline with a GPS record if the owner had permission and appropriate data, without recording other walkers’ movements.
Access, accuracy and privacy limits
No activity requires the full walk. Do not place measuring tapes or tripods on shared paths, enter water or claim an official map’s dimensions are a current accessibility guarantee on every spur.
Official mapping source: Solve a scale and distance problem using the actual Punggol Waterway connector label. Check the dataset’s supported dates and licensing.
4. Compare the topology of Punggol MRT and its two LRT loops
Where: LTA’s current rail map, Punggol MRT NE17 and Punggol Coast MRT NE18.
The mapping problem
Topological questions concern what is connected to what, not the shape or visual size of a line. Punggol MRT is an interchange with East and West LRT loops, and LTA opened Punggol Coast MRT as the newer North East Line terminal in December 2024. A rail schematic simplifies geographic spacing to make connectivity easier to read. A student can use it to build a network graph while recognising that it is not a real-distance engineering survey or a source of exact train intervals.
Safe mapping procedure
Copy the correctly named operating stops from LTA’s current map and build a small graph with Punggol as a transfer node. Label different services and where a journey requires transferring. Write separate graph edge meanings: adjacency only, fictional equal cost or a documented real travel attribute. Never assign a cost without saying what it measures. Add a test where a user confuses Punggol Point LRT with Punggol Coast MRT and show the correct two different nodes.
Original worked example
A student places Punggol Point and Punggol Coast on one node because both contain the word ‘Punggol’. The resulting path appears to offer a direct transfer that does not exist. The correction assigns their proper LRT and MRT station identities and verifies the operating connection separately. Another error is claiming equal paper distances imply equal train travel time; a schematic is designed primarily for readability.
A more demanding GIS question
Build two small route models: one for fewest transfers and one with hypothetical travel-time weights. Discuss which is useful for a traveller with a stroller or limited stamina. Accessibility requires actual lift and pedestrian conditions, so an algorithm without current information should display uncertainty rather than promise a safe route.
Access, accuracy and privacy limits
Do not copy a 2028 rail masterplan as if every new connection is already operating. Follow current LTA passenger rules and keep algorithms purely educational; they are not real-time journey predictions.
Official mapping source: Compare the topology of Punggol MRT and its two LRT loops. Check the dataset’s supported dates and licensing.
5. Map a library visitor’s access network rather than drawing a misleading circle
Where: Punggol Regional Library at One Punggol and public pedestrian connections.
The mapping problem
GIS analysis often uses a circular buffer around a point to represent proximity, but people travel along paths, crossings, lifts and bridges. A circular half-kilometre buffer is not the same as a five-hundred-metre network service area. This difference matters around an interchange and a waterway, where a destination may appear close across water but require a longer walking route. A geospatial student should choose the representation that matches the decision and identify limitations when accessible paths are not verified.
Safe mapping procedure
Select One Punggol as a clearly named public destination. On an illustrative grid draw a five-hundred-metre radius circle and overlay a small hypothetical walking network containing one waterway and bridge. Count which model points are within the circle but not within five hundred metres of travel along the network. Then consult OneMap’s routing documentation for how actual walking routes might be obtained with proper authorised access. Do not invent a live travel-time metric for a particular resident.
Original worked example
An illustrative student map shows a point four hundred metres away in a straight line but seven hundred metres by a permitted path over a bridge. The circle includes the point; the walking-distance service area does not. Both calculations are internally correct but answer different questions. The correction is choosing the network representation for a visitor-access question and explaining that the data are synthetic.
A more demanding GIS question
Consider that a wheelchair-usable network may require different route attributes, including lifts, slopes or temporary closures, which ordinary map geometry may not provide. Define a rule for unknown accessibility information rather than treating every footpath edge as guaranteed usable. Ask what data would be needed for an evidence-led community access study.
Access, accuracy and privacy limits
Do not use a geospatial buffer to claim a person’s household is within a guaranteed journey time or eligibility catchment. Service access, walkability and legal boundaries require the appropriate official data and conditions.
Official mapping source: Map a library visitor’s access network rather than drawing a misleading circle. Check the dataset’s supported dates and licensing.
6. Test historical georeferencing with NLB’s Punggol Story Map
Where: NLB Curiocity’s Punggol story map and present OneMap geography.
The mapping problem
NLB documents that the historical place name Punggol included areas now associated with parts of Sengkang and Hougang. The story map uses SLA OneMap as its present-day base and draws on historical references, but explicitly says it is not comprehensive for every Punggol building. A historical map is a product of its time, scale and survey purpose. Georeferencing it against a modern map requires control points and careful uncertainty, not simply stretching an image until its road names look familiar.
Safe mapping procedure
Read the story map’s source notes and sketch a two-layer diagram: broad historical place naming and current map boundaries. Identify which features might be stable reference points and which may have changed through reclamation or road realignment. Write a georeferencing proposal listing three candidate control features and reasons each may be unreliable. Do not publish invented precise coordinates for former homes or say that an old village occupies a specific modern block without archival evidence.
Original worked example
A student overlays a crop of a historical Punggol map onto a new development and marks an old house at the entrance of a currently open shop. The old map’s scale and changed landscape do not justify that accuracy. The revised drawing shades an approximate historic context and attaches the archival date and uncertainty. This prevents a classroom GIS output from making a false historical claim.
A more demanding GIS question
Introduce root mean square error qualitatively as a way to assess fit against chosen control points, without inventing an exact calculated figure when points were never georeferenced. Discuss the risk of choosing only control points that support a desired conclusion and why the original map’s provenance must be preserved.
Access, accuracy and privacy limits
Do not use historical maps to navigate through closed construction sites, private buildings or restricted heritage areas. Respect rights in archival cartography and the source’s own stated limitations.
Official mapping source: Test historical georeferencing with NLB’s Punggol Story Map. Check the dataset’s supported dates and licensing.
7. Read Punggol Digital District’s planned footprint without assuming every path is open
Where: URA’s Punggol Digital District urban-design guidelines and JTC’s current public community map.
The mapping problem
URA’s guidelines describe the district as integrating SIT and JTC business-park developments in a transport-oriented, pedestrian-friendly setting. JTC’s current community information identifies operating amenities and the first opened stretch of the planned Heritage Trail. A planning boundary is not the same as an accessible walking route, and a completed transport station does not prove every depicted building phase is open. This is a useful geospatial source test because masterplan polygons and day-of-visit operating conditions answer different questions.
Safe mapping procedure
Read the latest URA boundary and design guidance and JTC’s current community page. Create separate legend classes for existing operating public facility, planned path, construction or unverified area, and district boundary. Mark only those statuses that an official current source supports. If a student wants to plan a walking route, use currently open entrances and paths from the site operator; do not draw a through-route on the masterplan as though the whole network is passable.
Original worked example
A student sees a roughly 1.3km planned Heritage Trail line and publishes a map encouraging visitors to walk its entire alignment. JTC’s current page identifies the first four hundred metres as open. The corrected map colours that section as documented open and leaves other stages unconfirmed. It becomes more useful to visitors without claiming the planning diagram itself was inaccurate.
A more demanding GIS question
Compare a land-use planning polygon with an actual pedestrian route network. Discuss why cadastral boundaries, access rights and physical footpaths may differ. Ask what update metadata a mobile wayfinding product would need to keep visitors from closed paths, and how the map should behave when opening status is unknown.
Access, accuracy and privacy limits
Never enter private SIT rooms, JTC business offices or worksite fences to verify a map. Treat plans, proposed links and actual opening notices as different evidence classes.
Official mapping source: Read Punggol Digital District’s planned footprint without assuming every path is open. Check the dataset’s supported dates and licensing.
8. Use SingStat planning-area population data without turning polygons into personal profiles
Where: SingStat 2026 planning-area demographic tables and OneMap Population Query documentation.
The mapping problem
SingStat releases geographic-distribution data by planning area and subzone, and OneMap documents Population Query endpoints for demographic information. Administrative boundaries are a convenient aggregation, but values for a whole polygon cannot tell us a particular resident’s age, household income or journey habits. A student mapping Punggol must record the reference year and exact boundary used. Furthermore, OneMap’s documented population-query examples may list older available years for particular endpoints; a current 2026 SingStat table is not automatically returned by every API method.
Safe mapping procedure
Choose one publicly released aggregate age statistic in SingStat’s 2026 publication and state its denominator, reference date and geography. Draw two fictional subzones with different population sizes to illustrate why identical colour shading can obscure absolute counts. Create a map legend that says whether colours represent numbers, percentages or categories. When considering OneMap’s API, read the actual documented supported years and response fields instead of silently assuming that every endpoint contains the newest table.
Original worked example
A student colours a hypothetical subzone dark because thirty per cent of its residents are below five, and then writes that it contains more children than a lighter-coloured subzone. Without total populations, that inference is invalid. The correction adds denominators and distinguishes a high share from a large number. The student also refrains from attaching one demographic percentage to a visible household or school group.
A more demanding GIS question
Compare choropleth shading by raw count against shading by proportion. Explain why raw totals can reflect area size or population scale and why rate maps answer different questions. Consider how boundary changes complicate time-series comparisons. Discuss uncertainty, suppression of sensitive small-area data and ethical aggregation choices.
Access, accuracy and privacy limits
Do not attempt to reidentify households through combinations of subzone data and other information. Use authentic dates, official sources and licensing rules. Demographic patterns are group descriptions, not personal dossiers.
Official mapping source: Use SingStat planning-area population data without turning polygons into personal profiles. Check the dataset’s supported dates and licensing.
9. Evaluate a safe routing map for step-free public access
Where: One Punggol, public transport nodes and BCA’s inclusive design principles.
The mapping problem
LTA and PA describe public transport and community-hub access, while BCA sets out Universal Design principles. A geospatial route intended for wheelchair users or visitors with prams needs more than a straight-line location. It may require data on lifts, curb crossings, surface conditions and temporary works. A network can be physically connected while unsuitable for a particular user. Building an ethical map means distinguishing confirmed information from assumed accessibility and never promising an unverified route.
Safe mapping procedure
Create a hypothetical small graph representing station, crossing, lift, hub entrance and library. Mark every link with its information status: verified, unverified or temporarily unavailable. Write a routing rule that refuses to guarantee step-free access when critical link data are missing, and instead prompts for current operator checking. Ask a peer to test the map with a fictional user who prefers rest stops or shelter. Revise labels that assume every user’s priorities are identical.
Original worked example
A route solver chooses the shortest path over a staircase because it has the smallest geometric length. For a user who requires step-free access, the path violates a stated constraint. The corrected graph removes incompatible edges from that hypothetical routing case and returns an alternative only when the necessary information is supported. If no verified path exists in the data, the honest result is ‘route not confirmed’.
A more demanding GIS question
Add a second criterion, such as fewer transfers or a nearby rest area, and discuss why accessibility is not one universal preference. Test the effect of a fictional lift outage while making clear that no real lift status has been measured. Explain why a user-facing interface should identify data currency and offer authorised updates.
Access, accuracy and privacy limits
Do not simulate a disability by using another person’s mobility aid, obstruct a lift for testing or invent current accessible-route conditions. Compliance determinations are professional matters; a student graph is an educational prototype.
Official mapping source: Evaluate a safe routing map for step-free public access. Check the dataset’s supported dates and licensing.
10. Build an ethical geospatial atlas of ten Punggol public facts
Where: A desk project using authoritative OneMap, NParks, LTA, NLB and JTC sources.
The mapping problem
A useful map atlas is a documented dataset, not just ten colourful pins. Each feature should have a verified locator, exact name, geometry type, source, last-check date, public access status and uncertainty. Punggol provides a diverse set: one integrated hub, a rail interchange, a newer terminal, a waterway path, a coastal park and a conserved structure. A student learns spatial data modelling by choosing appropriate points, lines and polygons for what the subject actually represents.
Safe mapping procedure
Select no more than ten publicly named Punggol features whose locations are supported by official sources. For each decide whether the map should represent a point, line or area. Keep exact private addresses, schoolchildren’s locations and sensitive wildlife points out of the atlas. Record sources and avoid applying one shared ‘open now’ status to every feature. Make a simple legend and ask a first-time reader to explain whether the line represents a trail, transit link, road or planning boundary. Correct any ambiguous symbol before publishing.
Original worked example
A student places a single dot labelled ‘8.4km Punggol Waterway Park Connector’ and claims the point is the whole route. A point might be useful as a locator or entrance, but the connector’s spatial extent is a line or route. The corrected atlas either uses an appropriately sourced polyline or labels the dot as a representative entrance, with the limitation clearly stated. This is a fundamental geometry-type repair.
A more demanding GIS question
Audit four error classes: ambiguous name, incorrect coordinate reference system, stale operating status and unsupported attribution. Create a version log and explain which errors could cause an inconvenient trip versus a serious safety problem. Consider map generalisation: on a small-scale printed map some detail must be omitted, but omission should not falsely turn planned routes into open ones.
Access, accuracy and privacy limits
Respect data licensing, avoid embedding OneMap credentials in public files and do not present hypothetical positions as official surveyed coordinates. Any map that names public services should be reviewed against current source and site access before distribution.
Official mapping source: Build an ethical geospatial atlas of ten Punggol public facts. Check the dataset’s supported dates and licensing.
A practical GIS data model
Create a table with a feature identifier, feature name, type, geometry, coordinate reference system, original source, as-of date, access condition and uncertainty. Keep the first version small. If a row represents Punggol Waterway Park Connector, type should indicate a route or line; if it represents One Punggol’s public address, identify whether the point is a public locator or a precise entrance. A record without a source or CRS should be treated as incomplete for a technical project.
Students can test the schema without collecting real coordinates. Use dummy geometries and compare how a routing graph fails when a nonexistent connection is inserted. Test a missing publication date, conflicting place names and an assumed open route. The error messages should identify which field needs checking, not silently fill it from guesses. A technically correct GeoJSON file can still carry false geographic claims, so content validation is essential.
Three Punggol geospatial study itineraries
A forty-five-minute OneMap desk session
Read OneMap’s main documentation, search for a genuine public destination, and identify what its location record refers to. Then study the coordinate conversion page and draw an input-output flow showing WGS84, SVY21 and Web Mercator. Use OneMap’s documented sample values rather than private home coordinates. End by explaining why a point’s CRS and object type are necessary to use it correctly.
A park-route comparison on paper
Read NParks’ descriptions of the 4.2km nature walk and 8.4km park connector. Create two independent records and a small map legend. Show an illustrative short public walking segment with a return route, and distinguish the length traced on paper from the official published route length. Do not force a long site visit or claim that both NParks distances describe the same exact polyline.
An urban change and accessibility atlas
Use URA and JTC to mark documented public amenities and planned district links. Add LTA’s Punggol Coast station as a confirmed operating rail node, and include NLB’s historical map as a separate dated interpretive layer. Test one fictional wheelchair access case using a graph whose link status may be unknown. Keep proposed features and unverified accessible paths clearly labelled instead of treating every line as ready to use.
Ten geospatial mistakes worth correcting before publication
- Map a building centroid as though it is a verified public entrance.
- Confuse WGS84 degrees with SVY21 or Web Mercator projected coordinates.
- Use extra decimal places as a substitute for locating the correct feature.
- Treat a schematic train map as a geographic scale drawing.
- Confuse 4.2km park nature walk and 8.4km park connector as one route.
- Use a straight-line buffer as proof of walking or step-free accessibility.
- Georeference an old historical map with fabricated exact control points.
- Present the whole planned Heritage Trail as open because it appears on a masterplan.
- Compare planning-area proportions without total population or time reference.
- Publish private household positions, sensitive wildlife locations or API secrets.
Frequently asked questions
What is geospatial science?
The study and use of data about location, spatial relationships, coordinates, maps and geographically distributed processes.
Is GIS the same as reading a normal map?
GIS can store and analyse structured spatial data, sources and geometry, beyond viewing a basemap.
What is OneMap?
SLA’s authoritative Singapore mapping platform with public map tools and documented APIs.
Can OneMap find Punggol addresses?
It provides search and geocoding services for supported roads, addresses and public places, subject to current data and terms.
What is a CRS?
A coordinate reference system that defines how location coordinates relate to Earth or a projected map.
What is WGS84?
A geographic reference system commonly used for latitude and longitude, represented as EPSG:4326.
What is SVY21?
Singapore’s local projected coordinate system, represented as EPSG:3414.
Why can I not interchange latitude with SVY21 X?
They use different definitions and units; valid transformation is required.
What is map scale?
The ratio between a distance shown on a map and the represented ground distance, under the map’s stated projection and conventions.
Is Punggol Waterway Park Connector 8.4km?
NParks lists the named park connector as 8.4km, while a separate nature walk is listed as 4.2km.
Is Punggol Coast MRT the same as Punggol Point LRT?
No. They are separate stations on different operating rail services.
What is graph topology?
The structure of connections among nodes, independently from exact visual distances.
What is a network service area?
The area reachable along an identified transport or pedestrian network under defined travel rules or costs.
Can a circular 500m buffer prove a five-minute walk?
No. Route geometry, crossings, speed, access and conditions matter.
Can I plot an exact historic village home from an old Punggol story map?
Not without evidence sufficient for that precision. Historical maps can be approximate and may predate later land changes.
Does a Punggol Digital District map prove every walkway is open?
No. Planned alignments and current operational access must be checked separately.
Which official source contains Punggol planning-area demographics?
SingStat publishes geographic-distribution datasets, and OneMap documents population-related API services with specific supported years.
Is a population proportion the same as an absolute count?
No. A proportion requires a denominator, and absolute numbers also depend on population size.
Can I make a step-free walking map from ordinary line geometry alone?
Not reliably. You need appropriate verified accessibility attributes and current operational conditions.
Can a student publish an online geospatial atlas?
Yes, using appropriately licensed public data, safe general locations, verified metadata and clear uncertainty labels.
Authoritative mapping sources and related Punggol learning
- Use SLA OneMap to locate a real public destination without guessing coordinates
- Distinguish WGS84 latitude-longitude from Singapore’s SVY21 grid
- Solve a scale and distance problem using the actual Punggol Waterway connector label
- Compare the topology of Punggol MRT and its two LRT loops
- Map a library visitor’s access network rather than drawing a misleading circle
- Test historical georeferencing with NLB’s Punggol Story Map
- Read Punggol Digital District’s planned footprint without assuming every path is open
- Use SingStat planning-area population data without turning polygons into personal profiles
- Evaluate a safe routing map for step-free public access
- Build an ethical geospatial atlas of ten Punggol public facts
- SLA OneMap coordinate conversions
- SLA OneMap population-query coverage and supported years
- JTC open district amenities and trail stages
- Punggol Geography field observations
- Punggol urban planning context
- Graph algorithms and careful data modelling
- Demographic inference and ethics
- eduKateSG step-by-step error repair learning model
The best map identifies both place and uncertainty
Punggol offers a compact introduction to geospatial science because public transport, waterway paths, older names, integrated services and phased new development overlap. Build a small accurate dataset before designing a large map. Check the feature geometry, coordinate reference system, source date and actual access, then repair the first mismatch. Spatial information becomes valuable when it helps a reader act correctly without exposing people or inventing precise locations.
The top 10 things to do in Punggol for Geospatial Science students are to geocode a public destination with SLA OneMap, distinguish WGS84 from SVY21 coordinates, compare official waterway route lengths, model MRT and LRT network topology, learn why a straight-line buffer is not a walking-distance service area, compare historical and present maps, distinguish planned Punggol Digital District geometry from actual access, map SingStat’s planning-area demographics responsibly, design step-free routing constraints and create an ethical ten-feature Punggol map atlas.
Start with OneMap and one known public destination. One Punggol at 1 Punggol Drive offers a verified address, public transport connections and several public services. Use SLA OneMap to look it up, then ask whether a map pin denotes a building, an entrance or a whole site. Do not invent a six-decimal-place coordinate from the centre of a screenshot. The next lesson is the difference between a point location, a route and a district boundary.
This October 2026 guide develops GIS, coordinate systems, map interpretation, routing, georeferencing and ethical spatial data use. It is not a replacement for surveying or a promise of real-time wayfinding. Source facts come from SLA, NParks, LTA, NLB, URA, JTC, SingStat and BCA. Numerical values in classroom examples are explicitly fictional unless attributed to an official route or dataset.
Choose the geospatial skill you need
- Location and geocoding: find a correct public address and state what the returned point means.
- Coordinate systems: distinguish degrees from projected coordinates and document the CRS.
- Map scale: convert units and identify which named route is being measured.
- Networks: model real station connections without assuming equal travel time.
- Accessibility: compare a circular radius with usable walking routes.
- Historical geography: align maps without assigning false modern coordinates to old settlements.
- Urban planning: distinguish a boundary or proposed link from open pedestrian infrastructure.
- Population mapping: preserve time, denominator and area boundaries.
- Cartographic ethics: omit private or sensitive locations and display uncertainty clearly.
The first geospatial question is what geometry represents the thing
A regional library may be shown as a public building point, a footprint polygon or an entrance location. A park connector is a path line rather than one dot. A planning area is an administrative polygon, not a specific household. Each representation supports different questions. A map can be technically valid while answering the wrong problem if it uses a building centroid to promise a wheelchair entrance or a straight-line distance to estimate walking time.
Coordinate metadata matters equally. OneMap documents WGS84 geographic coordinates and Singapore’s SVY21 projected system; confusing their numeric fields can put a point far from the intended location or create invalid positions. Even properly converted coordinates can be uncertain if the underlying input was only a guessed pin. Precision on screen does not establish accuracy on the ground. Students must record the CRS and the feature represented.
Finally, time is part of geography. LTA station services, park gate rules, construction phases and population distributions change. The effective opening of a path is not deduced from a masterplan alone, and a 2020 demographic API table is not automatically current for 2026. A trustworthy geospatial analysis records data currency, source and the status of unverified links.
Ten Punggol geospatial mapping exercises
1. Use SLA OneMap to locate a real public destination without guessing coordinates
Where: One Punggol at 1 Punggol Drive, using OneMap’s authoritative Singapore base map.
The mapping problem
OneMap is Singapore’s authoritative national map produced by SLA, with search and reverse-geocoding services covering local places and addresses. A geospatial student should begin by distinguishing a human-readable address, an officially named building and a coordinate pair. These are related but not identical forms of location information. When an online article calls a place ‘near Punggol MRT’, it has not supplied a precise official coordinate or demonstrated which pedestrian entrance is best. Searching the full verified One Punggol address provides a dependable starting record for map work.
Safe mapping procedure
Open OneMap’s public map or its documented search service and locate 1 Punggol Drive. Record the exact address string returned and the place type, using the name supplied by the source rather than an invented shortened label. Note whether the selected point represents a building, address centroid or entry location; these may differ. Make a screenshot only in accordance with map reuse terms, or draw an original diagram. Create a separate route question such as how a visitor would travel from Punggol MRT, then use routing information rather than a straight line to answer it.
Original worked example
A student uses a map’s display centre to create a latitude and longitude for the library entrance, claiming it is accurate to six decimal places. The point might be the building centre rather than the entrance. The correction records that it is a mapped building location with uncertain doorway precision and consults the venue’s directions for the actual visitor approach. Giving more decimal places does not make an unverified point correct.
A more demanding GIS question
Compare ordinary search with reverse geocoding using a documented public sample point. Ask what happens if two addresses share a large complex or an entrance lies on a different road. Discuss why geocoding results need verification and why a ‘best match’ algorithm can still return the wrong Punggol venue when the name is ambiguous.
Access, accuracy and privacy limits
Do not publish private family addresses or identify the homes of residents. OneMap API use may require account registration and tokens; follow official terms and avoid putting tokens into public WordPress source code.
Official mapping source: Use SLA OneMap to locate a real public destination without guessing coordinates. Check the dataset’s supported dates and licensing.
2. Distinguish WGS84 latitude-longitude from Singapore’s SVY21 grid
Where: A desktop OneMap coordinate-conversion lesson using fictional or OneMap’s own example coordinates.
The mapping problem
OneMap documents coordinate conversions among WGS84 EPSG:4326, SVY21 EPSG:3414 and Web Mercator EPSG:3857. These systems express location in different coordinate spaces. WGS84 provides angular latitude and longitude while Singapore’s SVY21 projected grid expresses easting and northing in a local system. A numeric pair without its coordinate reference system (CRS) can be misplotted or interpreted as an ordinary street distance. Coordinate literacy comes before placing pins on a map.
Safe mapping procedure
Read OneMap’s coordinate-converter page and write a table with the CRS name, EPSG identifier, type of coordinates and broad purpose. Use a documented example supplied by OneMap or a fully fictional point, clearly labelled, rather than a private location. Convert it using the official tool when properly authorised, and check both input order and output labels. For a paper test, compare why a latitude of approximately one degree north does not mean one metre north. Record output precision and note that projection transformations involve definitions and possible rounding.
Original worked example
A developer takes a sample pair labelled X=30,000 and Y=40,000 in SVY21 and pastes it into an application expecting WGS84 latitude and longitude. The point is invalid or misleading because the units and ranges differ. The correction identifies the source CRS and applies the documented transformation before mapping. It avoids treating X and longitude as the same field simply because both are horizontal coordinates.
A more demanding GIS question
Discuss Web Mercator’s visual convenience for online map tiles and its distortions, particularly toward high latitudes. Explain why projected units can be appropriate for local calculations when used correctly, while straight-line distances on an unverified pixel image cannot simply be read as actual walking travel. A good GIS file always documents the original CRS.
Access, accuracy and privacy limits
The OneMap conversion API may require a valid authentication token and has rate limits. Do not publish a token, invent successful transformations or claim a coordinate pair has been surveyed when it came from a simple web map.
Official mapping source: Distinguish WGS84 latitude-longitude from Singapore’s SVY21 grid. Check the dataset’s supported dates and licensing.
3. Solve a scale and distance problem using the actual Punggol Waterway connector label
Where: NParks Punggol Waterway Park and named Punggol Waterway Park Connector.
The mapping problem
NParks describes a 4.2-kilometre Waterway Park nature walk and separately an 8.4-kilometre Punggol Waterway Park Connector. Two nearby geographic features can share words in their titles while having different route extents. A correct geospatial analysis must identify which polyline the number applies to before calculating anything. It also distinguishes geographic distance, traced path length and actual travelled distance when a path is diverted or a visitor takes a side route.
Safe mapping procedure
Read the official pages for both named routes and create a small metadata table with name, source, published length and relevant map description. Convert 4.2km to 4,200m and 8.4km to 8,400m; do not assume their exact geometries or travel overlap from the numerical ratio. On paper draw a hypothetical 1:10,000 route map, where one centimetre represents one hundred metres, then calculate the length represented by a three-centimetre line. Label the paper map illustrative, not a downloaded survey of Punggol.
Original worked example
At 1:10,000 scale, three centimetres on the fictional drawing represent thirty thousand centimetres in the modelled ground, or three hundred metres. A learner first reports thirty kilometres because they multiply without reconciling units. Another learner divides 8.4 by 4.2 and says the connector is exactly two loops of the nature walk. The ratio is two, but the geographic route relationship has not been established. Both errors need different corrections.
A more demanding GIS question
Discuss why a path drawn as several straight segments can underestimate a winding actual route and why GPS traces can contain noise near buildings. Propose a method to compare the official named polyline with a GPS record if the owner had permission and appropriate data, without recording other walkers’ movements.
Access, accuracy and privacy limits
No activity requires the full walk. Do not place measuring tapes or tripods on shared paths, enter water or claim an official map’s dimensions are a current accessibility guarantee on every spur.
Official mapping source: Solve a scale and distance problem using the actual Punggol Waterway connector label. Check the dataset’s supported dates and licensing.
4. Compare the topology of Punggol MRT and its two LRT loops
Where: LTA’s current rail map, Punggol MRT NE17 and Punggol Coast MRT NE18.
The mapping problem
Topological questions concern what is connected to what, not the shape or visual size of a line. Punggol MRT is an interchange with East and West LRT loops, and LTA opened Punggol Coast MRT as the newer North East Line terminal in December 2024. A rail schematic simplifies geographic spacing to make connectivity easier to read. A student can use it to build a network graph while recognising that it is not a real-distance engineering survey or a source of exact train intervals.
Safe mapping procedure
Copy the correctly named operating stops from LTA’s current map and build a small graph with Punggol as a transfer node. Label different services and where a journey requires transferring. Write separate graph edge meanings: adjacency only, fictional equal cost or a documented real travel attribute. Never assign a cost without saying what it measures. Add a test where a user confuses Punggol Point LRT with Punggol Coast MRT and show the correct two different nodes.
Original worked example
A student places Punggol Point and Punggol Coast on one node because both contain the word ‘Punggol’. The resulting path appears to offer a direct transfer that does not exist. The correction assigns their proper LRT and MRT station identities and verifies the operating connection separately. Another error is claiming equal paper distances imply equal train travel time; a schematic is designed primarily for readability.
A more demanding GIS question
Build two small route models: one for fewest transfers and one with hypothetical travel-time weights. Discuss which is useful for a traveller with a stroller or limited stamina. Accessibility requires actual lift and pedestrian conditions, so an algorithm without current information should display uncertainty rather than promise a safe route.
Access, accuracy and privacy limits
Do not copy a 2028 rail masterplan as if every new connection is already operating. Follow current LTA passenger rules and keep algorithms purely educational; they are not real-time journey predictions.
Official mapping source: Compare the topology of Punggol MRT and its two LRT loops. Check the dataset’s supported dates and licensing.
5. Map a library visitor’s access network rather than drawing a misleading circle
Where: Punggol Regional Library at One Punggol and public pedestrian connections.
The mapping problem
GIS analysis often uses a circular buffer around a point to represent proximity, but people travel along paths, crossings, lifts and bridges. A circular half-kilometre buffer is not the same as a five-hundred-metre network service area. This difference matters around an interchange and a waterway, where a destination may appear close across water but require a longer walking route. A geospatial student should choose the representation that matches the decision and identify limitations when accessible paths are not verified.
Safe mapping procedure
Select One Punggol as a clearly named public destination. On an illustrative grid draw a five-hundred-metre radius circle and overlay a small hypothetical walking network containing one waterway and bridge. Count which model points are within the circle but not within five hundred metres of travel along the network. Then consult OneMap’s routing documentation for how actual walking routes might be obtained with proper authorised access. Do not invent a live travel-time metric for a particular resident.
Original worked example
An illustrative student map shows a point four hundred metres away in a straight line but seven hundred metres by a permitted path over a bridge. The circle includes the point; the walking-distance service area does not. Both calculations are internally correct but answer different questions. The correction is choosing the network representation for a visitor-access question and explaining that the data are synthetic.
A more demanding GIS question
Consider that a wheelchair-usable network may require different route attributes, including lifts, slopes or temporary closures, which ordinary map geometry may not provide. Define a rule for unknown accessibility information rather than treating every footpath edge as guaranteed usable. Ask what data would be needed for an evidence-led community access study.
Access, accuracy and privacy limits
Do not use a geospatial buffer to claim a person’s household is within a guaranteed journey time or eligibility catchment. Service access, walkability and legal boundaries require the appropriate official data and conditions.
Official mapping source: Map a library visitor’s access network rather than drawing a misleading circle. Check the dataset’s supported dates and licensing.
6. Test historical georeferencing with NLB’s Punggol Story Map
Where: NLB Curiocity’s Punggol story map and present OneMap geography.
The mapping problem
NLB documents that the historical place name Punggol included areas now associated with parts of Sengkang and Hougang. The story map uses SLA OneMap as its present-day base and draws on historical references, but explicitly says it is not comprehensive for every Punggol building. A historical map is a product of its time, scale and survey purpose. Georeferencing it against a modern map requires control points and careful uncertainty, not simply stretching an image until its road names look familiar.
Safe mapping procedure
Read the story map’s source notes and sketch a two-layer diagram: broad historical place naming and current map boundaries. Identify which features might be stable reference points and which may have changed through reclamation or road realignment. Write a georeferencing proposal listing three candidate control features and reasons each may be unreliable. Do not publish invented precise coordinates for former homes or say that an old village occupies a specific modern block without archival evidence.
Original worked example
A student overlays a crop of a historical Punggol map onto a new development and marks an old house at the entrance of a currently open shop. The old map’s scale and changed landscape do not justify that accuracy. The revised drawing shades an approximate historic context and attaches the archival date and uncertainty. This prevents a classroom GIS output from making a false historical claim.
A more demanding GIS question
Introduce root mean square error qualitatively as a way to assess fit against chosen control points, without inventing an exact calculated figure when points were never georeferenced. Discuss the risk of choosing only control points that support a desired conclusion and why the original map’s provenance must be preserved.
Access, accuracy and privacy limits
Do not use historical maps to navigate through closed construction sites, private buildings or restricted heritage areas. Respect rights in archival cartography and the source’s own stated limitations.
Official mapping source: Test historical georeferencing with NLB’s Punggol Story Map. Check the dataset’s supported dates and licensing.
7. Read Punggol Digital District’s planned footprint without assuming every path is open
Where: URA’s Punggol Digital District urban-design guidelines and JTC’s current public community map.
The mapping problem
URA’s guidelines describe the district as integrating SIT and JTC business-park developments in a transport-oriented, pedestrian-friendly setting. JTC’s current community information identifies operating amenities and the first opened stretch of the planned Heritage Trail. A planning boundary is not the same as an accessible walking route, and a completed transport station does not prove every depicted building phase is open. This is a useful geospatial source test because masterplan polygons and day-of-visit operating conditions answer different questions.
Safe mapping procedure
Read the latest URA boundary and design guidance and JTC’s current community page. Create separate legend classes for existing operating public facility, planned path, construction or unverified area, and district boundary. Mark only those statuses that an official current source supports. If a student wants to plan a walking route, use currently open entrances and paths from the site operator; do not draw a through-route on the masterplan as though the whole network is passable.
Original worked example
A student sees a roughly 1.3km planned Heritage Trail line and publishes a map encouraging visitors to walk its entire alignment. JTC’s current page identifies the first four hundred metres as open. The corrected map colours that section as documented open and leaves other stages unconfirmed. It becomes more useful to visitors without claiming the planning diagram itself was inaccurate.
A more demanding GIS question
Compare a land-use planning polygon with an actual pedestrian route network. Discuss why cadastral boundaries, access rights and physical footpaths may differ. Ask what update metadata a mobile wayfinding product would need to keep visitors from closed paths, and how the map should behave when opening status is unknown.
Access, accuracy and privacy limits
Never enter private SIT rooms, JTC business offices or worksite fences to verify a map. Treat plans, proposed links and actual opening notices as different evidence classes.
Official mapping source: Read Punggol Digital District’s planned footprint without assuming every path is open. Check the dataset’s supported dates and licensing.
8. Use SingStat planning-area population data without turning polygons into personal profiles
Where: SingStat 2026 planning-area demographic tables and OneMap Population Query documentation.
The mapping problem
SingStat releases geographic-distribution data by planning area and subzone, and OneMap documents Population Query endpoints for demographic information. Administrative boundaries are a convenient aggregation, but values for a whole polygon cannot tell us a particular resident’s age, household income or journey habits. A student mapping Punggol must record the reference year and exact boundary used. Furthermore, OneMap’s documented population-query examples may list older available years for particular endpoints; a current 2026 SingStat table is not automatically returned by every API method.
Safe mapping procedure
Choose one publicly released aggregate age statistic in SingStat’s 2026 publication and state its denominator, reference date and geography. Draw two fictional subzones with different population sizes to illustrate why identical colour shading can obscure absolute counts. Create a map legend that says whether colours represent numbers, percentages or categories. When considering OneMap’s API, read the actual documented supported years and response fields instead of silently assuming that every endpoint contains the newest table.
Original worked example
A student colours a hypothetical subzone dark because thirty per cent of its residents are below five, and then writes that it contains more children than a lighter-coloured subzone. Without total populations, that inference is invalid. The correction adds denominators and distinguishes a high share from a large number. The student also refrains from attaching one demographic percentage to a visible household or school group.
A more demanding GIS question
Compare choropleth shading by raw count against shading by proportion. Explain why raw totals can reflect area size or population scale and why rate maps answer different questions. Consider how boundary changes complicate time-series comparisons. Discuss uncertainty, suppression of sensitive small-area data and ethical aggregation choices.
Access, accuracy and privacy limits
Do not attempt to reidentify households through combinations of subzone data and other information. Use authentic dates, official sources and licensing rules. Demographic patterns are group descriptions, not personal dossiers.
Official mapping source: Use SingStat planning-area population data without turning polygons into personal profiles. Check the dataset’s supported dates and licensing.
9. Evaluate a safe routing map for step-free public access
Where: One Punggol, public transport nodes and BCA’s inclusive design principles.
The mapping problem
LTA and PA describe public transport and community-hub access, while BCA sets out Universal Design principles. A geospatial route intended for wheelchair users or visitors with prams needs more than a straight-line location. It may require data on lifts, curb crossings, surface conditions and temporary works. A network can be physically connected while unsuitable for a particular user. Building an ethical map means distinguishing confirmed information from assumed accessibility and never promising an unverified route.
Safe mapping procedure
Create a hypothetical small graph representing station, crossing, lift, hub entrance and library. Mark every link with its information status: verified, unverified or temporarily unavailable. Write a routing rule that refuses to guarantee step-free access when critical link data are missing, and instead prompts for current operator checking. Ask a peer to test the map with a fictional user who prefers rest stops or shelter. Revise labels that assume every user’s priorities are identical.
Original worked example
A route solver chooses the shortest path over a staircase because it has the smallest geometric length. For a user who requires step-free access, the path violates a stated constraint. The corrected graph removes incompatible edges from that hypothetical routing case and returns an alternative only when the necessary information is supported. If no verified path exists in the data, the honest result is ‘route not confirmed’.
A more demanding GIS question
Add a second criterion, such as fewer transfers or a nearby rest area, and discuss why accessibility is not one universal preference. Test the effect of a fictional lift outage while making clear that no real lift status has been measured. Explain why a user-facing interface should identify data currency and offer authorised updates.
Access, accuracy and privacy limits
Do not simulate a disability by using another person’s mobility aid, obstruct a lift for testing or invent current accessible-route conditions. Compliance determinations are professional matters; a student graph is an educational prototype.
Official mapping source: Evaluate a safe routing map for step-free public access. Check the dataset’s supported dates and licensing.
10. Build an ethical geospatial atlas of ten Punggol public facts
Where: A desk project using authoritative OneMap, NParks, LTA, NLB and JTC sources.
The mapping problem
A useful map atlas is a documented dataset, not just ten colourful pins. Each feature should have a verified locator, exact name, geometry type, source, last-check date, public access status and uncertainty. Punggol provides a diverse set: one integrated hub, a rail interchange, a newer terminal, a waterway path, a coastal park and a conserved structure. A student learns spatial data modelling by choosing appropriate points, lines and polygons for what the subject actually represents.
Safe mapping procedure
Select no more than ten publicly named Punggol features whose locations are supported by official sources. For each decide whether the map should represent a point, line or area. Keep exact private addresses, schoolchildren’s locations and sensitive wildlife points out of the atlas. Record sources and avoid applying one shared ‘open now’ status to every feature. Make a simple legend and ask a first-time reader to explain whether the line represents a trail, transit link, road or planning boundary. Correct any ambiguous symbol before publishing.
Original worked example
A student places a single dot labelled ‘8.4km Punggol Waterway Park Connector’ and claims the point is the whole route. A point might be useful as a locator or entrance, but the connector’s spatial extent is a line or route. The corrected atlas either uses an appropriately sourced polyline or labels the dot as a representative entrance, with the limitation clearly stated. This is a fundamental geometry-type repair.
A more demanding GIS question
Audit four error classes: ambiguous name, incorrect coordinate reference system, stale operating status and unsupported attribution. Create a version log and explain which errors could cause an inconvenient trip versus a serious safety problem. Consider map generalisation: on a small-scale printed map some detail must be omitted, but omission should not falsely turn planned routes into open ones.
Access, accuracy and privacy limits
Respect data licensing, avoid embedding OneMap credentials in public files and do not present hypothetical positions as official surveyed coordinates. Any map that names public services should be reviewed against current source and site access before distribution.
Official mapping source: Build an ethical geospatial atlas of ten Punggol public facts. Check the dataset’s supported dates and licensing.
A practical GIS data model
Create a table with a feature identifier, feature name, type, geometry, coordinate reference system, original source, as-of date, access condition and uncertainty. Keep the first version small. If a row represents Punggol Waterway Park Connector, type should indicate a route or line; if it represents One Punggol’s public address, identify whether the point is a public locator or a precise entrance. A record without a source or CRS should be treated as incomplete for a technical project.
Students can test the schema without collecting real coordinates. Use dummy geometries and compare how a routing graph fails when a nonexistent connection is inserted. Test a missing publication date, conflicting place names and an assumed open route. The error messages should identify which field needs checking, not silently fill it from guesses. A technically correct GeoJSON file can still carry false geographic claims, so content validation is essential.
Three Punggol geospatial study itineraries
A forty-five-minute OneMap desk session
Read OneMap’s main documentation, search for a genuine public destination, and identify what its location record refers to. Then study the coordinate conversion page and draw an input-output flow showing WGS84, SVY21 and Web Mercator. Use OneMap’s documented sample values rather than private home coordinates. End by explaining why a point’s CRS and object type are necessary to use it correctly.
A park-route comparison on paper
Read NParks’ descriptions of the 4.2km nature walk and 8.4km park connector. Create two independent records and a small map legend. Show an illustrative short public walking segment with a return route, and distinguish the length traced on paper from the official published route length. Do not force a long site visit or claim that both NParks distances describe the same exact polyline.
An urban change and accessibility atlas
Use URA and JTC to mark documented public amenities and planned district links. Add LTA’s Punggol Coast station as a confirmed operating rail node, and include NLB’s historical map as a separate dated interpretive layer. Test one fictional wheelchair access case using a graph whose link status may be unknown. Keep proposed features and unverified accessible paths clearly labelled instead of treating every line as ready to use.
Ten geospatial mistakes worth correcting before publication
- Map a building centroid as though it is a verified public entrance.
- Confuse WGS84 degrees with SVY21 or Web Mercator projected coordinates.
- Use extra decimal places as a substitute for locating the correct feature.
- Treat a schematic train map as a geographic scale drawing.
- Confuse 4.2km park nature walk and 8.4km park connector as one route.
- Use a straight-line buffer as proof of walking or step-free accessibility.
- Georeference an old historical map with fabricated exact control points.
- Present the whole planned Heritage Trail as open because it appears on a masterplan.
- Compare planning-area proportions without total population or time reference.
- Publish private household positions, sensitive wildlife locations or API secrets.
Frequently asked questions
What is geospatial science?
The study and use of data about location, spatial relationships, coordinates, maps and geographically distributed processes.
Is GIS the same as reading a normal map?
GIS can store and analyse structured spatial data, sources and geometry, beyond viewing a basemap.
What is OneMap?
SLA’s authoritative Singapore mapping platform with public map tools and documented APIs.
Can OneMap find Punggol addresses?
It provides search and geocoding services for supported roads, addresses and public places, subject to current data and terms.
What is a CRS?
A coordinate reference system that defines how location coordinates relate to Earth or a projected map.
What is WGS84?
A geographic reference system commonly used for latitude and longitude, represented as EPSG:4326.
What is SVY21?
Singapore’s local projected coordinate system, represented as EPSG:3414.
Why can I not interchange latitude with SVY21 X?
They use different definitions and units; valid transformation is required.
What is map scale?
The ratio between a distance shown on a map and the represented ground distance, under the map’s stated projection and conventions.
Is Punggol Waterway Park Connector 8.4km?
NParks lists the named park connector as 8.4km, while a separate nature walk is listed as 4.2km.
Is Punggol Coast MRT the same as Punggol Point LRT?
No. They are separate stations on different operating rail services.
What is graph topology?
The structure of connections among nodes, independently from exact visual distances.
What is a network service area?
The area reachable along an identified transport or pedestrian network under defined travel rules or costs.
Can a circular 500m buffer prove a five-minute walk?
No. Route geometry, crossings, speed, access and conditions matter.
Can I plot an exact historic village home from an old Punggol story map?
Not without evidence sufficient for that precision. Historical maps can be approximate and may predate later land changes.
Does a Punggol Digital District map prove every walkway is open?
No. Planned alignments and current operational access must be checked separately.
Which official source contains Punggol planning-area demographics?
SingStat publishes geographic-distribution datasets, and OneMap documents population-related API services with specific supported years.
Is a population proportion the same as an absolute count?
No. A proportion requires a denominator, and absolute numbers also depend on population size.
Can I make a step-free walking map from ordinary line geometry alone?
Not reliably. You need appropriate verified accessibility attributes and current operational conditions.
Can a student publish an online geospatial atlas?
Yes, using appropriately licensed public data, safe general locations, verified metadata and clear uncertainty labels.
Authoritative mapping sources and related Punggol learning
- Use SLA OneMap to locate a real public destination without guessing coordinates
- Distinguish WGS84 latitude-longitude from Singapore’s SVY21 grid
- Solve a scale and distance problem using the actual Punggol Waterway connector label
- Compare the topology of Punggol MRT and its two LRT loops
- Map a library visitor’s access network rather than drawing a misleading circle
- Test historical georeferencing with NLB’s Punggol Story Map
- Read Punggol Digital District’s planned footprint without assuming every path is open
- Use SingStat planning-area population data without turning polygons into personal profiles
- Evaluate a safe routing map for step-free public access
- Build an ethical geospatial atlas of ten Punggol public facts
- SLA OneMap coordinate conversions
- SLA OneMap population-query coverage and supported years
- JTC open district amenities and trail stages
- Punggol Geography field observations
- Punggol urban planning context
- Graph algorithms and careful data modelling
- Demographic inference and ethics
- eduKateSG step-by-step error repair learning model
The best map identifies both place and uncertainty
Punggol offers a compact introduction to geospatial science because public transport, waterway paths, older names, integrated services and phased new development overlap. Build a small accurate dataset before designing a large map. Check the feature geometry, coordinate reference system, source date and actual access, then repair the first mismatch. Spatial information becomes valuable when it helps a reader act correctly without exposing people or inventing precise locations.
The top 10 things to do in Punggol for Geospatial Science students are to geocode a public destination with SLA OneMap, distinguish WGS84 from SVY21 coordinates, compare official waterway route lengths, model MRT and LRT network topology, learn why a straight-line buffer is not a walking-distance service area, compare historical and present maps, distinguish planned Punggol Digital District geometry from actual access, map SingStat’s planning-area demographics responsibly, design step-free routing constraints and create an ethical ten-feature Punggol map atlas.
Start with OneMap and one known public destination. One Punggol at 1 Punggol Drive offers a verified address, public transport connections and several public services. Use SLA OneMap to look it up, then ask whether a map pin denotes a building, an entrance or a whole site. Do not invent a six-decimal-place coordinate from the centre of a screenshot. The next lesson is the difference between a point location, a route and a district boundary.
This October 2026 guide develops GIS, coordinate systems, map interpretation, routing, georeferencing and ethical spatial data use. It is not a replacement for surveying or a promise of real-time wayfinding. Source facts come from SLA, NParks, LTA, NLB, URA, JTC, SingStat and BCA. Numerical values in classroom examples are explicitly fictional unless attributed to an official route or dataset.
Choose the geospatial skill you need
- Location and geocoding: find a correct public address and state what the returned point means.
- Coordinate systems: distinguish degrees from projected coordinates and document the CRS.
- Map scale: convert units and identify which named route is being measured.
- Networks: model real station connections without assuming equal travel time.
- Accessibility: compare a circular radius with usable walking routes.
- Historical geography: align maps without assigning false modern coordinates to old settlements.
- Urban planning: distinguish a boundary or proposed link from open pedestrian infrastructure.
- Population mapping: preserve time, denominator and area boundaries.
- Cartographic ethics: omit private or sensitive locations and display uncertainty clearly.
The first geospatial question is what geometry represents the thing
A regional library may be shown as a public building point, a footprint polygon or an entrance location. A park connector is a path line rather than one dot. A planning area is an administrative polygon, not a specific household. Each representation supports different questions. A map can be technically valid while answering the wrong problem if it uses a building centroid to promise a wheelchair entrance or a straight-line distance to estimate walking time.
Coordinate metadata matters equally. OneMap documents WGS84 geographic coordinates and Singapore’s SVY21 projected system; confusing their numeric fields can put a point far from the intended location or create invalid positions. Even properly converted coordinates can be uncertain if the underlying input was only a guessed pin. Precision on screen does not establish accuracy on the ground. Students must record the CRS and the feature represented.
Finally, time is part of geography. LTA station services, park gate rules, construction phases and population distributions change. The effective opening of a path is not deduced from a masterplan alone, and a 2020 demographic API table is not automatically current for 2026. A trustworthy geospatial analysis records data currency, source and the status of unverified links.
Ten Punggol geospatial mapping exercises
1. Use SLA OneMap to locate a real public destination without guessing coordinates
Where: One Punggol at 1 Punggol Drive, using OneMap’s authoritative Singapore base map.
The mapping problem
OneMap is Singapore’s authoritative national map produced by SLA, with search and reverse-geocoding services covering local places and addresses. A geospatial student should begin by distinguishing a human-readable address, an officially named building and a coordinate pair. These are related but not identical forms of location information. When an online article calls a place ‘near Punggol MRT’, it has not supplied a precise official coordinate or demonstrated which pedestrian entrance is best. Searching the full verified One Punggol address provides a dependable starting record for map work.
Safe mapping procedure
Open OneMap’s public map or its documented search service and locate 1 Punggol Drive. Record the exact address string returned and the place type, using the name supplied by the source rather than an invented shortened label. Note whether the selected point represents a building, address centroid or entry location; these may differ. Make a screenshot only in accordance with map reuse terms, or draw an original diagram. Create a separate route question such as how a visitor would travel from Punggol MRT, then use routing information rather than a straight line to answer it.
Original worked example
A student uses a map’s display centre to create a latitude and longitude for the library entrance, claiming it is accurate to six decimal places. The point might be the building centre rather than the entrance. The correction records that it is a mapped building location with uncertain doorway precision and consults the venue’s directions for the actual visitor approach. Giving more decimal places does not make an unverified point correct.
A more demanding GIS question
Compare ordinary search with reverse geocoding using a documented public sample point. Ask what happens if two addresses share a large complex or an entrance lies on a different road. Discuss why geocoding results need verification and why a ‘best match’ algorithm can still return the wrong Punggol venue when the name is ambiguous.
Access, accuracy and privacy limits
Do not publish private family addresses or identify the homes of residents. OneMap API use may require account registration and tokens; follow official terms and avoid putting tokens into public WordPress source code.
Official mapping source: Use SLA OneMap to locate a real public destination without guessing coordinates. Check the dataset’s supported dates and licensing.
2. Distinguish WGS84 latitude-longitude from Singapore’s SVY21 grid
Where: A desktop OneMap coordinate-conversion lesson using fictional or OneMap’s own example coordinates.
The mapping problem
OneMap documents coordinate conversions among WGS84 EPSG:4326, SVY21 EPSG:3414 and Web Mercator EPSG:3857. These systems express location in different coordinate spaces. WGS84 provides angular latitude and longitude while Singapore’s SVY21 projected grid expresses easting and northing in a local system. A numeric pair without its coordinate reference system (CRS) can be misplotted or interpreted as an ordinary street distance. Coordinate literacy comes before placing pins on a map.
Safe mapping procedure
Read OneMap’s coordinate-converter page and write a table with the CRS name, EPSG identifier, type of coordinates and broad purpose. Use a documented example supplied by OneMap or a fully fictional point, clearly labelled, rather than a private location. Convert it using the official tool when properly authorised, and check both input order and output labels. For a paper test, compare why a latitude of approximately one degree north does not mean one metre north. Record output precision and note that projection transformations involve definitions and possible rounding.
Original worked example
A developer takes a sample pair labelled X=30,000 and Y=40,000 in SVY21 and pastes it into an application expecting WGS84 latitude and longitude. The point is invalid or misleading because the units and ranges differ. The correction identifies the source CRS and applies the documented transformation before mapping. It avoids treating X and longitude as the same field simply because both are horizontal coordinates.
A more demanding GIS question
Discuss Web Mercator’s visual convenience for online map tiles and its distortions, particularly toward high latitudes. Explain why projected units can be appropriate for local calculations when used correctly, while straight-line distances on an unverified pixel image cannot simply be read as actual walking travel. A good GIS file always documents the original CRS.
Access, accuracy and privacy limits
The OneMap conversion API may require a valid authentication token and has rate limits. Do not publish a token, invent successful transformations or claim a coordinate pair has been surveyed when it came from a simple web map.
Official mapping source: Distinguish WGS84 latitude-longitude from Singapore’s SVY21 grid. Check the dataset’s supported dates and licensing.
3. Solve a scale and distance problem using the actual Punggol Waterway connector label
Where: NParks Punggol Waterway Park and named Punggol Waterway Park Connector.
The mapping problem
NParks describes a 4.2-kilometre Waterway Park nature walk and separately an 8.4-kilometre Punggol Waterway Park Connector. Two nearby geographic features can share words in their titles while having different route extents. A correct geospatial analysis must identify which polyline the number applies to before calculating anything. It also distinguishes geographic distance, traced path length and actual travelled distance when a path is diverted or a visitor takes a side route.
Safe mapping procedure
Read the official pages for both named routes and create a small metadata table with name, source, published length and relevant map description. Convert 4.2km to 4,200m and 8.4km to 8,400m; do not assume their exact geometries or travel overlap from the numerical ratio. On paper draw a hypothetical 1:10,000 route map, where one centimetre represents one hundred metres, then calculate the length represented by a three-centimetre line. Label the paper map illustrative, not a downloaded survey of Punggol.
Original worked example
At 1:10,000 scale, three centimetres on the fictional drawing represent thirty thousand centimetres in the modelled ground, or three hundred metres. A learner first reports thirty kilometres because they multiply without reconciling units. Another learner divides 8.4 by 4.2 and says the connector is exactly two loops of the nature walk. The ratio is two, but the geographic route relationship has not been established. Both errors need different corrections.
A more demanding GIS question
Discuss why a path drawn as several straight segments can underestimate a winding actual route and why GPS traces can contain noise near buildings. Propose a method to compare the official named polyline with a GPS record if the owner had permission and appropriate data, without recording other walkers’ movements.
Access, accuracy and privacy limits
No activity requires the full walk. Do not place measuring tapes or tripods on shared paths, enter water or claim an official map’s dimensions are a current accessibility guarantee on every spur.
Official mapping source: Solve a scale and distance problem using the actual Punggol Waterway connector label. Check the dataset’s supported dates and licensing.
4. Compare the topology of Punggol MRT and its two LRT loops
Where: LTA’s current rail map, Punggol MRT NE17 and Punggol Coast MRT NE18.
The mapping problem
Topological questions concern what is connected to what, not the shape or visual size of a line. Punggol MRT is an interchange with East and West LRT loops, and LTA opened Punggol Coast MRT as the newer North East Line terminal in December 2024. A rail schematic simplifies geographic spacing to make connectivity easier to read. A student can use it to build a network graph while recognising that it is not a real-distance engineering survey or a source of exact train intervals.
Safe mapping procedure
Copy the correctly named operating stops from LTA’s current map and build a small graph with Punggol as a transfer node. Label different services and where a journey requires transferring. Write separate graph edge meanings: adjacency only, fictional equal cost or a documented real travel attribute. Never assign a cost without saying what it measures. Add a test where a user confuses Punggol Point LRT with Punggol Coast MRT and show the correct two different nodes.
Original worked example
A student places Punggol Point and Punggol Coast on one node because both contain the word ‘Punggol’. The resulting path appears to offer a direct transfer that does not exist. The correction assigns their proper LRT and MRT station identities and verifies the operating connection separately. Another error is claiming equal paper distances imply equal train travel time; a schematic is designed primarily for readability.
A more demanding GIS question
Build two small route models: one for fewest transfers and one with hypothetical travel-time weights. Discuss which is useful for a traveller with a stroller or limited stamina. Accessibility requires actual lift and pedestrian conditions, so an algorithm without current information should display uncertainty rather than promise a safe route.
Access, accuracy and privacy limits
Do not copy a 2028 rail masterplan as if every new connection is already operating. Follow current LTA passenger rules and keep algorithms purely educational; they are not real-time journey predictions.
Official mapping source: Compare the topology of Punggol MRT and its two LRT loops. Check the dataset’s supported dates and licensing.
5. Map a library visitor’s access network rather than drawing a misleading circle
Where: Punggol Regional Library at One Punggol and public pedestrian connections.
The mapping problem
GIS analysis often uses a circular buffer around a point to represent proximity, but people travel along paths, crossings, lifts and bridges. A circular half-kilometre buffer is not the same as a five-hundred-metre network service area. This difference matters around an interchange and a waterway, where a destination may appear close across water but require a longer walking route. A geospatial student should choose the representation that matches the decision and identify limitations when accessible paths are not verified.
Safe mapping procedure
Select One Punggol as a clearly named public destination. On an illustrative grid draw a five-hundred-metre radius circle and overlay a small hypothetical walking network containing one waterway and bridge. Count which model points are within the circle but not within five hundred metres of travel along the network. Then consult OneMap’s routing documentation for how actual walking routes might be obtained with proper authorised access. Do not invent a live travel-time metric for a particular resident.
Original worked example
An illustrative student map shows a point four hundred metres away in a straight line but seven hundred metres by a permitted path over a bridge. The circle includes the point; the walking-distance service area does not. Both calculations are internally correct but answer different questions. The correction is choosing the network representation for a visitor-access question and explaining that the data are synthetic.
A more demanding GIS question
Consider that a wheelchair-usable network may require different route attributes, including lifts, slopes or temporary closures, which ordinary map geometry may not provide. Define a rule for unknown accessibility information rather than treating every footpath edge as guaranteed usable. Ask what data would be needed for an evidence-led community access study.
Access, accuracy and privacy limits
Do not use a geospatial buffer to claim a person’s household is within a guaranteed journey time or eligibility catchment. Service access, walkability and legal boundaries require the appropriate official data and conditions.
Official mapping source: Map a library visitor’s access network rather than drawing a misleading circle. Check the dataset’s supported dates and licensing.
6. Test historical georeferencing with NLB’s Punggol Story Map
Where: NLB Curiocity’s Punggol story map and present OneMap geography.
The mapping problem
NLB documents that the historical place name Punggol included areas now associated with parts of Sengkang and Hougang. The story map uses SLA OneMap as its present-day base and draws on historical references, but explicitly says it is not comprehensive for every Punggol building. A historical map is a product of its time, scale and survey purpose. Georeferencing it against a modern map requires control points and careful uncertainty, not simply stretching an image until its road names look familiar.
Safe mapping procedure
Read the story map’s source notes and sketch a two-layer diagram: broad historical place naming and current map boundaries. Identify which features might be stable reference points and which may have changed through reclamation or road realignment. Write a georeferencing proposal listing three candidate control features and reasons each may be unreliable. Do not publish invented precise coordinates for former homes or say that an old village occupies a specific modern block without archival evidence.
Original worked example
A student overlays a crop of a historical Punggol map onto a new development and marks an old house at the entrance of a currently open shop. The old map’s scale and changed landscape do not justify that accuracy. The revised drawing shades an approximate historic context and attaches the archival date and uncertainty. This prevents a classroom GIS output from making a false historical claim.
A more demanding GIS question
Introduce root mean square error qualitatively as a way to assess fit against chosen control points, without inventing an exact calculated figure when points were never georeferenced. Discuss the risk of choosing only control points that support a desired conclusion and why the original map’s provenance must be preserved.
Access, accuracy and privacy limits
Do not use historical maps to navigate through closed construction sites, private buildings or restricted heritage areas. Respect rights in archival cartography and the source’s own stated limitations.
Official mapping source: Test historical georeferencing with NLB’s Punggol Story Map. Check the dataset’s supported dates and licensing.
7. Read Punggol Digital District’s planned footprint without assuming every path is open
Where: URA’s Punggol Digital District urban-design guidelines and JTC’s current public community map.
The mapping problem
URA’s guidelines describe the district as integrating SIT and JTC business-park developments in a transport-oriented, pedestrian-friendly setting. JTC’s current community information identifies operating amenities and the first opened stretch of the planned Heritage Trail. A planning boundary is not the same as an accessible walking route, and a completed transport station does not prove every depicted building phase is open. This is a useful geospatial source test because masterplan polygons and day-of-visit operating conditions answer different questions.
Safe mapping procedure
Read the latest URA boundary and design guidance and JTC’s current community page. Create separate legend classes for existing operating public facility, planned path, construction or unverified area, and district boundary. Mark only those statuses that an official current source supports. If a student wants to plan a walking route, use currently open entrances and paths from the site operator; do not draw a through-route on the masterplan as though the whole network is passable.
Original worked example
A student sees a roughly 1.3km planned Heritage Trail line and publishes a map encouraging visitors to walk its entire alignment. JTC’s current page identifies the first four hundred metres as open. The corrected map colours that section as documented open and leaves other stages unconfirmed. It becomes more useful to visitors without claiming the planning diagram itself was inaccurate.
A more demanding GIS question
Compare a land-use planning polygon with an actual pedestrian route network. Discuss why cadastral boundaries, access rights and physical footpaths may differ. Ask what update metadata a mobile wayfinding product would need to keep visitors from closed paths, and how the map should behave when opening status is unknown.
Access, accuracy and privacy limits
Never enter private SIT rooms, JTC business offices or worksite fences to verify a map. Treat plans, proposed links and actual opening notices as different evidence classes.
Official mapping source: Read Punggol Digital District’s planned footprint without assuming every path is open. Check the dataset’s supported dates and licensing.
8. Use SingStat planning-area population data without turning polygons into personal profiles
Where: SingStat 2026 planning-area demographic tables and OneMap Population Query documentation.
The mapping problem
SingStat releases geographic-distribution data by planning area and subzone, and OneMap documents Population Query endpoints for demographic information. Administrative boundaries are a convenient aggregation, but values for a whole polygon cannot tell us a particular resident’s age, household income or journey habits. A student mapping Punggol must record the reference year and exact boundary used. Furthermore, OneMap’s documented population-query examples may list older available years for particular endpoints; a current 2026 SingStat table is not automatically returned by every API method.
Safe mapping procedure
Choose one publicly released aggregate age statistic in SingStat’s 2026 publication and state its denominator, reference date and geography. Draw two fictional subzones with different population sizes to illustrate why identical colour shading can obscure absolute counts. Create a map legend that says whether colours represent numbers, percentages or categories. When considering OneMap’s API, read the actual documented supported years and response fields instead of silently assuming that every endpoint contains the newest table.
Original worked example
A student colours a hypothetical subzone dark because thirty per cent of its residents are below five, and then writes that it contains more children than a lighter-coloured subzone. Without total populations, that inference is invalid. The correction adds denominators and distinguishes a high share from a large number. The student also refrains from attaching one demographic percentage to a visible household or school group.
A more demanding GIS question
Compare choropleth shading by raw count against shading by proportion. Explain why raw totals can reflect area size or population scale and why rate maps answer different questions. Consider how boundary changes complicate time-series comparisons. Discuss uncertainty, suppression of sensitive small-area data and ethical aggregation choices.
Access, accuracy and privacy limits
Do not attempt to reidentify households through combinations of subzone data and other information. Use authentic dates, official sources and licensing rules. Demographic patterns are group descriptions, not personal dossiers.
Official mapping source: Use SingStat planning-area population data without turning polygons into personal profiles. Check the dataset’s supported dates and licensing.
9. Evaluate a safe routing map for step-free public access
Where: One Punggol, public transport nodes and BCA’s inclusive design principles.
The mapping problem
LTA and PA describe public transport and community-hub access, while BCA sets out Universal Design principles. A geospatial route intended for wheelchair users or visitors with prams needs more than a straight-line location. It may require data on lifts, curb crossings, surface conditions and temporary works. A network can be physically connected while unsuitable for a particular user. Building an ethical map means distinguishing confirmed information from assumed accessibility and never promising an unverified route.
Safe mapping procedure
Create a hypothetical small graph representing station, crossing, lift, hub entrance and library. Mark every link with its information status: verified, unverified or temporarily unavailable. Write a routing rule that refuses to guarantee step-free access when critical link data are missing, and instead prompts for current operator checking. Ask a peer to test the map with a fictional user who prefers rest stops or shelter. Revise labels that assume every user’s priorities are identical.
Original worked example
A route solver chooses the shortest path over a staircase because it has the smallest geometric length. For a user who requires step-free access, the path violates a stated constraint. The corrected graph removes incompatible edges from that hypothetical routing case and returns an alternative only when the necessary information is supported. If no verified path exists in the data, the honest result is ‘route not confirmed’.
A more demanding GIS question
Add a second criterion, such as fewer transfers or a nearby rest area, and discuss why accessibility is not one universal preference. Test the effect of a fictional lift outage while making clear that no real lift status has been measured. Explain why a user-facing interface should identify data currency and offer authorised updates.
Access, accuracy and privacy limits
Do not simulate a disability by using another person’s mobility aid, obstruct a lift for testing or invent current accessible-route conditions. Compliance determinations are professional matters; a student graph is an educational prototype.
Official mapping source: Evaluate a safe routing map for step-free public access. Check the dataset’s supported dates and licensing.
10. Build an ethical geospatial atlas of ten Punggol public facts
Where: A desk project using authoritative OneMap, NParks, LTA, NLB and JTC sources.
The mapping problem
A useful map atlas is a documented dataset, not just ten colourful pins. Each feature should have a verified locator, exact name, geometry type, source, last-check date, public access status and uncertainty. Punggol provides a diverse set: one integrated hub, a rail interchange, a newer terminal, a waterway path, a coastal park and a conserved structure. A student learns spatial data modelling by choosing appropriate points, lines and polygons for what the subject actually represents.
Safe mapping procedure
Select no more than ten publicly named Punggol features whose locations are supported by official sources. For each decide whether the map should represent a point, line or area. Keep exact private addresses, schoolchildren’s locations and sensitive wildlife points out of the atlas. Record sources and avoid applying one shared ‘open now’ status to every feature. Make a simple legend and ask a first-time reader to explain whether the line represents a trail, transit link, road or planning boundary. Correct any ambiguous symbol before publishing.
Original worked example
A student places a single dot labelled ‘8.4km Punggol Waterway Park Connector’ and claims the point is the whole route. A point might be useful as a locator or entrance, but the connector’s spatial extent is a line or route. The corrected atlas either uses an appropriately sourced polyline or labels the dot as a representative entrance, with the limitation clearly stated. This is a fundamental geometry-type repair.
A more demanding GIS question
Audit four error classes: ambiguous name, incorrect coordinate reference system, stale operating status and unsupported attribution. Create a version log and explain which errors could cause an inconvenient trip versus a serious safety problem. Consider map generalisation: on a small-scale printed map some detail must be omitted, but omission should not falsely turn planned routes into open ones.
Access, accuracy and privacy limits
Respect data licensing, avoid embedding OneMap credentials in public files and do not present hypothetical positions as official surveyed coordinates. Any map that names public services should be reviewed against current source and site access before distribution.
Official mapping source: Build an ethical geospatial atlas of ten Punggol public facts. Check the dataset’s supported dates and licensing.
A practical GIS data model
Create a table with a feature identifier, feature name, type, geometry, coordinate reference system, original source, as-of date, access condition and uncertainty. Keep the first version small. If a row represents Punggol Waterway Park Connector, type should indicate a route or line; if it represents One Punggol’s public address, identify whether the point is a public locator or a precise entrance. A record without a source or CRS should be treated as incomplete for a technical project.
Students can test the schema without collecting real coordinates. Use dummy geometries and compare how a routing graph fails when a nonexistent connection is inserted. Test a missing publication date, conflicting place names and an assumed open route. The error messages should identify which field needs checking, not silently fill it from guesses. A technically correct GeoJSON file can still carry false geographic claims, so content validation is essential.
Three Punggol geospatial study itineraries
A forty-five-minute OneMap desk session
Read OneMap’s main documentation, search for a genuine public destination, and identify what its location record refers to. Then study the coordinate conversion page and draw an input-output flow showing WGS84, SVY21 and Web Mercator. Use OneMap’s documented sample values rather than private home coordinates. End by explaining why a point’s CRS and object type are necessary to use it correctly.
A park-route comparison on paper
Read NParks’ descriptions of the 4.2km nature walk and 8.4km park connector. Create two independent records and a small map legend. Show an illustrative short public walking segment with a return route, and distinguish the length traced on paper from the official published route length. Do not force a long site visit or claim that both NParks distances describe the same exact polyline.
An urban change and accessibility atlas
Use URA and JTC to mark documented public amenities and planned district links. Add LTA’s Punggol Coast station as a confirmed operating rail node, and include NLB’s historical map as a separate dated interpretive layer. Test one fictional wheelchair access case using a graph whose link status may be unknown. Keep proposed features and unverified accessible paths clearly labelled instead of treating every line as ready to use.
Ten geospatial mistakes worth correcting before publication
- Map a building centroid as though it is a verified public entrance.
- Confuse WGS84 degrees with SVY21 or Web Mercator projected coordinates.
- Use extra decimal places as a substitute for locating the correct feature.
- Treat a schematic train map as a geographic scale drawing.
- Confuse 4.2km park nature walk and 8.4km park connector as one route.
- Use a straight-line buffer as proof of walking or step-free accessibility.
- Georeference an old historical map with fabricated exact control points.
- Present the whole planned Heritage Trail as open because it appears on a masterplan.
- Compare planning-area proportions without total population or time reference.
- Publish private household positions, sensitive wildlife locations or API secrets.
Frequently asked questions
What is geospatial science?
The study and use of data about location, spatial relationships, coordinates, maps and geographically distributed processes.
Is GIS the same as reading a normal map?
GIS can store and analyse structured spatial data, sources and geometry, beyond viewing a basemap.
What is OneMap?
SLA’s authoritative Singapore mapping platform with public map tools and documented APIs.
Can OneMap find Punggol addresses?
It provides search and geocoding services for supported roads, addresses and public places, subject to current data and terms.
What is a CRS?
A coordinate reference system that defines how location coordinates relate to Earth or a projected map.
What is WGS84?
A geographic reference system commonly used for latitude and longitude, represented as EPSG:4326.
What is SVY21?
Singapore’s local projected coordinate system, represented as EPSG:3414.
Why can I not interchange latitude with SVY21 X?
They use different definitions and units; valid transformation is required.
What is map scale?
The ratio between a distance shown on a map and the represented ground distance, under the map’s stated projection and conventions.
Is Punggol Waterway Park Connector 8.4km?
NParks lists the named park connector as 8.4km, while a separate nature walk is listed as 4.2km.
Is Punggol Coast MRT the same as Punggol Point LRT?
No. They are separate stations on different operating rail services.
What is graph topology?
The structure of connections among nodes, independently from exact visual distances.
What is a network service area?
The area reachable along an identified transport or pedestrian network under defined travel rules or costs.
Can a circular 500m buffer prove a five-minute walk?
No. Route geometry, crossings, speed, access and conditions matter.
Can I plot an exact historic village home from an old Punggol story map?
Not without evidence sufficient for that precision. Historical maps can be approximate and may predate later land changes.
Does a Punggol Digital District map prove every walkway is open?
No. Planned alignments and current operational access must be checked separately.
Which official source contains Punggol planning-area demographics?
SingStat publishes geographic-distribution datasets, and OneMap documents population-related API services with specific supported years.
Is a population proportion the same as an absolute count?
No. A proportion requires a denominator, and absolute numbers also depend on population size.
Can I make a step-free walking map from ordinary line geometry alone?
Not reliably. You need appropriate verified accessibility attributes and current operational conditions.
Can a student publish an online geospatial atlas?
Yes, using appropriately licensed public data, safe general locations, verified metadata and clear uncertainty labels.
Authoritative mapping sources and related Punggol learning
- Use SLA OneMap to locate a real public destination without guessing coordinates
- Distinguish WGS84 latitude-longitude from Singapore’s SVY21 grid
- Solve a scale and distance problem using the actual Punggol Waterway connector label
- Compare the topology of Punggol MRT and its two LRT loops
- Map a library visitor’s access network rather than drawing a misleading circle
- Test historical georeferencing with NLB’s Punggol Story Map
- Read Punggol Digital District’s planned footprint without assuming every path is open
- Use SingStat planning-area population data without turning polygons into personal profiles
- Evaluate a safe routing map for step-free public access
- Build an ethical geospatial atlas of ten Punggol public facts
- SLA OneMap coordinate conversions
- SLA OneMap population-query coverage and supported years
- JTC open district amenities and trail stages
- Punggol Geography field observations
- Punggol urban planning context
- Graph algorithms and careful data modelling
- Demographic inference and ethics
- eduKateSG step-by-step error repair learning model
The best map identifies both place and uncertainty
Punggol offers a compact introduction to geospatial science because public transport, waterway paths, older names, integrated services and phased new development overlap. Build a small accurate dataset before designing a large map. Check the feature geometry, coordinate reference system, source date and actual access, then repair the first mismatch. Spatial information becomes valuable when it helps a reader act correctly without exposing people or inventing precise locations.
The top 10 things to do in Punggol for Geospatial Science students are to geocode a public destination with SLA OneMap, distinguish WGS84 from SVY21 coordinates, compare official waterway route lengths, model MRT and LRT network topology, learn why a straight-line buffer is not a walking-distance service area, compare historical and present maps, distinguish planned Punggol Digital District geometry from actual access, map SingStat’s planning-area demographics responsibly, design step-free routing constraints and create an ethical ten-feature Punggol map atlas.
Start with OneMap and one known public destination. One Punggol at 1 Punggol Drive offers a verified address, public transport connections and several public services. Use SLA OneMap to look it up, then ask whether a map pin denotes a building, an entrance or a whole site. Do not invent a six-decimal-place coordinate from the centre of a screenshot. The next lesson is the difference between a point location, a route and a district boundary.
This October 2026 guide develops GIS, coordinate systems, map interpretation, routing, georeferencing and ethical spatial data use. It is not a replacement for surveying or a promise of real-time wayfinding. Source facts come from SLA, NParks, LTA, NLB, URA, JTC, SingStat and BCA. Numerical values in classroom examples are explicitly fictional unless attributed to an official route or dataset.
Choose the geospatial skill you need
- Location and geocoding: find a correct public address and state what the returned point means.
- Coordinate systems: distinguish degrees from projected coordinates and document the CRS.
- Map scale: convert units and identify which named route is being measured.
- Networks: model real station connections without assuming equal travel time.
- Accessibility: compare a circular radius with usable walking routes.
- Historical geography: align maps without assigning false modern coordinates to old settlements.
- Urban planning: distinguish a boundary or proposed link from open pedestrian infrastructure.
- Population mapping: preserve time, denominator and area boundaries.
- Cartographic ethics: omit private or sensitive locations and display uncertainty clearly.
The first geospatial question is what geometry represents the thing
A regional library may be shown as a public building point, a footprint polygon or an entrance location. A park connector is a path line rather than one dot. A planning area is an administrative polygon, not a specific household. Each representation supports different questions. A map can be technically valid while answering the wrong problem if it uses a building centroid to promise a wheelchair entrance or a straight-line distance to estimate walking time.
Coordinate metadata matters equally. OneMap documents WGS84 geographic coordinates and Singapore’s SVY21 projected system; confusing their numeric fields can put a point far from the intended location or create invalid positions. Even properly converted coordinates can be uncertain if the underlying input was only a guessed pin. Precision on screen does not establish accuracy on the ground. Students must record the CRS and the feature represented.
Finally, time is part of geography. LTA station services, park gate rules, construction phases and population distributions change. The effective opening of a path is not deduced from a masterplan alone, and a 2020 demographic API table is not automatically current for 2026. A trustworthy geospatial analysis records data currency, source and the status of unverified links.
Ten Punggol geospatial mapping exercises
1. Use SLA OneMap to locate a real public destination without guessing coordinates
Where: One Punggol at 1 Punggol Drive, using OneMap’s authoritative Singapore base map.
The mapping problem
OneMap is Singapore’s authoritative national map produced by SLA, with search and reverse-geocoding services covering local places and addresses. A geospatial student should begin by distinguishing a human-readable address, an officially named building and a coordinate pair. These are related but not identical forms of location information. When an online article calls a place ‘near Punggol MRT’, it has not supplied a precise official coordinate or demonstrated which pedestrian entrance is best. Searching the full verified One Punggol address provides a dependable starting record for map work.
Safe mapping procedure
Open OneMap’s public map or its documented search service and locate 1 Punggol Drive. Record the exact address string returned and the place type, using the name supplied by the source rather than an invented shortened label. Note whether the selected point represents a building, address centroid or entry location; these may differ. Make a screenshot only in accordance with map reuse terms, or draw an original diagram. Create a separate route question such as how a visitor would travel from Punggol MRT, then use routing information rather than a straight line to answer it.
Original worked example
A student uses a map’s display centre to create a latitude and longitude for the library entrance, claiming it is accurate to six decimal places. The point might be the building centre rather than the entrance. The correction records that it is a mapped building location with uncertain doorway precision and consults the venue’s directions for the actual visitor approach. Giving more decimal places does not make an unverified point correct.
A more demanding GIS question
Compare ordinary search with reverse geocoding using a documented public sample point. Ask what happens if two addresses share a large complex or an entrance lies on a different road. Discuss why geocoding results need verification and why a ‘best match’ algorithm can still return the wrong Punggol venue when the name is ambiguous.
Access, accuracy and privacy limits
Do not publish private family addresses or identify the homes of residents. OneMap API use may require account registration and tokens; follow official terms and avoid putting tokens into public WordPress source code.
Official mapping source: Use SLA OneMap to locate a real public destination without guessing coordinates. Check the dataset’s supported dates and licensing.
2. Distinguish WGS84 latitude-longitude from Singapore’s SVY21 grid
Where: A desktop OneMap coordinate-conversion lesson using fictional or OneMap’s own example coordinates.
The mapping problem
OneMap documents coordinate conversions among WGS84 EPSG:4326, SVY21 EPSG:3414 and Web Mercator EPSG:3857. These systems express location in different coordinate spaces. WGS84 provides angular latitude and longitude while Singapore’s SVY21 projected grid expresses easting and northing in a local system. A numeric pair without its coordinate reference system (CRS) can be misplotted or interpreted as an ordinary street distance. Coordinate literacy comes before placing pins on a map.
Safe mapping procedure
Read OneMap’s coordinate-converter page and write a table with the CRS name, EPSG identifier, type of coordinates and broad purpose. Use a documented example supplied by OneMap or a fully fictional point, clearly labelled, rather than a private location. Convert it using the official tool when properly authorised, and check both input order and output labels. For a paper test, compare why a latitude of approximately one degree north does not mean one metre north. Record output precision and note that projection transformations involve definitions and possible rounding.
Original worked example
A developer takes a sample pair labelled X=30,000 and Y=40,000 in SVY21 and pastes it into an application expecting WGS84 latitude and longitude. The point is invalid or misleading because the units and ranges differ. The correction identifies the source CRS and applies the documented transformation before mapping. It avoids treating X and longitude as the same field simply because both are horizontal coordinates.
A more demanding GIS question
Discuss Web Mercator’s visual convenience for online map tiles and its distortions, particularly toward high latitudes. Explain why projected units can be appropriate for local calculations when used correctly, while straight-line distances on an unverified pixel image cannot simply be read as actual walking travel. A good GIS file always documents the original CRS.
Access, accuracy and privacy limits
The OneMap conversion API may require a valid authentication token and has rate limits. Do not publish a token, invent successful transformations or claim a coordinate pair has been surveyed when it came from a simple web map.
Official mapping source: Distinguish WGS84 latitude-longitude from Singapore’s SVY21 grid. Check the dataset’s supported dates and licensing.
3. Solve a scale and distance problem using the actual Punggol Waterway connector label
Where: NParks Punggol Waterway Park and named Punggol Waterway Park Connector.
The mapping problem
NParks describes a 4.2-kilometre Waterway Park nature walk and separately an 8.4-kilometre Punggol Waterway Park Connector. Two nearby geographic features can share words in their titles while having different route extents. A correct geospatial analysis must identify which polyline the number applies to before calculating anything. It also distinguishes geographic distance, traced path length and actual travelled distance when a path is diverted or a visitor takes a side route.
Safe mapping procedure
Read the official pages for both named routes and create a small metadata table with name, source, published length and relevant map description. Convert 4.2km to 4,200m and 8.4km to 8,400m; do not assume their exact geometries or travel overlap from the numerical ratio. On paper draw a hypothetical 1:10,000 route map, where one centimetre represents one hundred metres, then calculate the length represented by a three-centimetre line. Label the paper map illustrative, not a downloaded survey of Punggol.
Original worked example
At 1:10,000 scale, three centimetres on the fictional drawing represent thirty thousand centimetres in the modelled ground, or three hundred metres. A learner first reports thirty kilometres because they multiply without reconciling units. Another learner divides 8.4 by 4.2 and says the connector is exactly two loops of the nature walk. The ratio is two, but the geographic route relationship has not been established. Both errors need different corrections.
A more demanding GIS question
Discuss why a path drawn as several straight segments can underestimate a winding actual route and why GPS traces can contain noise near buildings. Propose a method to compare the official named polyline with a GPS record if the owner had permission and appropriate data, without recording other walkers’ movements.
Access, accuracy and privacy limits
No activity requires the full walk. Do not place measuring tapes or tripods on shared paths, enter water or claim an official map’s dimensions are a current accessibility guarantee on every spur.
Official mapping source: Solve a scale and distance problem using the actual Punggol Waterway connector label. Check the dataset’s supported dates and licensing.
4. Compare the topology of Punggol MRT and its two LRT loops
Where: LTA’s current rail map, Punggol MRT NE17 and Punggol Coast MRT NE18.
The mapping problem
Topological questions concern what is connected to what, not the shape or visual size of a line. Punggol MRT is an interchange with East and West LRT loops, and LTA opened Punggol Coast MRT as the newer North East Line terminal in December 2024. A rail schematic simplifies geographic spacing to make connectivity easier to read. A student can use it to build a network graph while recognising that it is not a real-distance engineering survey or a source of exact train intervals.
Safe mapping procedure
Copy the correctly named operating stops from LTA’s current map and build a small graph with Punggol as a transfer node. Label different services and where a journey requires transferring. Write separate graph edge meanings: adjacency only, fictional equal cost or a documented real travel attribute. Never assign a cost without saying what it measures. Add a test where a user confuses Punggol Point LRT with Punggol Coast MRT and show the correct two different nodes.
Original worked example
A student places Punggol Point and Punggol Coast on one node because both contain the word ‘Punggol’. The resulting path appears to offer a direct transfer that does not exist. The correction assigns their proper LRT and MRT station identities and verifies the operating connection separately. Another error is claiming equal paper distances imply equal train travel time; a schematic is designed primarily for readability.
A more demanding GIS question
Build two small route models: one for fewest transfers and one with hypothetical travel-time weights. Discuss which is useful for a traveller with a stroller or limited stamina. Accessibility requires actual lift and pedestrian conditions, so an algorithm without current information should display uncertainty rather than promise a safe route.
Access, accuracy and privacy limits
Do not copy a 2028 rail masterplan as if every new connection is already operating. Follow current LTA passenger rules and keep algorithms purely educational; they are not real-time journey predictions.
Official mapping source: Compare the topology of Punggol MRT and its two LRT loops. Check the dataset’s supported dates and licensing.
5. Map a library visitor’s access network rather than drawing a misleading circle
Where: Punggol Regional Library at One Punggol and public pedestrian connections.
The mapping problem
GIS analysis often uses a circular buffer around a point to represent proximity, but people travel along paths, crossings, lifts and bridges. A circular half-kilometre buffer is not the same as a five-hundred-metre network service area. This difference matters around an interchange and a waterway, where a destination may appear close across water but require a longer walking route. A geospatial student should choose the representation that matches the decision and identify limitations when accessible paths are not verified.
Safe mapping procedure
Select One Punggol as a clearly named public destination. On an illustrative grid draw a five-hundred-metre radius circle and overlay a small hypothetical walking network containing one waterway and bridge. Count which model points are within the circle but not within five hundred metres of travel along the network. Then consult OneMap’s routing documentation for how actual walking routes might be obtained with proper authorised access. Do not invent a live travel-time metric for a particular resident.
Original worked example
An illustrative student map shows a point four hundred metres away in a straight line but seven hundred metres by a permitted path over a bridge. The circle includes the point; the walking-distance service area does not. Both calculations are internally correct but answer different questions. The correction is choosing the network representation for a visitor-access question and explaining that the data are synthetic.
A more demanding GIS question
Consider that a wheelchair-usable network may require different route attributes, including lifts, slopes or temporary closures, which ordinary map geometry may not provide. Define a rule for unknown accessibility information rather than treating every footpath edge as guaranteed usable. Ask what data would be needed for an evidence-led community access study.
Access, accuracy and privacy limits
Do not use a geospatial buffer to claim a person’s household is within a guaranteed journey time or eligibility catchment. Service access, walkability and legal boundaries require the appropriate official data and conditions.
Official mapping source: Map a library visitor’s access network rather than drawing a misleading circle. Check the dataset’s supported dates and licensing.
6. Test historical georeferencing with NLB’s Punggol Story Map
Where: NLB Curiocity’s Punggol story map and present OneMap geography.
The mapping problem
NLB documents that the historical place name Punggol included areas now associated with parts of Sengkang and Hougang. The story map uses SLA OneMap as its present-day base and draws on historical references, but explicitly says it is not comprehensive for every Punggol building. A historical map is a product of its time, scale and survey purpose. Georeferencing it against a modern map requires control points and careful uncertainty, not simply stretching an image until its road names look familiar.
Safe mapping procedure
Read the story map’s source notes and sketch a two-layer diagram: broad historical place naming and current map boundaries. Identify which features might be stable reference points and which may have changed through reclamation or road realignment. Write a georeferencing proposal listing three candidate control features and reasons each may be unreliable. Do not publish invented precise coordinates for former homes or say that an old village occupies a specific modern block without archival evidence.
Original worked example
A student overlays a crop of a historical Punggol map onto a new development and marks an old house at the entrance of a currently open shop. The old map’s scale and changed landscape do not justify that accuracy. The revised drawing shades an approximate historic context and attaches the archival date and uncertainty. This prevents a classroom GIS output from making a false historical claim.
A more demanding GIS question
Introduce root mean square error qualitatively as a way to assess fit against chosen control points, without inventing an exact calculated figure when points were never georeferenced. Discuss the risk of choosing only control points that support a desired conclusion and why the original map’s provenance must be preserved.
Access, accuracy and privacy limits
Do not use historical maps to navigate through closed construction sites, private buildings or restricted heritage areas. Respect rights in archival cartography and the source’s own stated limitations.
Official mapping source: Test historical georeferencing with NLB’s Punggol Story Map. Check the dataset’s supported dates and licensing.
7. Read Punggol Digital District’s planned footprint without assuming every path is open
Where: URA’s Punggol Digital District urban-design guidelines and JTC’s current public community map.
The mapping problem
URA’s guidelines describe the district as integrating SIT and JTC business-park developments in a transport-oriented, pedestrian-friendly setting. JTC’s current community information identifies operating amenities and the first opened stretch of the planned Heritage Trail. A planning boundary is not the same as an accessible walking route, and a completed transport station does not prove every depicted building phase is open. This is a useful geospatial source test because masterplan polygons and day-of-visit operating conditions answer different questions.
Safe mapping procedure
Read the latest URA boundary and design guidance and JTC’s current community page. Create separate legend classes for existing operating public facility, planned path, construction or unverified area, and district boundary. Mark only those statuses that an official current source supports. If a student wants to plan a walking route, use currently open entrances and paths from the site operator; do not draw a through-route on the masterplan as though the whole network is passable.
Original worked example
A student sees a roughly 1.3km planned Heritage Trail line and publishes a map encouraging visitors to walk its entire alignment. JTC’s current page identifies the first four hundred metres as open. The corrected map colours that section as documented open and leaves other stages unconfirmed. It becomes more useful to visitors without claiming the planning diagram itself was inaccurate.
A more demanding GIS question
Compare a land-use planning polygon with an actual pedestrian route network. Discuss why cadastral boundaries, access rights and physical footpaths may differ. Ask what update metadata a mobile wayfinding product would need to keep visitors from closed paths, and how the map should behave when opening status is unknown.
Access, accuracy and privacy limits
Never enter private SIT rooms, JTC business offices or worksite fences to verify a map. Treat plans, proposed links and actual opening notices as different evidence classes.
Official mapping source: Read Punggol Digital District’s planned footprint without assuming every path is open. Check the dataset’s supported dates and licensing.
8. Use SingStat planning-area population data without turning polygons into personal profiles
Where: SingStat 2026 planning-area demographic tables and OneMap Population Query documentation.
The mapping problem
SingStat releases geographic-distribution data by planning area and subzone, and OneMap documents Population Query endpoints for demographic information. Administrative boundaries are a convenient aggregation, but values for a whole polygon cannot tell us a particular resident’s age, household income or journey habits. A student mapping Punggol must record the reference year and exact boundary used. Furthermore, OneMap’s documented population-query examples may list older available years for particular endpoints; a current 2026 SingStat table is not automatically returned by every API method.
Safe mapping procedure
Choose one publicly released aggregate age statistic in SingStat’s 2026 publication and state its denominator, reference date and geography. Draw two fictional subzones with different population sizes to illustrate why identical colour shading can obscure absolute counts. Create a map legend that says whether colours represent numbers, percentages or categories. When considering OneMap’s API, read the actual documented supported years and response fields instead of silently assuming that every endpoint contains the newest table.
Original worked example
A student colours a hypothetical subzone dark because thirty per cent of its residents are below five, and then writes that it contains more children than a lighter-coloured subzone. Without total populations, that inference is invalid. The correction adds denominators and distinguishes a high share from a large number. The student also refrains from attaching one demographic percentage to a visible household or school group.
A more demanding GIS question
Compare choropleth shading by raw count against shading by proportion. Explain why raw totals can reflect area size or population scale and why rate maps answer different questions. Consider how boundary changes complicate time-series comparisons. Discuss uncertainty, suppression of sensitive small-area data and ethical aggregation choices.
Access, accuracy and privacy limits
Do not attempt to reidentify households through combinations of subzone data and other information. Use authentic dates, official sources and licensing rules. Demographic patterns are group descriptions, not personal dossiers.
Official mapping source: Use SingStat planning-area population data without turning polygons into personal profiles. Check the dataset’s supported dates and licensing.
9. Evaluate a safe routing map for step-free public access
Where: One Punggol, public transport nodes and BCA’s inclusive design principles.
The mapping problem
LTA and PA describe public transport and community-hub access, while BCA sets out Universal Design principles. A geospatial route intended for wheelchair users or visitors with prams needs more than a straight-line location. It may require data on lifts, curb crossings, surface conditions and temporary works. A network can be physically connected while unsuitable for a particular user. Building an ethical map means distinguishing confirmed information from assumed accessibility and never promising an unverified route.
Safe mapping procedure
Create a hypothetical small graph representing station, crossing, lift, hub entrance and library. Mark every link with its information status: verified, unverified or temporarily unavailable. Write a routing rule that refuses to guarantee step-free access when critical link data are missing, and instead prompts for current operator checking. Ask a peer to test the map with a fictional user who prefers rest stops or shelter. Revise labels that assume every user’s priorities are identical.
Original worked example
A route solver chooses the shortest path over a staircase because it has the smallest geometric length. For a user who requires step-free access, the path violates a stated constraint. The corrected graph removes incompatible edges from that hypothetical routing case and returns an alternative only when the necessary information is supported. If no verified path exists in the data, the honest result is ‘route not confirmed’.
A more demanding GIS question
Add a second criterion, such as fewer transfers or a nearby rest area, and discuss why accessibility is not one universal preference. Test the effect of a fictional lift outage while making clear that no real lift status has been measured. Explain why a user-facing interface should identify data currency and offer authorised updates.
Access, accuracy and privacy limits
Do not simulate a disability by using another person’s mobility aid, obstruct a lift for testing or invent current accessible-route conditions. Compliance determinations are professional matters; a student graph is an educational prototype.
Official mapping source: Evaluate a safe routing map for step-free public access. Check the dataset’s supported dates and licensing.
10. Build an ethical geospatial atlas of ten Punggol public facts
Where: A desk project using authoritative OneMap, NParks, LTA, NLB and JTC sources.
The mapping problem
A useful map atlas is a documented dataset, not just ten colourful pins. Each feature should have a verified locator, exact name, geometry type, source, last-check date, public access status and uncertainty. Punggol provides a diverse set: one integrated hub, a rail interchange, a newer terminal, a waterway path, a coastal park and a conserved structure. A student learns spatial data modelling by choosing appropriate points, lines and polygons for what the subject actually represents.
Safe mapping procedure
Select no more than ten publicly named Punggol features whose locations are supported by official sources. For each decide whether the map should represent a point, line or area. Keep exact private addresses, schoolchildren’s locations and sensitive wildlife points out of the atlas. Record sources and avoid applying one shared ‘open now’ status to every feature. Make a simple legend and ask a first-time reader to explain whether the line represents a trail, transit link, road or planning boundary. Correct any ambiguous symbol before publishing.
Original worked example
A student places a single dot labelled ‘8.4km Punggol Waterway Park Connector’ and claims the point is the whole route. A point might be useful as a locator or entrance, but the connector’s spatial extent is a line or route. The corrected atlas either uses an appropriately sourced polyline or labels the dot as a representative entrance, with the limitation clearly stated. This is a fundamental geometry-type repair.
A more demanding GIS question
Audit four error classes: ambiguous name, incorrect coordinate reference system, stale operating status and unsupported attribution. Create a version log and explain which errors could cause an inconvenient trip versus a serious safety problem. Consider map generalisation: on a small-scale printed map some detail must be omitted, but omission should not falsely turn planned routes into open ones.
Access, accuracy and privacy limits
Respect data licensing, avoid embedding OneMap credentials in public files and do not present hypothetical positions as official surveyed coordinates. Any map that names public services should be reviewed against current source and site access before distribution.
Official mapping source: Build an ethical geospatial atlas of ten Punggol public facts. Check the dataset’s supported dates and licensing.
A practical GIS data model
Create a table with a feature identifier, feature name, type, geometry, coordinate reference system, original source, as-of date, access condition and uncertainty. Keep the first version small. If a row represents Punggol Waterway Park Connector, type should indicate a route or line; if it represents One Punggol’s public address, identify whether the point is a public locator or a precise entrance. A record without a source or CRS should be treated as incomplete for a technical project.
Students can test the schema without collecting real coordinates. Use dummy geometries and compare how a routing graph fails when a nonexistent connection is inserted. Test a missing publication date, conflicting place names and an assumed open route. The error messages should identify which field needs checking, not silently fill it from guesses. A technically correct GeoJSON file can still carry false geographic claims, so content validation is essential.
Three Punggol geospatial study itineraries
A forty-five-minute OneMap desk session
Read OneMap’s main documentation, search for a genuine public destination, and identify what its location record refers to. Then study the coordinate conversion page and draw an input-output flow showing WGS84, SVY21 and Web Mercator. Use OneMap’s documented sample values rather than private home coordinates. End by explaining why a point’s CRS and object type are necessary to use it correctly.
A park-route comparison on paper
Read NParks’ descriptions of the 4.2km nature walk and 8.4km park connector. Create two independent records and a small map legend. Show an illustrative short public walking segment with a return route, and distinguish the length traced on paper from the official published route length. Do not force a long site visit or claim that both NParks distances describe the same exact polyline.
An urban change and accessibility atlas
Use URA and JTC to mark documented public amenities and planned district links. Add LTA’s Punggol Coast station as a confirmed operating rail node, and include NLB’s historical map as a separate dated interpretive layer. Test one fictional wheelchair access case using a graph whose link status may be unknown. Keep proposed features and unverified accessible paths clearly labelled instead of treating every line as ready to use.
Ten geospatial mistakes worth correcting before publication
- Map a building centroid as though it is a verified public entrance.
- Confuse WGS84 degrees with SVY21 or Web Mercator projected coordinates.
- Use extra decimal places as a substitute for locating the correct feature.
- Treat a schematic train map as a geographic scale drawing.
- Confuse 4.2km park nature walk and 8.4km park connector as one route.
- Use a straight-line buffer as proof of walking or step-free accessibility.
- Georeference an old historical map with fabricated exact control points.
- Present the whole planned Heritage Trail as open because it appears on a masterplan.
- Compare planning-area proportions without total population or time reference.
- Publish private household positions, sensitive wildlife locations or API secrets.
Frequently asked questions
What is geospatial science?
The study and use of data about location, spatial relationships, coordinates, maps and geographically distributed processes.
Is GIS the same as reading a normal map?
GIS can store and analyse structured spatial data, sources and geometry, beyond viewing a basemap.
What is OneMap?
SLA’s authoritative Singapore mapping platform with public map tools and documented APIs.
Can OneMap find Punggol addresses?
It provides search and geocoding services for supported roads, addresses and public places, subject to current data and terms.
What is a CRS?
A coordinate reference system that defines how location coordinates relate to Earth or a projected map.
What is WGS84?
A geographic reference system commonly used for latitude and longitude, represented as EPSG:4326.
What is SVY21?
Singapore’s local projected coordinate system, represented as EPSG:3414.
Why can I not interchange latitude with SVY21 X?
They use different definitions and units; valid transformation is required.
What is map scale?
The ratio between a distance shown on a map and the represented ground distance, under the map’s stated projection and conventions.
Is Punggol Waterway Park Connector 8.4km?
NParks lists the named park connector as 8.4km, while a separate nature walk is listed as 4.2km.
Is Punggol Coast MRT the same as Punggol Point LRT?
No. They are separate stations on different operating rail services.
What is graph topology?
The structure of connections among nodes, independently from exact visual distances.
What is a network service area?
The area reachable along an identified transport or pedestrian network under defined travel rules or costs.
Can a circular 500m buffer prove a five-minute walk?
No. Route geometry, crossings, speed, access and conditions matter.
Can I plot an exact historic village home from an old Punggol story map?
Not without evidence sufficient for that precision. Historical maps can be approximate and may predate later land changes.
Does a Punggol Digital District map prove every walkway is open?
No. Planned alignments and current operational access must be checked separately.
Which official source contains Punggol planning-area demographics?
SingStat publishes geographic-distribution datasets, and OneMap documents population-related API services with specific supported years.
Is a population proportion the same as an absolute count?
No. A proportion requires a denominator, and absolute numbers also depend on population size.
Can I make a step-free walking map from ordinary line geometry alone?
Not reliably. You need appropriate verified accessibility attributes and current operational conditions.
Can a student publish an online geospatial atlas?
Yes, using appropriately licensed public data, safe general locations, verified metadata and clear uncertainty labels.
Authoritative mapping sources and related Punggol learning
- Use SLA OneMap to locate a real public destination without guessing coordinates
- Distinguish WGS84 latitude-longitude from Singapore’s SVY21 grid
- Solve a scale and distance problem using the actual Punggol Waterway connector label
- Compare the topology of Punggol MRT and its two LRT loops
- Map a library visitor’s access network rather than drawing a misleading circle
- Test historical georeferencing with NLB’s Punggol Story Map
- Read Punggol Digital District’s planned footprint without assuming every path is open
- Use SingStat planning-area population data without turning polygons into personal profiles
- Evaluate a safe routing map for step-free public access
- Build an ethical geospatial atlas of ten Punggol public facts
- SLA OneMap coordinate conversions
- SLA OneMap population-query coverage and supported years
- JTC open district amenities and trail stages
- Punggol Geography field observations
- Punggol urban planning context
- Graph algorithms and careful data modelling
- Demographic inference and ethics
- eduKateSG step-by-step error repair learning model
The best map identifies both place and uncertainty
Punggol offers a compact introduction to geospatial science because public transport, waterway paths, older names, integrated services and phased new development overlap. Build a small accurate dataset before designing a large map. Check the feature geometry, coordinate reference system, source date and actual access, then repair the first mismatch. Spatial information becomes valuable when it helps a reader act correctly without exposing people or inventing precise locations.
- Location and geocoding: find a correct public address and state what the returned point means.
- Coordinate systems: distinguish degrees from projected coordinates and document the CRS.
- Map scale: convert units and identify which named route is being measured.
- Networks: model real station connections without assuming equal travel time.
- Accessibility: compare a circular radius with usable walking routes.
- Historical geography: align maps without assigning false modern coordinates to old settlements.
- Urban planning: distinguish a boundary or proposed link from open pedestrian infrastructure.
- Population mapping: preserve time, denominator and area boundaries.
- Cartographic ethics: omit private or sensitive locations and display uncertainty clearly.
The first geospatial question is what geometry represents the thing
A regional library may be shown as a public building point, a footprint polygon or an entrance location. A park connector is a path line rather than one dot. A planning area is an administrative polygon, not a specific household. Each representation supports different questions. A map can be technically valid while answering the wrong problem if it uses a building centroid to promise a wheelchair entrance or a straight-line distance to estimate walking time.
Coordinate metadata matters equally. OneMap documents WGS84 geographic coordinates and Singapore’s SVY21 projected system; confusing their numeric fields can put a point far from the intended location or create invalid positions. Even properly converted coordinates can be uncertain if the underlying input was only a guessed pin. Precision on screen does not establish accuracy on the ground. Students must record the CRS and the feature represented.
Finally, time is part of geography. LTA station services, park gate rules, construction phases and population distributions change. The effective opening of a path is not deduced from a masterplan alone, and a 2020 demographic API table is not automatically current for 2026. A trustworthy geospatial analysis records data currency, source and the status of unverified links.
Ten Punggol geospatial mapping exercises
1. Use SLA OneMap to locate a real public destination without guessing coordinates
Where: One Punggol at 1 Punggol Drive, using OneMap’s authoritative Singapore base map.
The mapping problem
OneMap is Singapore’s authoritative national map produced by SLA, with search and reverse-geocoding services covering local places and addresses. A geospatial student should begin by distinguishing a human-readable address, an officially named building and a coordinate pair. These are related but not identical forms of location information. When an online article calls a place ‘near Punggol MRT’, it has not supplied a precise official coordinate or demonstrated which pedestrian entrance is best. Searching the full verified One Punggol address provides a dependable starting record for map work.
Safe mapping procedure
Open OneMap’s public map or its documented search service and locate 1 Punggol Drive. Record the exact address string returned and the place type, using the name supplied by the source rather than an invented shortened label. Note whether the selected point represents a building, address centroid or entry location; these may differ. Make a screenshot only in accordance with map reuse terms, or draw an original diagram. Create a separate route question such as how a visitor would travel from Punggol MRT, then use routing information rather than a straight line to answer it.
Original worked example
A student uses a map’s display centre to create a latitude and longitude for the library entrance, claiming it is accurate to six decimal places. The point might be the building centre rather than the entrance. The correction records that it is a mapped building location with uncertain doorway precision and consults the venue’s directions for the actual visitor approach. Giving more decimal places does not make an unverified point correct.
A more demanding GIS question
Compare ordinary search with reverse geocoding using a documented public sample point. Ask what happens if two addresses share a large complex or an entrance lies on a different road. Discuss why geocoding results need verification and why a ‘best match’ algorithm can still return the wrong Punggol venue when the name is ambiguous.
Access, accuracy and privacy limits
Do not publish private family addresses or identify the homes of residents. OneMap API use may require account registration and tokens; follow official terms and avoid putting tokens into public WordPress source code.
Official mapping source: Use SLA OneMap to locate a real public destination without guessing coordinates. Check the dataset’s supported dates and licensing.
2. Distinguish WGS84 latitude-longitude from Singapore’s SVY21 grid
Where: A desktop OneMap coordinate-conversion lesson using fictional or OneMap’s own example coordinates.
The mapping problem
OneMap documents coordinate conversions among WGS84 EPSG:4326, SVY21 EPSG:3414 and Web Mercator EPSG:3857. These systems express location in different coordinate spaces. WGS84 provides angular latitude and longitude while Singapore’s SVY21 projected grid expresses easting and northing in a local system. A numeric pair without its coordinate reference system (CRS) can be misplotted or interpreted as an ordinary street distance. Coordinate literacy comes before placing pins on a map.
Safe mapping procedure
Read OneMap’s coordinate-converter page and write a table with the CRS name, EPSG identifier, type of coordinates and broad purpose. Use a documented example supplied by OneMap or a fully fictional point, clearly labelled, rather than a private location. Convert it using the official tool when properly authorised, and check both input order and output labels. For a paper test, compare why a latitude of approximately one degree north does not mean one metre north. Record output precision and note that projection transformations involve definitions and possible rounding.
Original worked example
A developer takes a sample pair labelled X=30,000 and Y=40,000 in SVY21 and pastes it into an application expecting WGS84 latitude and longitude. The point is invalid or misleading because the units and ranges differ. The correction identifies the source CRS and applies the documented transformation before mapping. It avoids treating X and longitude as the same field simply because both are horizontal coordinates.
A more demanding GIS question
Discuss Web Mercator’s visual convenience for online map tiles and its distortions, particularly toward high latitudes. Explain why projected units can be appropriate for local calculations when used correctly, while straight-line distances on an unverified pixel image cannot simply be read as actual walking travel. A good GIS file always documents the original CRS.
Access, accuracy and privacy limits
The OneMap conversion API may require a valid authentication token and has rate limits. Do not publish a token, invent successful transformations or claim a coordinate pair has been surveyed when it came from a simple web map.
Official mapping source: Distinguish WGS84 latitude-longitude from Singapore’s SVY21 grid. Check the dataset’s supported dates and licensing.
3. Solve a scale and distance problem using the actual Punggol Waterway connector label
Where: NParks Punggol Waterway Park and named Punggol Waterway Park Connector.
The mapping problem
NParks describes a 4.2-kilometre Waterway Park nature walk and separately an 8.4-kilometre Punggol Waterway Park Connector. Two nearby geographic features can share words in their titles while having different route extents. A correct geospatial analysis must identify which polyline the number applies to before calculating anything. It also distinguishes geographic distance, traced path length and actual travelled distance when a path is diverted or a visitor takes a side route.
Safe mapping procedure
Read the official pages for both named routes and create a small metadata table with name, source, published length and relevant map description. Convert 4.2km to 4,200m and 8.4km to 8,400m; do not assume their exact geometries or travel overlap from the numerical ratio. On paper draw a hypothetical 1:10,000 route map, where one centimetre represents one hundred metres, then calculate the length represented by a three-centimetre line. Label the paper map illustrative, not a downloaded survey of Punggol.
Original worked example
At 1:10,000 scale, three centimetres on the fictional drawing represent thirty thousand centimetres in the modelled ground, or three hundred metres. A learner first reports thirty kilometres because they multiply without reconciling units. Another learner divides 8.4 by 4.2 and says the connector is exactly two loops of the nature walk. The ratio is two, but the geographic route relationship has not been established. Both errors need different corrections.
A more demanding GIS question
Discuss why a path drawn as several straight segments can underestimate a winding actual route and why GPS traces can contain noise near buildings. Propose a method to compare the official named polyline with a GPS record if the owner had permission and appropriate data, without recording other walkers’ movements.
Access, accuracy and privacy limits
No activity requires the full walk. Do not place measuring tapes or tripods on shared paths, enter water or claim an official map’s dimensions are a current accessibility guarantee on every spur.
Official mapping source: Solve a scale and distance problem using the actual Punggol Waterway connector label. Check the dataset’s supported dates and licensing.
4. Compare the topology of Punggol MRT and its two LRT loops
Where: LTA’s current rail map, Punggol MRT NE17 and Punggol Coast MRT NE18.
The mapping problem
Topological questions concern what is connected to what, not the shape or visual size of a line. Punggol MRT is an interchange with East and West LRT loops, and LTA opened Punggol Coast MRT as the newer North East Line terminal in December 2024. A rail schematic simplifies geographic spacing to make connectivity easier to read. A student can use it to build a network graph while recognising that it is not a real-distance engineering survey or a source of exact train intervals.
Safe mapping procedure
Copy the correctly named operating stops from LTA’s current map and build a small graph with Punggol as a transfer node. Label different services and where a journey requires transferring. Write separate graph edge meanings: adjacency only, fictional equal cost or a documented real travel attribute. Never assign a cost without saying what it measures. Add a test where a user confuses Punggol Point LRT with Punggol Coast MRT and show the correct two different nodes.
Original worked example
A student places Punggol Point and Punggol Coast on one node because both contain the word ‘Punggol’. The resulting path appears to offer a direct transfer that does not exist. The correction assigns their proper LRT and MRT station identities and verifies the operating connection separately. Another error is claiming equal paper distances imply equal train travel time; a schematic is designed primarily for readability.
A more demanding GIS question
Build two small route models: one for fewest transfers and one with hypothetical travel-time weights. Discuss which is useful for a traveller with a stroller or limited stamina. Accessibility requires actual lift and pedestrian conditions, so an algorithm without current information should display uncertainty rather than promise a safe route.
Access, accuracy and privacy limits
Do not copy a 2028 rail masterplan as if every new connection is already operating. Follow current LTA passenger rules and keep algorithms purely educational; they are not real-time journey predictions.
Official mapping source: Compare the topology of Punggol MRT and its two LRT loops. Check the dataset’s supported dates and licensing.
5. Map a library visitor’s access network rather than drawing a misleading circle
Where: Punggol Regional Library at One Punggol and public pedestrian connections.
The mapping problem
GIS analysis often uses a circular buffer around a point to represent proximity, but people travel along paths, crossings, lifts and bridges. A circular half-kilometre buffer is not the same as a five-hundred-metre network service area. This difference matters around an interchange and a waterway, where a destination may appear close across water but require a longer walking route. A geospatial student should choose the representation that matches the decision and identify limitations when accessible paths are not verified.
Safe mapping procedure
Select One Punggol as a clearly named public destination. On an illustrative grid draw a five-hundred-metre radius circle and overlay a small hypothetical walking network containing one waterway and bridge. Count which model points are within the circle but not within five hundred metres of travel along the network. Then consult OneMap’s routing documentation for how actual walking routes might be obtained with proper authorised access. Do not invent a live travel-time metric for a particular resident.
Original worked example
An illustrative student map shows a point four hundred metres away in a straight line but seven hundred metres by a permitted path over a bridge. The circle includes the point; the walking-distance service area does not. Both calculations are internally correct but answer different questions. The correction is choosing the network representation for a visitor-access question and explaining that the data are synthetic.
A more demanding GIS question
Consider that a wheelchair-usable network may require different route attributes, including lifts, slopes or temporary closures, which ordinary map geometry may not provide. Define a rule for unknown accessibility information rather than treating every footpath edge as guaranteed usable. Ask what data would be needed for an evidence-led community access study.
Access, accuracy and privacy limits
Do not use a geospatial buffer to claim a person’s household is within a guaranteed journey time or eligibility catchment. Service access, walkability and legal boundaries require the appropriate official data and conditions.
Official mapping source: Map a library visitor’s access network rather than drawing a misleading circle. Check the dataset’s supported dates and licensing.
6. Test historical georeferencing with NLB’s Punggol Story Map
Where: NLB Curiocity’s Punggol story map and present OneMap geography.
The mapping problem
NLB documents that the historical place name Punggol included areas now associated with parts of Sengkang and Hougang. The story map uses SLA OneMap as its present-day base and draws on historical references, but explicitly says it is not comprehensive for every Punggol building. A historical map is a product of its time, scale and survey purpose. Georeferencing it against a modern map requires control points and careful uncertainty, not simply stretching an image until its road names look familiar.
Safe mapping procedure
Read the story map’s source notes and sketch a two-layer diagram: broad historical place naming and current map boundaries. Identify which features might be stable reference points and which may have changed through reclamation or road realignment. Write a georeferencing proposal listing three candidate control features and reasons each may be unreliable. Do not publish invented precise coordinates for former homes or say that an old village occupies a specific modern block without archival evidence.
Original worked example
A student overlays a crop of a historical Punggol map onto a new development and marks an old house at the entrance of a currently open shop. The old map’s scale and changed landscape do not justify that accuracy. The revised drawing shades an approximate historic context and attaches the archival date and uncertainty. This prevents a classroom GIS output from making a false historical claim.
A more demanding GIS question
Introduce root mean square error qualitatively as a way to assess fit against chosen control points, without inventing an exact calculated figure when points were never georeferenced. Discuss the risk of choosing only control points that support a desired conclusion and why the original map’s provenance must be preserved.
Access, accuracy and privacy limits
Do not use historical maps to navigate through closed construction sites, private buildings or restricted heritage areas. Respect rights in archival cartography and the source’s own stated limitations.
Official mapping source: Test historical georeferencing with NLB’s Punggol Story Map. Check the dataset’s supported dates and licensing.
7. Read Punggol Digital District’s planned footprint without assuming every path is open
Where: URA’s Punggol Digital District urban-design guidelines and JTC’s current public community map.
The mapping problem
URA’s guidelines describe the district as integrating SIT and JTC business-park developments in a transport-oriented, pedestrian-friendly setting. JTC’s current community information identifies operating amenities and the first opened stretch of the planned Heritage Trail. A planning boundary is not the same as an accessible walking route, and a completed transport station does not prove every depicted building phase is open. This is a useful geospatial source test because masterplan polygons and day-of-visit operating conditions answer different questions.
Safe mapping procedure
Read the latest URA boundary and design guidance and JTC’s current community page. Create separate legend classes for existing operating public facility, planned path, construction or unverified area, and district boundary. Mark only those statuses that an official current source supports. If a student wants to plan a walking route, use currently open entrances and paths from the site operator; do not draw a through-route on the masterplan as though the whole network is passable.
Original worked example
A student sees a roughly 1.3km planned Heritage Trail line and publishes a map encouraging visitors to walk its entire alignment. JTC’s current page identifies the first four hundred metres as open. The corrected map colours that section as documented open and leaves other stages unconfirmed. It becomes more useful to visitors without claiming the planning diagram itself was inaccurate.
A more demanding GIS question
Compare a land-use planning polygon with an actual pedestrian route network. Discuss why cadastral boundaries, access rights and physical footpaths may differ. Ask what update metadata a mobile wayfinding product would need to keep visitors from closed paths, and how the map should behave when opening status is unknown.
Access, accuracy and privacy limits
Never enter private SIT rooms, JTC business offices or worksite fences to verify a map. Treat plans, proposed links and actual opening notices as different evidence classes.
Official mapping source: Read Punggol Digital District’s planned footprint without assuming every path is open. Check the dataset’s supported dates and licensing.
8. Use SingStat planning-area population data without turning polygons into personal profiles
Where: SingStat 2026 planning-area demographic tables and OneMap Population Query documentation.
The mapping problem
SingStat releases geographic-distribution data by planning area and subzone, and OneMap documents Population Query endpoints for demographic information. Administrative boundaries are a convenient aggregation, but values for a whole polygon cannot tell us a particular resident’s age, household income or journey habits. A student mapping Punggol must record the reference year and exact boundary used. Furthermore, OneMap’s documented population-query examples may list older available years for particular endpoints; a current 2026 SingStat table is not automatically returned by every API method.
Safe mapping procedure
Choose one publicly released aggregate age statistic in SingStat’s 2026 publication and state its denominator, reference date and geography. Draw two fictional subzones with different population sizes to illustrate why identical colour shading can obscure absolute counts. Create a map legend that says whether colours represent numbers, percentages or categories. When considering OneMap’s API, read the actual documented supported years and response fields instead of silently assuming that every endpoint contains the newest table.
Original worked example
A student colours a hypothetical subzone dark because thirty per cent of its residents are below five, and then writes that it contains more children than a lighter-coloured subzone. Without total populations, that inference is invalid. The correction adds denominators and distinguishes a high share from a large number. The student also refrains from attaching one demographic percentage to a visible household or school group.
A more demanding GIS question
Compare choropleth shading by raw count against shading by proportion. Explain why raw totals can reflect area size or population scale and why rate maps answer different questions. Consider how boundary changes complicate time-series comparisons. Discuss uncertainty, suppression of sensitive small-area data and ethical aggregation choices.
Access, accuracy and privacy limits
Do not attempt to reidentify households through combinations of subzone data and other information. Use authentic dates, official sources and licensing rules. Demographic patterns are group descriptions, not personal dossiers.
Official mapping source: Use SingStat planning-area population data without turning polygons into personal profiles. Check the dataset’s supported dates and licensing.
9. Evaluate a safe routing map for step-free public access
Where: One Punggol, public transport nodes and BCA’s inclusive design principles.
The mapping problem
LTA and PA describe public transport and community-hub access, while BCA sets out Universal Design principles. A geospatial route intended for wheelchair users or visitors with prams needs more than a straight-line location. It may require data on lifts, curb crossings, surface conditions and temporary works. A network can be physically connected while unsuitable for a particular user. Building an ethical map means distinguishing confirmed information from assumed accessibility and never promising an unverified route.
Safe mapping procedure
Create a hypothetical small graph representing station, crossing, lift, hub entrance and library. Mark every link with its information status: verified, unverified or temporarily unavailable. Write a routing rule that refuses to guarantee step-free access when critical link data are missing, and instead prompts for current operator checking. Ask a peer to test the map with a fictional user who prefers rest stops or shelter. Revise labels that assume every user’s priorities are identical.
Original worked example
A route solver chooses the shortest path over a staircase because it has the smallest geometric length. For a user who requires step-free access, the path violates a stated constraint. The corrected graph removes incompatible edges from that hypothetical routing case and returns an alternative only when the necessary information is supported. If no verified path exists in the data, the honest result is ‘route not confirmed’.
A more demanding GIS question
Add a second criterion, such as fewer transfers or a nearby rest area, and discuss why accessibility is not one universal preference. Test the effect of a fictional lift outage while making clear that no real lift status has been measured. Explain why a user-facing interface should identify data currency and offer authorised updates.
Access, accuracy and privacy limits
Do not simulate a disability by using another person’s mobility aid, obstruct a lift for testing or invent current accessible-route conditions. Compliance determinations are professional matters; a student graph is an educational prototype.
Official mapping source: Evaluate a safe routing map for step-free public access. Check the dataset’s supported dates and licensing.
10. Build an ethical geospatial atlas of ten Punggol public facts
Where: A desk project using authoritative OneMap, NParks, LTA, NLB and JTC sources.
The mapping problem
A useful map atlas is a documented dataset, not just ten colourful pins. Each feature should have a verified locator, exact name, geometry type, source, last-check date, public access status and uncertainty. Punggol provides a diverse set: one integrated hub, a rail interchange, a newer terminal, a waterway path, a coastal park and a conserved structure. A student learns spatial data modelling by choosing appropriate points, lines and polygons for what the subject actually represents.
Safe mapping procedure
Select no more than ten publicly named Punggol features whose locations are supported by official sources. For each decide whether the map should represent a point, line or area. Keep exact private addresses, schoolchildren’s locations and sensitive wildlife points out of the atlas. Record sources and avoid applying one shared ‘open now’ status to every feature. Make a simple legend and ask a first-time reader to explain whether the line represents a trail, transit link, road or planning boundary. Correct any ambiguous symbol before publishing.
Original worked example
A student places a single dot labelled ‘8.4km Punggol Waterway Park Connector’ and claims the point is the whole route. A point might be useful as a locator or entrance, but the connector’s spatial extent is a line or route. The corrected atlas either uses an appropriately sourced polyline or labels the dot as a representative entrance, with the limitation clearly stated. This is a fundamental geometry-type repair.
A more demanding GIS question
Audit four error classes: ambiguous name, incorrect coordinate reference system, stale operating status and unsupported attribution. Create a version log and explain which errors could cause an inconvenient trip versus a serious safety problem. Consider map generalisation: on a small-scale printed map some detail must be omitted, but omission should not falsely turn planned routes into open ones.
Access, accuracy and privacy limits
Respect data licensing, avoid embedding OneMap credentials in public files and do not present hypothetical positions as official surveyed coordinates. Any map that names public services should be reviewed against current source and site access before distribution.
Official mapping source: Build an ethical geospatial atlas of ten Punggol public facts. Check the dataset’s supported dates and licensing.
A practical GIS data model
Create a table with a feature identifier, feature name, type, geometry, coordinate reference system, original source, as-of date, access condition and uncertainty. Keep the first version small. If a row represents Punggol Waterway Park Connector, type should indicate a route or line; if it represents One Punggol’s public address, identify whether the point is a public locator or a precise entrance. A record without a source or CRS should be treated as incomplete for a technical project.
Students can test the schema without collecting real coordinates. Use dummy geometries and compare how a routing graph fails when a nonexistent connection is inserted. Test a missing publication date, conflicting place names and an assumed open route. The error messages should identify which field needs checking, not silently fill it from guesses. A technically correct GeoJSON file can still carry false geographic claims, so content validation is essential.
Three Punggol geospatial study itineraries
A forty-five-minute OneMap desk session
Read OneMap’s main documentation, search for a genuine public destination, and identify what its location record refers to. Then study the coordinate conversion page and draw an input-output flow showing WGS84, SVY21 and Web Mercator. Use OneMap’s documented sample values rather than private home coordinates. End by explaining why a point’s CRS and object type are necessary to use it correctly.
A park-route comparison on paper
Read NParks’ descriptions of the 4.2km nature walk and 8.4km park connector. Create two independent records and a small map legend. Show an illustrative short public walking segment with a return route, and distinguish the length traced on paper from the official published route length. Do not force a long site visit or claim that both NParks distances describe the same exact polyline.
An urban change and accessibility atlas
Use URA and JTC to mark documented public amenities and planned district links. Add LTA’s Punggol Coast station as a confirmed operating rail node, and include NLB’s historical map as a separate dated interpretive layer. Test one fictional wheelchair access case using a graph whose link status may be unknown. Keep proposed features and unverified accessible paths clearly labelled instead of treating every line as ready to use.
Ten geospatial mistakes worth correcting before publication
- Map a building centroid as though it is a verified public entrance.
- Confuse WGS84 degrees with SVY21 or Web Mercator projected coordinates.
- Use extra decimal places as a substitute for locating the correct feature.
- Treat a schematic train map as a geographic scale drawing.
- Confuse 4.2km park nature walk and 8.4km park connector as one route.
- Use a straight-line buffer as proof of walking or step-free accessibility.
- Georeference an old historical map with fabricated exact control points.
- Present the whole planned Heritage Trail as open because it appears on a masterplan.
- Compare planning-area proportions without total population or time reference.
- Publish private household positions, sensitive wildlife locations or API secrets.
Frequently asked questions
What is geospatial science?
The study and use of data about location, spatial relationships, coordinates, maps and geographically distributed processes.
Is GIS the same as reading a normal map?
GIS can store and analyse structured spatial data, sources and geometry, beyond viewing a basemap.
What is OneMap?
SLA’s authoritative Singapore mapping platform with public map tools and documented APIs.
Can OneMap find Punggol addresses?
It provides search and geocoding services for supported roads, addresses and public places, subject to current data and terms.
What is a CRS?
A coordinate reference system that defines how location coordinates relate to Earth or a projected map.
What is WGS84?
A geographic reference system commonly used for latitude and longitude, represented as EPSG:4326.
What is SVY21?
Singapore’s local projected coordinate system, represented as EPSG:3414.
Why can I not interchange latitude with SVY21 X?
They use different definitions and units; valid transformation is required.
What is map scale?
The ratio between a distance shown on a map and the represented ground distance, under the map’s stated projection and conventions.
Is Punggol Waterway Park Connector 8.4km?
NParks lists the named park connector as 8.4km, while a separate nature walk is listed as 4.2km.
Is Punggol Coast MRT the same as Punggol Point LRT?
No. They are separate stations on different operating rail services.
What is graph topology?
The structure of connections among nodes, independently from exact visual distances.
What is a network service area?
The area reachable along an identified transport or pedestrian network under defined travel rules or costs.
Can a circular 500m buffer prove a five-minute walk?
No. Route geometry, crossings, speed, access and conditions matter.
Can I plot an exact historic village home from an old Punggol story map?
Not without evidence sufficient for that precision. Historical maps can be approximate and may predate later land changes.
Does a Punggol Digital District map prove every walkway is open?
No. Planned alignments and current operational access must be checked separately.
Which official source contains Punggol planning-area demographics?
SingStat publishes geographic-distribution datasets, and OneMap documents population-related API services with specific supported years.
Is a population proportion the same as an absolute count?
No. A proportion requires a denominator, and absolute numbers also depend on population size.
Can I make a step-free walking map from ordinary line geometry alone?
Not reliably. You need appropriate verified accessibility attributes and current operational conditions.
Can a student publish an online geospatial atlas?
Yes, using appropriately licensed public data, safe general locations, verified metadata and clear uncertainty labels.
Authoritative mapping sources and related Punggol learning
- Use SLA OneMap to locate a real public destination without guessing coordinates
- Distinguish WGS84 latitude-longitude from Singapore’s SVY21 grid
- Solve a scale and distance problem using the actual Punggol Waterway connector label
- Compare the topology of Punggol MRT and its two LRT loops
- Map a library visitor’s access network rather than drawing a misleading circle
- Test historical georeferencing with NLB’s Punggol Story Map
- Read Punggol Digital District’s planned footprint without assuming every path is open
- Use SingStat planning-area population data without turning polygons into personal profiles
- Evaluate a safe routing map for step-free public access
- Build an ethical geospatial atlas of ten Punggol public facts
- SLA OneMap coordinate conversions
- SLA OneMap population-query coverage and supported years
- JTC open district amenities and trail stages
- Punggol Geography field observations
- Punggol urban planning context
- Graph algorithms and careful data modelling
- Demographic inference and ethics
- eduKateSG step-by-step error repair learning model
The best map identifies both place and uncertainty
Punggol offers a compact introduction to geospatial science because public transport, waterway paths, older names, integrated services and phased new development overlap. Build a small accurate dataset before designing a large map. Check the feature geometry, coordinate reference system, source date and actual access, then repair the first mismatch. Spatial information becomes valuable when it helps a reader act correctly without exposing people or inventing precise locations.
The top 10 things to do in Punggol for Geospatial Science students are to geocode a public destination with SLA OneMap, distinguish WGS84 from SVY21 coordinates, compare official waterway route lengths, model MRT and LRT network topology, learn why a straight-line buffer is not a walking-distance service area, compare historical and present maps, distinguish planned Punggol Digital District geometry from actual access, map SingStat’s planning-area demographics responsibly, design step-free routing constraints and create an ethical ten-feature Punggol map atlas.
Start with OneMap and one known public destination. One Punggol at 1 Punggol Drive offers a verified address, public transport connections and several public services. Use SLA OneMap to look it up, then ask whether a map pin denotes a building, an entrance or a whole site. Do not invent a six-decimal-place coordinate from the centre of a screenshot. The next lesson is the difference between a point location, a route and a district boundary.
This October 2026 guide develops GIS, coordinate systems, map interpretation, routing, georeferencing and ethical spatial data use. It is not a replacement for surveying or a promise of real-time wayfinding. Source facts come from SLA, NParks, LTA, NLB, URA, JTC, SingStat and BCA. Numerical values in classroom examples are explicitly fictional unless attributed to an official route or dataset.
Choose the geospatial skill you need
- Location and geocoding: find a correct public address and state what the returned point means.
- Coordinate systems: distinguish degrees from projected coordinates and document the CRS.
- Map scale: convert units and identify which named route is being measured.
- Networks: model real station connections without assuming equal travel time.
- Accessibility: compare a circular radius with usable walking routes.
- Historical geography: align maps without assigning false modern coordinates to old settlements.
- Urban planning: distinguish a boundary or proposed link from open pedestrian infrastructure.
- Population mapping: preserve time, denominator and area boundaries.
- Cartographic ethics: omit private or sensitive locations and display uncertainty clearly.
The first geospatial question is what geometry represents the thing
A regional library may be shown as a public building point, a footprint polygon or an entrance location. A park connector is a path line rather than one dot. A planning area is an administrative polygon, not a specific household. Each representation supports different questions. A map can be technically valid while answering the wrong problem if it uses a building centroid to promise a wheelchair entrance or a straight-line distance to estimate walking time.
Coordinate metadata matters equally. OneMap documents WGS84 geographic coordinates and Singapore’s SVY21 projected system; confusing their numeric fields can put a point far from the intended location or create invalid positions. Even properly converted coordinates can be uncertain if the underlying input was only a guessed pin. Precision on screen does not establish accuracy on the ground. Students must record the CRS and the feature represented.
Finally, time is part of geography. LTA station services, park gate rules, construction phases and population distributions change. The effective opening of a path is not deduced from a masterplan alone, and a 2020 demographic API table is not automatically current for 2026. A trustworthy geospatial analysis records data currency, source and the status of unverified links.
Ten Punggol geospatial mapping exercises
1. Use SLA OneMap to locate a real public destination without guessing coordinates
Where: One Punggol at 1 Punggol Drive, using OneMap’s authoritative Singapore base map.
The mapping problem
OneMap is Singapore’s authoritative national map produced by SLA, with search and reverse-geocoding services covering local places and addresses. A geospatial student should begin by distinguishing a human-readable address, an officially named building and a coordinate pair. These are related but not identical forms of location information. When an online article calls a place ‘near Punggol MRT’, it has not supplied a precise official coordinate or demonstrated which pedestrian entrance is best. Searching the full verified One Punggol address provides a dependable starting record for map work.
Safe mapping procedure
Open OneMap’s public map or its documented search service and locate 1 Punggol Drive. Record the exact address string returned and the place type, using the name supplied by the source rather than an invented shortened label. Note whether the selected point represents a building, address centroid or entry location; these may differ. Make a screenshot only in accordance with map reuse terms, or draw an original diagram. Create a separate route question such as how a visitor would travel from Punggol MRT, then use routing information rather than a straight line to answer it.
Original worked example
A student uses a map’s display centre to create a latitude and longitude for the library entrance, claiming it is accurate to six decimal places. The point might be the building centre rather than the entrance. The correction records that it is a mapped building location with uncertain doorway precision and consults the venue’s directions for the actual visitor approach. Giving more decimal places does not make an unverified point correct.
A more demanding GIS question
Compare ordinary search with reverse geocoding using a documented public sample point. Ask what happens if two addresses share a large complex or an entrance lies on a different road. Discuss why geocoding results need verification and why a ‘best match’ algorithm can still return the wrong Punggol venue when the name is ambiguous.
Access, accuracy and privacy limits
Do not publish private family addresses or identify the homes of residents. OneMap API use may require account registration and tokens; follow official terms and avoid putting tokens into public WordPress source code.
Official mapping source: Use SLA OneMap to locate a real public destination without guessing coordinates. Check the dataset’s supported dates and licensing.
2. Distinguish WGS84 latitude-longitude from Singapore’s SVY21 grid
Where: A desktop OneMap coordinate-conversion lesson using fictional or OneMap’s own example coordinates.
The mapping problem
OneMap documents coordinate conversions among WGS84 EPSG:4326, SVY21 EPSG:3414 and Web Mercator EPSG:3857. These systems express location in different coordinate spaces. WGS84 provides angular latitude and longitude while Singapore’s SVY21 projected grid expresses easting and northing in a local system. A numeric pair without its coordinate reference system (CRS) can be misplotted or interpreted as an ordinary street distance. Coordinate literacy comes before placing pins on a map.
Safe mapping procedure
Read OneMap’s coordinate-converter page and write a table with the CRS name, EPSG identifier, type of coordinates and broad purpose. Use a documented example supplied by OneMap or a fully fictional point, clearly labelled, rather than a private location. Convert it using the official tool when properly authorised, and check both input order and output labels. For a paper test, compare why a latitude of approximately one degree north does not mean one metre north. Record output precision and note that projection transformations involve definitions and possible rounding.
Original worked example
A developer takes a sample pair labelled X=30,000 and Y=40,000 in SVY21 and pastes it into an application expecting WGS84 latitude and longitude. The point is invalid or misleading because the units and ranges differ. The correction identifies the source CRS and applies the documented transformation before mapping. It avoids treating X and longitude as the same field simply because both are horizontal coordinates.
A more demanding GIS question
Discuss Web Mercator’s visual convenience for online map tiles and its distortions, particularly toward high latitudes. Explain why projected units can be appropriate for local calculations when used correctly, while straight-line distances on an unverified pixel image cannot simply be read as actual walking travel. A good GIS file always documents the original CRS.
Access, accuracy and privacy limits
The OneMap conversion API may require a valid authentication token and has rate limits. Do not publish a token, invent successful transformations or claim a coordinate pair has been surveyed when it came from a simple web map.
Official mapping source: Distinguish WGS84 latitude-longitude from Singapore’s SVY21 grid. Check the dataset’s supported dates and licensing.
3. Solve a scale and distance problem using the actual Punggol Waterway connector label
Where: NParks Punggol Waterway Park and named Punggol Waterway Park Connector.
The mapping problem
NParks describes a 4.2-kilometre Waterway Park nature walk and separately an 8.4-kilometre Punggol Waterway Park Connector. Two nearby geographic features can share words in their titles while having different route extents. A correct geospatial analysis must identify which polyline the number applies to before calculating anything. It also distinguishes geographic distance, traced path length and actual travelled distance when a path is diverted or a visitor takes a side route.
Safe mapping procedure
Read the official pages for both named routes and create a small metadata table with name, source, published length and relevant map description. Convert 4.2km to 4,200m and 8.4km to 8,400m; do not assume their exact geometries or travel overlap from the numerical ratio. On paper draw a hypothetical 1:10,000 route map, where one centimetre represents one hundred metres, then calculate the length represented by a three-centimetre line. Label the paper map illustrative, not a downloaded survey of Punggol.
Original worked example
At 1:10,000 scale, three centimetres on the fictional drawing represent thirty thousand centimetres in the modelled ground, or three hundred metres. A learner first reports thirty kilometres because they multiply without reconciling units. Another learner divides 8.4 by 4.2 and says the connector is exactly two loops of the nature walk. The ratio is two, but the geographic route relationship has not been established. Both errors need different corrections.
A more demanding GIS question
Discuss why a path drawn as several straight segments can underestimate a winding actual route and why GPS traces can contain noise near buildings. Propose a method to compare the official named polyline with a GPS record if the owner had permission and appropriate data, without recording other walkers’ movements.
Access, accuracy and privacy limits
No activity requires the full walk. Do not place measuring tapes or tripods on shared paths, enter water or claim an official map’s dimensions are a current accessibility guarantee on every spur.
Official mapping source: Solve a scale and distance problem using the actual Punggol Waterway connector label. Check the dataset’s supported dates and licensing.
4. Compare the topology of Punggol MRT and its two LRT loops
Where: LTA’s current rail map, Punggol MRT NE17 and Punggol Coast MRT NE18.
The mapping problem
Topological questions concern what is connected to what, not the shape or visual size of a line. Punggol MRT is an interchange with East and West LRT loops, and LTA opened Punggol Coast MRT as the newer North East Line terminal in December 2024. A rail schematic simplifies geographic spacing to make connectivity easier to read. A student can use it to build a network graph while recognising that it is not a real-distance engineering survey or a source of exact train intervals.
Safe mapping procedure
Copy the correctly named operating stops from LTA’s current map and build a small graph with Punggol as a transfer node. Label different services and where a journey requires transferring. Write separate graph edge meanings: adjacency only, fictional equal cost or a documented real travel attribute. Never assign a cost without saying what it measures. Add a test where a user confuses Punggol Point LRT with Punggol Coast MRT and show the correct two different nodes.
Original worked example
A student places Punggol Point and Punggol Coast on one node because both contain the word ‘Punggol’. The resulting path appears to offer a direct transfer that does not exist. The correction assigns their proper LRT and MRT station identities and verifies the operating connection separately. Another error is claiming equal paper distances imply equal train travel time; a schematic is designed primarily for readability.
A more demanding GIS question
Build two small route models: one for fewest transfers and one with hypothetical travel-time weights. Discuss which is useful for a traveller with a stroller or limited stamina. Accessibility requires actual lift and pedestrian conditions, so an algorithm without current information should display uncertainty rather than promise a safe route.
Access, accuracy and privacy limits
Do not copy a 2028 rail masterplan as if every new connection is already operating. Follow current LTA passenger rules and keep algorithms purely educational; they are not real-time journey predictions.
Official mapping source: Compare the topology of Punggol MRT and its two LRT loops. Check the dataset’s supported dates and licensing.
5. Map a library visitor’s access network rather than drawing a misleading circle
Where: Punggol Regional Library at One Punggol and public pedestrian connections.
The mapping problem
GIS analysis often uses a circular buffer around a point to represent proximity, but people travel along paths, crossings, lifts and bridges. A circular half-kilometre buffer is not the same as a five-hundred-metre network service area. This difference matters around an interchange and a waterway, where a destination may appear close across water but require a longer walking route. A geospatial student should choose the representation that matches the decision and identify limitations when accessible paths are not verified.
Safe mapping procedure
Select One Punggol as a clearly named public destination. On an illustrative grid draw a five-hundred-metre radius circle and overlay a small hypothetical walking network containing one waterway and bridge. Count which model points are within the circle but not within five hundred metres of travel along the network. Then consult OneMap’s routing documentation for how actual walking routes might be obtained with proper authorised access. Do not invent a live travel-time metric for a particular resident.
Original worked example
An illustrative student map shows a point four hundred metres away in a straight line but seven hundred metres by a permitted path over a bridge. The circle includes the point; the walking-distance service area does not. Both calculations are internally correct but answer different questions. The correction is choosing the network representation for a visitor-access question and explaining that the data are synthetic.
A more demanding GIS question
Consider that a wheelchair-usable network may require different route attributes, including lifts, slopes or temporary closures, which ordinary map geometry may not provide. Define a rule for unknown accessibility information rather than treating every footpath edge as guaranteed usable. Ask what data would be needed for an evidence-led community access study.
Access, accuracy and privacy limits
Do not use a geospatial buffer to claim a person’s household is within a guaranteed journey time or eligibility catchment. Service access, walkability and legal boundaries require the appropriate official data and conditions.
Official mapping source: Map a library visitor’s access network rather than drawing a misleading circle. Check the dataset’s supported dates and licensing.
6. Test historical georeferencing with NLB’s Punggol Story Map
Where: NLB Curiocity’s Punggol story map and present OneMap geography.
The mapping problem
NLB documents that the historical place name Punggol included areas now associated with parts of Sengkang and Hougang. The story map uses SLA OneMap as its present-day base and draws on historical references, but explicitly says it is not comprehensive for every Punggol building. A historical map is a product of its time, scale and survey purpose. Georeferencing it against a modern map requires control points and careful uncertainty, not simply stretching an image until its road names look familiar.
Safe mapping procedure
Read the story map’s source notes and sketch a two-layer diagram: broad historical place naming and current map boundaries. Identify which features might be stable reference points and which may have changed through reclamation or road realignment. Write a georeferencing proposal listing three candidate control features and reasons each may be unreliable. Do not publish invented precise coordinates for former homes or say that an old village occupies a specific modern block without archival evidence.
Original worked example
A student overlays a crop of a historical Punggol map onto a new development and marks an old house at the entrance of a currently open shop. The old map’s scale and changed landscape do not justify that accuracy. The revised drawing shades an approximate historic context and attaches the archival date and uncertainty. This prevents a classroom GIS output from making a false historical claim.
A more demanding GIS question
Introduce root mean square error qualitatively as a way to assess fit against chosen control points, without inventing an exact calculated figure when points were never georeferenced. Discuss the risk of choosing only control points that support a desired conclusion and why the original map’s provenance must be preserved.
Access, accuracy and privacy limits
Do not use historical maps to navigate through closed construction sites, private buildings or restricted heritage areas. Respect rights in archival cartography and the source’s own stated limitations.
Official mapping source: Test historical georeferencing with NLB’s Punggol Story Map. Check the dataset’s supported dates and licensing.
7. Read Punggol Digital District’s planned footprint without assuming every path is open
Where: URA’s Punggol Digital District urban-design guidelines and JTC’s current public community map.
The mapping problem
URA’s guidelines describe the district as integrating SIT and JTC business-park developments in a transport-oriented, pedestrian-friendly setting. JTC’s current community information identifies operating amenities and the first opened stretch of the planned Heritage Trail. A planning boundary is not the same as an accessible walking route, and a completed transport station does not prove every depicted building phase is open. This is a useful geospatial source test because masterplan polygons and day-of-visit operating conditions answer different questions.
Safe mapping procedure
Read the latest URA boundary and design guidance and JTC’s current community page. Create separate legend classes for existing operating public facility, planned path, construction or unverified area, and district boundary. Mark only those statuses that an official current source supports. If a student wants to plan a walking route, use currently open entrances and paths from the site operator; do not draw a through-route on the masterplan as though the whole network is passable.
Original worked example
A student sees a roughly 1.3km planned Heritage Trail line and publishes a map encouraging visitors to walk its entire alignment. JTC’s current page identifies the first four hundred metres as open. The corrected map colours that section as documented open and leaves other stages unconfirmed. It becomes more useful to visitors without claiming the planning diagram itself was inaccurate.
A more demanding GIS question
Compare a land-use planning polygon with an actual pedestrian route network. Discuss why cadastral boundaries, access rights and physical footpaths may differ. Ask what update metadata a mobile wayfinding product would need to keep visitors from closed paths, and how the map should behave when opening status is unknown.
Access, accuracy and privacy limits
Never enter private SIT rooms, JTC business offices or worksite fences to verify a map. Treat plans, proposed links and actual opening notices as different evidence classes.
Official mapping source: Read Punggol Digital District’s planned footprint without assuming every path is open. Check the dataset’s supported dates and licensing.
8. Use SingStat planning-area population data without turning polygons into personal profiles
Where: SingStat 2026 planning-area demographic tables and OneMap Population Query documentation.
The mapping problem
SingStat releases geographic-distribution data by planning area and subzone, and OneMap documents Population Query endpoints for demographic information. Administrative boundaries are a convenient aggregation, but values for a whole polygon cannot tell us a particular resident’s age, household income or journey habits. A student mapping Punggol must record the reference year and exact boundary used. Furthermore, OneMap’s documented population-query examples may list older available years for particular endpoints; a current 2026 SingStat table is not automatically returned by every API method.
Safe mapping procedure
Choose one publicly released aggregate age statistic in SingStat’s 2026 publication and state its denominator, reference date and geography. Draw two fictional subzones with different population sizes to illustrate why identical colour shading can obscure absolute counts. Create a map legend that says whether colours represent numbers, percentages or categories. When considering OneMap’s API, read the actual documented supported years and response fields instead of silently assuming that every endpoint contains the newest table.
Original worked example
A student colours a hypothetical subzone dark because thirty per cent of its residents are below five, and then writes that it contains more children than a lighter-coloured subzone. Without total populations, that inference is invalid. The correction adds denominators and distinguishes a high share from a large number. The student also refrains from attaching one demographic percentage to a visible household or school group.
A more demanding GIS question
Compare choropleth shading by raw count against shading by proportion. Explain why raw totals can reflect area size or population scale and why rate maps answer different questions. Consider how boundary changes complicate time-series comparisons. Discuss uncertainty, suppression of sensitive small-area data and ethical aggregation choices.
Access, accuracy and privacy limits
Do not attempt to reidentify households through combinations of subzone data and other information. Use authentic dates, official sources and licensing rules. Demographic patterns are group descriptions, not personal dossiers.
Official mapping source: Use SingStat planning-area population data without turning polygons into personal profiles. Check the dataset’s supported dates and licensing.
9. Evaluate a safe routing map for step-free public access
Where: One Punggol, public transport nodes and BCA’s inclusive design principles.
The mapping problem
LTA and PA describe public transport and community-hub access, while BCA sets out Universal Design principles. A geospatial route intended for wheelchair users or visitors with prams needs more than a straight-line location. It may require data on lifts, curb crossings, surface conditions and temporary works. A network can be physically connected while unsuitable for a particular user. Building an ethical map means distinguishing confirmed information from assumed accessibility and never promising an unverified route.
Safe mapping procedure
Create a hypothetical small graph representing station, crossing, lift, hub entrance and library. Mark every link with its information status: verified, unverified or temporarily unavailable. Write a routing rule that refuses to guarantee step-free access when critical link data are missing, and instead prompts for current operator checking. Ask a peer to test the map with a fictional user who prefers rest stops or shelter. Revise labels that assume every user’s priorities are identical.
Original worked example
A route solver chooses the shortest path over a staircase because it has the smallest geometric length. For a user who requires step-free access, the path violates a stated constraint. The corrected graph removes incompatible edges from that hypothetical routing case and returns an alternative only when the necessary information is supported. If no verified path exists in the data, the honest result is ‘route not confirmed’.
A more demanding GIS question
Add a second criterion, such as fewer transfers or a nearby rest area, and discuss why accessibility is not one universal preference. Test the effect of a fictional lift outage while making clear that no real lift status has been measured. Explain why a user-facing interface should identify data currency and offer authorised updates.
Access, accuracy and privacy limits
Do not simulate a disability by using another person’s mobility aid, obstruct a lift for testing or invent current accessible-route conditions. Compliance determinations are professional matters; a student graph is an educational prototype.
Official mapping source: Evaluate a safe routing map for step-free public access. Check the dataset’s supported dates and licensing.
10. Build an ethical geospatial atlas of ten Punggol public facts
Where: A desk project using authoritative OneMap, NParks, LTA, NLB and JTC sources.
The mapping problem
A useful map atlas is a documented dataset, not just ten colourful pins. Each feature should have a verified locator, exact name, geometry type, source, last-check date, public access status and uncertainty. Punggol provides a diverse set: one integrated hub, a rail interchange, a newer terminal, a waterway path, a coastal park and a conserved structure. A student learns spatial data modelling by choosing appropriate points, lines and polygons for what the subject actually represents.
Safe mapping procedure
Select no more than ten publicly named Punggol features whose locations are supported by official sources. For each decide whether the map should represent a point, line or area. Keep exact private addresses, schoolchildren’s locations and sensitive wildlife points out of the atlas. Record sources and avoid applying one shared ‘open now’ status to every feature. Make a simple legend and ask a first-time reader to explain whether the line represents a trail, transit link, road or planning boundary. Correct any ambiguous symbol before publishing.
Original worked example
A student places a single dot labelled ‘8.4km Punggol Waterway Park Connector’ and claims the point is the whole route. A point might be useful as a locator or entrance, but the connector’s spatial extent is a line or route. The corrected atlas either uses an appropriately sourced polyline or labels the dot as a representative entrance, with the limitation clearly stated. This is a fundamental geometry-type repair.
A more demanding GIS question
Audit four error classes: ambiguous name, incorrect coordinate reference system, stale operating status and unsupported attribution. Create a version log and explain which errors could cause an inconvenient trip versus a serious safety problem. Consider map generalisation: on a small-scale printed map some detail must be omitted, but omission should not falsely turn planned routes into open ones.
Access, accuracy and privacy limits
Respect data licensing, avoid embedding OneMap credentials in public files and do not present hypothetical positions as official surveyed coordinates. Any map that names public services should be reviewed against current source and site access before distribution.
Official mapping source: Build an ethical geospatial atlas of ten Punggol public facts. Check the dataset’s supported dates and licensing.
A practical GIS data model
Create a table with a feature identifier, feature name, type, geometry, coordinate reference system, original source, as-of date, access condition and uncertainty. Keep the first version small. If a row represents Punggol Waterway Park Connector, type should indicate a route or line; if it represents One Punggol’s public address, identify whether the point is a public locator or a precise entrance. A record without a source or CRS should be treated as incomplete for a technical project.
Students can test the schema without collecting real coordinates. Use dummy geometries and compare how a routing graph fails when a nonexistent connection is inserted. Test a missing publication date, conflicting place names and an assumed open route. The error messages should identify which field needs checking, not silently fill it from guesses. A technically correct GeoJSON file can still carry false geographic claims, so content validation is essential.
Three Punggol geospatial study itineraries
A forty-five-minute OneMap desk session
Read OneMap’s main documentation, search for a genuine public destination, and identify what its location record refers to. Then study the coordinate conversion page and draw an input-output flow showing WGS84, SVY21 and Web Mercator. Use OneMap’s documented sample values rather than private home coordinates. End by explaining why a point’s CRS and object type are necessary to use it correctly.
A park-route comparison on paper
Read NParks’ descriptions of the 4.2km nature walk and 8.4km park connector. Create two independent records and a small map legend. Show an illustrative short public walking segment with a return route, and distinguish the length traced on paper from the official published route length. Do not force a long site visit or claim that both NParks distances describe the same exact polyline.
An urban change and accessibility atlas
Use URA and JTC to mark documented public amenities and planned district links. Add LTA’s Punggol Coast station as a confirmed operating rail node, and include NLB’s historical map as a separate dated interpretive layer. Test one fictional wheelchair access case using a graph whose link status may be unknown. Keep proposed features and unverified accessible paths clearly labelled instead of treating every line as ready to use.
Ten geospatial mistakes worth correcting before publication
- Map a building centroid as though it is a verified public entrance.
- Confuse WGS84 degrees with SVY21 or Web Mercator projected coordinates.
- Use extra decimal places as a substitute for locating the correct feature.
- Treat a schematic train map as a geographic scale drawing.
- Confuse 4.2km park nature walk and 8.4km park connector as one route.
- Use a straight-line buffer as proof of walking or step-free accessibility.
- Georeference an old historical map with fabricated exact control points.
- Present the whole planned Heritage Trail as open because it appears on a masterplan.
- Compare planning-area proportions without total population or time reference.
- Publish private household positions, sensitive wildlife locations or API secrets.
Frequently asked questions
What is geospatial science?
The study and use of data about location, spatial relationships, coordinates, maps and geographically distributed processes.
Is GIS the same as reading a normal map?
GIS can store and analyse structured spatial data, sources and geometry, beyond viewing a basemap.
What is OneMap?
SLA’s authoritative Singapore mapping platform with public map tools and documented APIs.
Can OneMap find Punggol addresses?
It provides search and geocoding services for supported roads, addresses and public places, subject to current data and terms.
What is a CRS?
A coordinate reference system that defines how location coordinates relate to Earth or a projected map.
What is WGS84?
A geographic reference system commonly used for latitude and longitude, represented as EPSG:4326.
What is SVY21?
Singapore’s local projected coordinate system, represented as EPSG:3414.
Why can I not interchange latitude with SVY21 X?
They use different definitions and units; valid transformation is required.
What is map scale?
The ratio between a distance shown on a map and the represented ground distance, under the map’s stated projection and conventions.
Is Punggol Waterway Park Connector 8.4km?
NParks lists the named park connector as 8.4km, while a separate nature walk is listed as 4.2km.
Is Punggol Coast MRT the same as Punggol Point LRT?
No. They are separate stations on different operating rail services.
What is graph topology?
The structure of connections among nodes, independently from exact visual distances.
What is a network service area?
The area reachable along an identified transport or pedestrian network under defined travel rules or costs.
Can a circular 500m buffer prove a five-minute walk?
No. Route geometry, crossings, speed, access and conditions matter.
Can I plot an exact historic village home from an old Punggol story map?
Not without evidence sufficient for that precision. Historical maps can be approximate and may predate later land changes.
Does a Punggol Digital District map prove every walkway is open?
No. Planned alignments and current operational access must be checked separately.
Which official source contains Punggol planning-area demographics?
SingStat publishes geographic-distribution datasets, and OneMap documents population-related API services with specific supported years.
Is a population proportion the same as an absolute count?
No. A proportion requires a denominator, and absolute numbers also depend on population size.
Can I make a step-free walking map from ordinary line geometry alone?
Not reliably. You need appropriate verified accessibility attributes and current operational conditions.
Can a student publish an online geospatial atlas?
Yes, using appropriately licensed public data, safe general locations, verified metadata and clear uncertainty labels.
Authoritative mapping sources and related Punggol learning
- Use SLA OneMap to locate a real public destination without guessing coordinates
- Distinguish WGS84 latitude-longitude from Singapore’s SVY21 grid
- Solve a scale and distance problem using the actual Punggol Waterway connector label
- Compare the topology of Punggol MRT and its two LRT loops
- Map a library visitor’s access network rather than drawing a misleading circle
- Test historical georeferencing with NLB’s Punggol Story Map
- Read Punggol Digital District’s planned footprint without assuming every path is open
- Use SingStat planning-area population data without turning polygons into personal profiles
- Evaluate a safe routing map for step-free public access
- Build an ethical geospatial atlas of ten Punggol public facts
- SLA OneMap coordinate conversions
- SLA OneMap population-query coverage and supported years
- JTC open district amenities and trail stages
- Punggol Geography field observations
- Punggol urban planning context
- Graph algorithms and careful data modelling
- Demographic inference and ethics
- eduKateSG step-by-step error repair learning model
The best map identifies both place and uncertainty
Punggol offers a compact introduction to geospatial science because public transport, waterway paths, older names, integrated services and phased new development overlap. Build a small accurate dataset before designing a large map. Check the feature geometry, coordinate reference system, source date and actual access, then repair the first mismatch. Spatial information becomes valuable when it helps a reader act correctly without exposing people or inventing precise locations.
The top 10 things to do in Punggol for Geospatial Science students are to geocode a public destination with SLA OneMap, distinguish WGS84 from SVY21 coordinates, compare official waterway route lengths, model MRT and LRT network topology, learn why a straight-line buffer is not a walking-distance service area, compare historical and present maps, distinguish planned Punggol Digital District geometry from actual access, map SingStat’s planning-area demographics responsibly, design step-free routing constraints and create an ethical ten-feature Punggol map atlas.
Start with OneMap and one known public destination. One Punggol at 1 Punggol Drive offers a verified address, public transport connections and several public services. Use SLA OneMap to look it up, then ask whether a map pin denotes a building, an entrance or a whole site. Do not invent a six-decimal-place coordinate from the centre of a screenshot. The next lesson is the difference between a point location, a route and a district boundary.
This October 2026 guide develops GIS, coordinate systems, map interpretation, routing, georeferencing and ethical spatial data use. It is not a replacement for surveying or a promise of real-time wayfinding. Source facts come from SLA, NParks, LTA, NLB, URA, JTC, SingStat and BCA. Numerical values in classroom examples are explicitly fictional unless attributed to an official route or dataset.
Choose the geospatial skill you need
- Location and geocoding: find a correct public address and state what the returned point means.
- Coordinate systems: distinguish degrees from projected coordinates and document the CRS.
- Map scale: convert units and identify which named route is being measured.
- Networks: model real station connections without assuming equal travel time.
- Accessibility: compare a circular radius with usable walking routes.
- Historical geography: align maps without assigning false modern coordinates to old settlements.
- Urban planning: distinguish a boundary or proposed link from open pedestrian infrastructure.
- Population mapping: preserve time, denominator and area boundaries.
- Cartographic ethics: omit private or sensitive locations and display uncertainty clearly.
The first geospatial question is what geometry represents the thing
A regional library may be shown as a public building point, a footprint polygon or an entrance location. A park connector is a path line rather than one dot. A planning area is an administrative polygon, not a specific household. Each representation supports different questions. A map can be technically valid while answering the wrong problem if it uses a building centroid to promise a wheelchair entrance or a straight-line distance to estimate walking time.
Coordinate metadata matters equally. OneMap documents WGS84 geographic coordinates and Singapore’s SVY21 projected system; confusing their numeric fields can put a point far from the intended location or create invalid positions. Even properly converted coordinates can be uncertain if the underlying input was only a guessed pin. Precision on screen does not establish accuracy on the ground. Students must record the CRS and the feature represented.
Finally, time is part of geography. LTA station services, park gate rules, construction phases and population distributions change. The effective opening of a path is not deduced from a masterplan alone, and a 2020 demographic API table is not automatically current for 2026. A trustworthy geospatial analysis records data currency, source and the status of unverified links.
Ten Punggol geospatial mapping exercises
1. Use SLA OneMap to locate a real public destination without guessing coordinates
Where: One Punggol at 1 Punggol Drive, using OneMap’s authoritative Singapore base map.
The mapping problem
OneMap is Singapore’s authoritative national map produced by SLA, with search and reverse-geocoding services covering local places and addresses. A geospatial student should begin by distinguishing a human-readable address, an officially named building and a coordinate pair. These are related but not identical forms of location information. When an online article calls a place ‘near Punggol MRT’, it has not supplied a precise official coordinate or demonstrated which pedestrian entrance is best. Searching the full verified One Punggol address provides a dependable starting record for map work.
Safe mapping procedure
Open OneMap’s public map or its documented search service and locate 1 Punggol Drive. Record the exact address string returned and the place type, using the name supplied by the source rather than an invented shortened label. Note whether the selected point represents a building, address centroid or entry location; these may differ. Make a screenshot only in accordance with map reuse terms, or draw an original diagram. Create a separate route question such as how a visitor would travel from Punggol MRT, then use routing information rather than a straight line to answer it.
Original worked example
A student uses a map’s display centre to create a latitude and longitude for the library entrance, claiming it is accurate to six decimal places. The point might be the building centre rather than the entrance. The correction records that it is a mapped building location with uncertain doorway precision and consults the venue’s directions for the actual visitor approach. Giving more decimal places does not make an unverified point correct.
A more demanding GIS question
Compare ordinary search with reverse geocoding using a documented public sample point. Ask what happens if two addresses share a large complex or an entrance lies on a different road. Discuss why geocoding results need verification and why a ‘best match’ algorithm can still return the wrong Punggol venue when the name is ambiguous.
Access, accuracy and privacy limits
Do not publish private family addresses or identify the homes of residents. OneMap API use may require account registration and tokens; follow official terms and avoid putting tokens into public WordPress source code.
Official mapping source: Use SLA OneMap to locate a real public destination without guessing coordinates. Check the dataset’s supported dates and licensing.
2. Distinguish WGS84 latitude-longitude from Singapore’s SVY21 grid
Where: A desktop OneMap coordinate-conversion lesson using fictional or OneMap’s own example coordinates.
The mapping problem
OneMap documents coordinate conversions among WGS84 EPSG:4326, SVY21 EPSG:3414 and Web Mercator EPSG:3857. These systems express location in different coordinate spaces. WGS84 provides angular latitude and longitude while Singapore’s SVY21 projected grid expresses easting and northing in a local system. A numeric pair without its coordinate reference system (CRS) can be misplotted or interpreted as an ordinary street distance. Coordinate literacy comes before placing pins on a map.
Safe mapping procedure
Read OneMap’s coordinate-converter page and write a table with the CRS name, EPSG identifier, type of coordinates and broad purpose. Use a documented example supplied by OneMap or a fully fictional point, clearly labelled, rather than a private location. Convert it using the official tool when properly authorised, and check both input order and output labels. For a paper test, compare why a latitude of approximately one degree north does not mean one metre north. Record output precision and note that projection transformations involve definitions and possible rounding.
Original worked example
A developer takes a sample pair labelled X=30,000 and Y=40,000 in SVY21 and pastes it into an application expecting WGS84 latitude and longitude. The point is invalid or misleading because the units and ranges differ. The correction identifies the source CRS and applies the documented transformation before mapping. It avoids treating X and longitude as the same field simply because both are horizontal coordinates.
A more demanding GIS question
Discuss Web Mercator’s visual convenience for online map tiles and its distortions, particularly toward high latitudes. Explain why projected units can be appropriate for local calculations when used correctly, while straight-line distances on an unverified pixel image cannot simply be read as actual walking travel. A good GIS file always documents the original CRS.
Access, accuracy and privacy limits
The OneMap conversion API may require a valid authentication token and has rate limits. Do not publish a token, invent successful transformations or claim a coordinate pair has been surveyed when it came from a simple web map.
Official mapping source: Distinguish WGS84 latitude-longitude from Singapore’s SVY21 grid. Check the dataset’s supported dates and licensing.
3. Solve a scale and distance problem using the actual Punggol Waterway connector label
Where: NParks Punggol Waterway Park and named Punggol Waterway Park Connector.
The mapping problem
NParks describes a 4.2-kilometre Waterway Park nature walk and separately an 8.4-kilometre Punggol Waterway Park Connector. Two nearby geographic features can share words in their titles while having different route extents. A correct geospatial analysis must identify which polyline the number applies to before calculating anything. It also distinguishes geographic distance, traced path length and actual travelled distance when a path is diverted or a visitor takes a side route.
Safe mapping procedure
Read the official pages for both named routes and create a small metadata table with name, source, published length and relevant map description. Convert 4.2km to 4,200m and 8.4km to 8,400m; do not assume their exact geometries or travel overlap from the numerical ratio. On paper draw a hypothetical 1:10,000 route map, where one centimetre represents one hundred metres, then calculate the length represented by a three-centimetre line. Label the paper map illustrative, not a downloaded survey of Punggol.
Original worked example
At 1:10,000 scale, three centimetres on the fictional drawing represent thirty thousand centimetres in the modelled ground, or three hundred metres. A learner first reports thirty kilometres because they multiply without reconciling units. Another learner divides 8.4 by 4.2 and says the connector is exactly two loops of the nature walk. The ratio is two, but the geographic route relationship has not been established. Both errors need different corrections.
A more demanding GIS question
Discuss why a path drawn as several straight segments can underestimate a winding actual route and why GPS traces can contain noise near buildings. Propose a method to compare the official named polyline with a GPS record if the owner had permission and appropriate data, without recording other walkers’ movements.
Access, accuracy and privacy limits
No activity requires the full walk. Do not place measuring tapes or tripods on shared paths, enter water or claim an official map’s dimensions are a current accessibility guarantee on every spur.
Official mapping source: Solve a scale and distance problem using the actual Punggol Waterway connector label. Check the dataset’s supported dates and licensing.
4. Compare the topology of Punggol MRT and its two LRT loops
Where: LTA’s current rail map, Punggol MRT NE17 and Punggol Coast MRT NE18.
The mapping problem
Topological questions concern what is connected to what, not the shape or visual size of a line. Punggol MRT is an interchange with East and West LRT loops, and LTA opened Punggol Coast MRT as the newer North East Line terminal in December 2024. A rail schematic simplifies geographic spacing to make connectivity easier to read. A student can use it to build a network graph while recognising that it is not a real-distance engineering survey or a source of exact train intervals.
Safe mapping procedure
Copy the correctly named operating stops from LTA’s current map and build a small graph with Punggol as a transfer node. Label different services and where a journey requires transferring. Write separate graph edge meanings: adjacency only, fictional equal cost or a documented real travel attribute. Never assign a cost without saying what it measures. Add a test where a user confuses Punggol Point LRT with Punggol Coast MRT and show the correct two different nodes.
Original worked example
A student places Punggol Point and Punggol Coast on one node because both contain the word ‘Punggol’. The resulting path appears to offer a direct transfer that does not exist. The correction assigns their proper LRT and MRT station identities and verifies the operating connection separately. Another error is claiming equal paper distances imply equal train travel time; a schematic is designed primarily for readability.
A more demanding GIS question
Build two small route models: one for fewest transfers and one with hypothetical travel-time weights. Discuss which is useful for a traveller with a stroller or limited stamina. Accessibility requires actual lift and pedestrian conditions, so an algorithm without current information should display uncertainty rather than promise a safe route.
Access, accuracy and privacy limits
Do not copy a 2028 rail masterplan as if every new connection is already operating. Follow current LTA passenger rules and keep algorithms purely educational; they are not real-time journey predictions.
Official mapping source: Compare the topology of Punggol MRT and its two LRT loops. Check the dataset’s supported dates and licensing.
5. Map a library visitor’s access network rather than drawing a misleading circle
Where: Punggol Regional Library at One Punggol and public pedestrian connections.
The mapping problem
GIS analysis often uses a circular buffer around a point to represent proximity, but people travel along paths, crossings, lifts and bridges. A circular half-kilometre buffer is not the same as a five-hundred-metre network service area. This difference matters around an interchange and a waterway, where a destination may appear close across water but require a longer walking route. A geospatial student should choose the representation that matches the decision and identify limitations when accessible paths are not verified.
Safe mapping procedure
Select One Punggol as a clearly named public destination. On an illustrative grid draw a five-hundred-metre radius circle and overlay a small hypothetical walking network containing one waterway and bridge. Count which model points are within the circle but not within five hundred metres of travel along the network. Then consult OneMap’s routing documentation for how actual walking routes might be obtained with proper authorised access. Do not invent a live travel-time metric for a particular resident.
Original worked example
An illustrative student map shows a point four hundred metres away in a straight line but seven hundred metres by a permitted path over a bridge. The circle includes the point; the walking-distance service area does not. Both calculations are internally correct but answer different questions. The correction is choosing the network representation for a visitor-access question and explaining that the data are synthetic.
A more demanding GIS question
Consider that a wheelchair-usable network may require different route attributes, including lifts, slopes or temporary closures, which ordinary map geometry may not provide. Define a rule for unknown accessibility information rather than treating every footpath edge as guaranteed usable. Ask what data would be needed for an evidence-led community access study.
Access, accuracy and privacy limits
Do not use a geospatial buffer to claim a person’s household is within a guaranteed journey time or eligibility catchment. Service access, walkability and legal boundaries require the appropriate official data and conditions.
Official mapping source: Map a library visitor’s access network rather than drawing a misleading circle. Check the dataset’s supported dates and licensing.
6. Test historical georeferencing with NLB’s Punggol Story Map
Where: NLB Curiocity’s Punggol story map and present OneMap geography.
The mapping problem
NLB documents that the historical place name Punggol included areas now associated with parts of Sengkang and Hougang. The story map uses SLA OneMap as its present-day base and draws on historical references, but explicitly says it is not comprehensive for every Punggol building. A historical map is a product of its time, scale and survey purpose. Georeferencing it against a modern map requires control points and careful uncertainty, not simply stretching an image until its road names look familiar.
Safe mapping procedure
Read the story map’s source notes and sketch a two-layer diagram: broad historical place naming and current map boundaries. Identify which features might be stable reference points and which may have changed through reclamation or road realignment. Write a georeferencing proposal listing three candidate control features and reasons each may be unreliable. Do not publish invented precise coordinates for former homes or say that an old village occupies a specific modern block without archival evidence.
Original worked example
A student overlays a crop of a historical Punggol map onto a new development and marks an old house at the entrance of a currently open shop. The old map’s scale and changed landscape do not justify that accuracy. The revised drawing shades an approximate historic context and attaches the archival date and uncertainty. This prevents a classroom GIS output from making a false historical claim.
A more demanding GIS question
Introduce root mean square error qualitatively as a way to assess fit against chosen control points, without inventing an exact calculated figure when points were never georeferenced. Discuss the risk of choosing only control points that support a desired conclusion and why the original map’s provenance must be preserved.
Access, accuracy and privacy limits
Do not use historical maps to navigate through closed construction sites, private buildings or restricted heritage areas. Respect rights in archival cartography and the source’s own stated limitations.
Official mapping source: Test historical georeferencing with NLB’s Punggol Story Map. Check the dataset’s supported dates and licensing.
7. Read Punggol Digital District’s planned footprint without assuming every path is open
Where: URA’s Punggol Digital District urban-design guidelines and JTC’s current public community map.
The mapping problem
URA’s guidelines describe the district as integrating SIT and JTC business-park developments in a transport-oriented, pedestrian-friendly setting. JTC’s current community information identifies operating amenities and the first opened stretch of the planned Heritage Trail. A planning boundary is not the same as an accessible walking route, and a completed transport station does not prove every depicted building phase is open. This is a useful geospatial source test because masterplan polygons and day-of-visit operating conditions answer different questions.
Safe mapping procedure
Read the latest URA boundary and design guidance and JTC’s current community page. Create separate legend classes for existing operating public facility, planned path, construction or unverified area, and district boundary. Mark only those statuses that an official current source supports. If a student wants to plan a walking route, use currently open entrances and paths from the site operator; do not draw a through-route on the masterplan as though the whole network is passable.
Original worked example
A student sees a roughly 1.3km planned Heritage Trail line and publishes a map encouraging visitors to walk its entire alignment. JTC’s current page identifies the first four hundred metres as open. The corrected map colours that section as documented open and leaves other stages unconfirmed. It becomes more useful to visitors without claiming the planning diagram itself was inaccurate.
A more demanding GIS question
Compare a land-use planning polygon with an actual pedestrian route network. Discuss why cadastral boundaries, access rights and physical footpaths may differ. Ask what update metadata a mobile wayfinding product would need to keep visitors from closed paths, and how the map should behave when opening status is unknown.
Access, accuracy and privacy limits
Never enter private SIT rooms, JTC business offices or worksite fences to verify a map. Treat plans, proposed links and actual opening notices as different evidence classes.
Official mapping source: Read Punggol Digital District’s planned footprint without assuming every path is open. Check the dataset’s supported dates and licensing.
8. Use SingStat planning-area population data without turning polygons into personal profiles
Where: SingStat 2026 planning-area demographic tables and OneMap Population Query documentation.
The mapping problem
SingStat releases geographic-distribution data by planning area and subzone, and OneMap documents Population Query endpoints for demographic information. Administrative boundaries are a convenient aggregation, but values for a whole polygon cannot tell us a particular resident’s age, household income or journey habits. A student mapping Punggol must record the reference year and exact boundary used. Furthermore, OneMap’s documented population-query examples may list older available years for particular endpoints; a current 2026 SingStat table is not automatically returned by every API method.
Safe mapping procedure
Choose one publicly released aggregate age statistic in SingStat’s 2026 publication and state its denominator, reference date and geography. Draw two fictional subzones with different population sizes to illustrate why identical colour shading can obscure absolute counts. Create a map legend that says whether colours represent numbers, percentages or categories. When considering OneMap’s API, read the actual documented supported years and response fields instead of silently assuming that every endpoint contains the newest table.
Original worked example
A student colours a hypothetical subzone dark because thirty per cent of its residents are below five, and then writes that it contains more children than a lighter-coloured subzone. Without total populations, that inference is invalid. The correction adds denominators and distinguishes a high share from a large number. The student also refrains from attaching one demographic percentage to a visible household or school group.
A more demanding GIS question
Compare choropleth shading by raw count against shading by proportion. Explain why raw totals can reflect area size or population scale and why rate maps answer different questions. Consider how boundary changes complicate time-series comparisons. Discuss uncertainty, suppression of sensitive small-area data and ethical aggregation choices.
Access, accuracy and privacy limits
Do not attempt to reidentify households through combinations of subzone data and other information. Use authentic dates, official sources and licensing rules. Demographic patterns are group descriptions, not personal dossiers.
Official mapping source: Use SingStat planning-area population data without turning polygons into personal profiles. Check the dataset’s supported dates and licensing.
9. Evaluate a safe routing map for step-free public access
Where: One Punggol, public transport nodes and BCA’s inclusive design principles.
The mapping problem
LTA and PA describe public transport and community-hub access, while BCA sets out Universal Design principles. A geospatial route intended for wheelchair users or visitors with prams needs more than a straight-line location. It may require data on lifts, curb crossings, surface conditions and temporary works. A network can be physically connected while unsuitable for a particular user. Building an ethical map means distinguishing confirmed information from assumed accessibility and never promising an unverified route.
Safe mapping procedure
Create a hypothetical small graph representing station, crossing, lift, hub entrance and library. Mark every link with its information status: verified, unverified or temporarily unavailable. Write a routing rule that refuses to guarantee step-free access when critical link data are missing, and instead prompts for current operator checking. Ask a peer to test the map with a fictional user who prefers rest stops or shelter. Revise labels that assume every user’s priorities are identical.
Original worked example
A route solver chooses the shortest path over a staircase because it has the smallest geometric length. For a user who requires step-free access, the path violates a stated constraint. The corrected graph removes incompatible edges from that hypothetical routing case and returns an alternative only when the necessary information is supported. If no verified path exists in the data, the honest result is ‘route not confirmed’.
A more demanding GIS question
Add a second criterion, such as fewer transfers or a nearby rest area, and discuss why accessibility is not one universal preference. Test the effect of a fictional lift outage while making clear that no real lift status has been measured. Explain why a user-facing interface should identify data currency and offer authorised updates.
Access, accuracy and privacy limits
Do not simulate a disability by using another person’s mobility aid, obstruct a lift for testing or invent current accessible-route conditions. Compliance determinations are professional matters; a student graph is an educational prototype.
Official mapping source: Evaluate a safe routing map for step-free public access. Check the dataset’s supported dates and licensing.
10. Build an ethical geospatial atlas of ten Punggol public facts
Where: A desk project using authoritative OneMap, NParks, LTA, NLB and JTC sources.
The mapping problem
A useful map atlas is a documented dataset, not just ten colourful pins. Each feature should have a verified locator, exact name, geometry type, source, last-check date, public access status and uncertainty. Punggol provides a diverse set: one integrated hub, a rail interchange, a newer terminal, a waterway path, a coastal park and a conserved structure. A student learns spatial data modelling by choosing appropriate points, lines and polygons for what the subject actually represents.
Safe mapping procedure
Select no more than ten publicly named Punggol features whose locations are supported by official sources. For each decide whether the map should represent a point, line or area. Keep exact private addresses, schoolchildren’s locations and sensitive wildlife points out of the atlas. Record sources and avoid applying one shared ‘open now’ status to every feature. Make a simple legend and ask a first-time reader to explain whether the line represents a trail, transit link, road or planning boundary. Correct any ambiguous symbol before publishing.
Original worked example
A student places a single dot labelled ‘8.4km Punggol Waterway Park Connector’ and claims the point is the whole route. A point might be useful as a locator or entrance, but the connector’s spatial extent is a line or route. The corrected atlas either uses an appropriately sourced polyline or labels the dot as a representative entrance, with the limitation clearly stated. This is a fundamental geometry-type repair.
A more demanding GIS question
Audit four error classes: ambiguous name, incorrect coordinate reference system, stale operating status and unsupported attribution. Create a version log and explain which errors could cause an inconvenient trip versus a serious safety problem. Consider map generalisation: on a small-scale printed map some detail must be omitted, but omission should not falsely turn planned routes into open ones.
Access, accuracy and privacy limits
Respect data licensing, avoid embedding OneMap credentials in public files and do not present hypothetical positions as official surveyed coordinates. Any map that names public services should be reviewed against current source and site access before distribution.
Official mapping source: Build an ethical geospatial atlas of ten Punggol public facts. Check the dataset’s supported dates and licensing.
A practical GIS data model
Create a table with a feature identifier, feature name, type, geometry, coordinate reference system, original source, as-of date, access condition and uncertainty. Keep the first version small. If a row represents Punggol Waterway Park Connector, type should indicate a route or line; if it represents One Punggol’s public address, identify whether the point is a public locator or a precise entrance. A record without a source or CRS should be treated as incomplete for a technical project.
Students can test the schema without collecting real coordinates. Use dummy geometries and compare how a routing graph fails when a nonexistent connection is inserted. Test a missing publication date, conflicting place names and an assumed open route. The error messages should identify which field needs checking, not silently fill it from guesses. A technically correct GeoJSON file can still carry false geographic claims, so content validation is essential.
Three Punggol geospatial study itineraries
A forty-five-minute OneMap desk session
Read OneMap’s main documentation, search for a genuine public destination, and identify what its location record refers to. Then study the coordinate conversion page and draw an input-output flow showing WGS84, SVY21 and Web Mercator. Use OneMap’s documented sample values rather than private home coordinates. End by explaining why a point’s CRS and object type are necessary to use it correctly.
A park-route comparison on paper
Read NParks’ descriptions of the 4.2km nature walk and 8.4km park connector. Create two independent records and a small map legend. Show an illustrative short public walking segment with a return route, and distinguish the length traced on paper from the official published route length. Do not force a long site visit or claim that both NParks distances describe the same exact polyline.
An urban change and accessibility atlas
Use URA and JTC to mark documented public amenities and planned district links. Add LTA’s Punggol Coast station as a confirmed operating rail node, and include NLB’s historical map as a separate dated interpretive layer. Test one fictional wheelchair access case using a graph whose link status may be unknown. Keep proposed features and unverified accessible paths clearly labelled instead of treating every line as ready to use.
Ten geospatial mistakes worth correcting before publication
- Map a building centroid as though it is a verified public entrance.
- Confuse WGS84 degrees with SVY21 or Web Mercator projected coordinates.
- Use extra decimal places as a substitute for locating the correct feature.
- Treat a schematic train map as a geographic scale drawing.
- Confuse 4.2km park nature walk and 8.4km park connector as one route.
- Use a straight-line buffer as proof of walking or step-free accessibility.
- Georeference an old historical map with fabricated exact control points.
- Present the whole planned Heritage Trail as open because it appears on a masterplan.
- Compare planning-area proportions without total population or time reference.
- Publish private household positions, sensitive wildlife locations or API secrets.
Frequently asked questions
What is geospatial science?
The study and use of data about location, spatial relationships, coordinates, maps and geographically distributed processes.
Is GIS the same as reading a normal map?
GIS can store and analyse structured spatial data, sources and geometry, beyond viewing a basemap.
What is OneMap?
SLA’s authoritative Singapore mapping platform with public map tools and documented APIs.
Can OneMap find Punggol addresses?
It provides search and geocoding services for supported roads, addresses and public places, subject to current data and terms.
What is a CRS?
A coordinate reference system that defines how location coordinates relate to Earth or a projected map.
What is WGS84?
A geographic reference system commonly used for latitude and longitude, represented as EPSG:4326.
What is SVY21?
Singapore’s local projected coordinate system, represented as EPSG:3414.
Why can I not interchange latitude with SVY21 X?
They use different definitions and units; valid transformation is required.
What is map scale?
The ratio between a distance shown on a map and the represented ground distance, under the map’s stated projection and conventions.
Is Punggol Waterway Park Connector 8.4km?
NParks lists the named park connector as 8.4km, while a separate nature walk is listed as 4.2km.
Is Punggol Coast MRT the same as Punggol Point LRT?
No. They are separate stations on different operating rail services.
What is graph topology?
The structure of connections among nodes, independently from exact visual distances.
What is a network service area?
The area reachable along an identified transport or pedestrian network under defined travel rules or costs.
Can a circular 500m buffer prove a five-minute walk?
No. Route geometry, crossings, speed, access and conditions matter.
Can I plot an exact historic village home from an old Punggol story map?
Not without evidence sufficient for that precision. Historical maps can be approximate and may predate later land changes.
Does a Punggol Digital District map prove every walkway is open?
No. Planned alignments and current operational access must be checked separately.
Which official source contains Punggol planning-area demographics?
SingStat publishes geographic-distribution datasets, and OneMap documents population-related API services with specific supported years.
Is a population proportion the same as an absolute count?
No. A proportion requires a denominator, and absolute numbers also depend on population size.
Can I make a step-free walking map from ordinary line geometry alone?
Not reliably. You need appropriate verified accessibility attributes and current operational conditions.
Can a student publish an online geospatial atlas?
Yes, using appropriately licensed public data, safe general locations, verified metadata and clear uncertainty labels.
Authoritative mapping sources and related Punggol learning
- Use SLA OneMap to locate a real public destination without guessing coordinates
- Distinguish WGS84 latitude-longitude from Singapore’s SVY21 grid
- Solve a scale and distance problem using the actual Punggol Waterway connector label
- Compare the topology of Punggol MRT and its two LRT loops
- Map a library visitor’s access network rather than drawing a misleading circle
- Test historical georeferencing with NLB’s Punggol Story Map
- Read Punggol Digital District’s planned footprint without assuming every path is open
- Use SingStat planning-area population data without turning polygons into personal profiles
- Evaluate a safe routing map for step-free public access
- Build an ethical geospatial atlas of ten Punggol public facts
- SLA OneMap coordinate conversions
- SLA OneMap population-query coverage and supported years
- JTC open district amenities and trail stages
- Punggol Geography field observations
- Punggol urban planning context
- Graph algorithms and careful data modelling
- Demographic inference and ethics
- eduKateSG step-by-step error repair learning model
The best map identifies both place and uncertainty
Punggol offers a compact introduction to geospatial science because public transport, waterway paths, older names, integrated services and phased new development overlap. Build a small accurate dataset before designing a large map. Check the feature geometry, coordinate reference system, source date and actual access, then repair the first mismatch. Spatial information becomes valuable when it helps a reader act correctly without exposing people or inventing precise locations.
- Location and geocoding: find a correct public address and state what the returned point means.
- Coordinate systems: distinguish degrees from projected coordinates and document the CRS.
- Map scale: convert units and identify which named route is being measured.
- Networks: model real station connections without assuming equal travel time.
- Accessibility: compare a circular radius with usable walking routes.
- Historical geography: align maps without assigning false modern coordinates to old settlements.
- Urban planning: distinguish a boundary or proposed link from open pedestrian infrastructure.
- Population mapping: preserve time, denominator and area boundaries.
- Cartographic ethics: omit private or sensitive locations and display uncertainty clearly.
The first geospatial question is what geometry represents the thing
A regional library may be shown as a public building point, a footprint polygon or an entrance location. A park connector is a path line rather than one dot. A planning area is an administrative polygon, not a specific household. Each representation supports different questions. A map can be technically valid while answering the wrong problem if it uses a building centroid to promise a wheelchair entrance or a straight-line distance to estimate walking time.
Coordinate metadata matters equally. OneMap documents WGS84 geographic coordinates and Singapore’s SVY21 projected system; confusing their numeric fields can put a point far from the intended location or create invalid positions. Even properly converted coordinates can be uncertain if the underlying input was only a guessed pin. Precision on screen does not establish accuracy on the ground. Students must record the CRS and the feature represented.
Finally, time is part of geography. LTA station services, park gate rules, construction phases and population distributions change. The effective opening of a path is not deduced from a masterplan alone, and a 2020 demographic API table is not automatically current for 2026. A trustworthy geospatial analysis records data currency, source and the status of unverified links.
Ten Punggol geospatial mapping exercises
1. Use SLA OneMap to locate a real public destination without guessing coordinates
Where: One Punggol at 1 Punggol Drive, using OneMap’s authoritative Singapore base map.
The mapping problem
OneMap is Singapore’s authoritative national map produced by SLA, with search and reverse-geocoding services covering local places and addresses. A geospatial student should begin by distinguishing a human-readable address, an officially named building and a coordinate pair. These are related but not identical forms of location information. When an online article calls a place ‘near Punggol MRT’, it has not supplied a precise official coordinate or demonstrated which pedestrian entrance is best. Searching the full verified One Punggol address provides a dependable starting record for map work.
Safe mapping procedure
Open OneMap’s public map or its documented search service and locate 1 Punggol Drive. Record the exact address string returned and the place type, using the name supplied by the source rather than an invented shortened label. Note whether the selected point represents a building, address centroid or entry location; these may differ. Make a screenshot only in accordance with map reuse terms, or draw an original diagram. Create a separate route question such as how a visitor would travel from Punggol MRT, then use routing information rather than a straight line to answer it.
Original worked example
A student uses a map’s display centre to create a latitude and longitude for the library entrance, claiming it is accurate to six decimal places. The point might be the building centre rather than the entrance. The correction records that it is a mapped building location with uncertain doorway precision and consults the venue’s directions for the actual visitor approach. Giving more decimal places does not make an unverified point correct.
A more demanding GIS question
Compare ordinary search with reverse geocoding using a documented public sample point. Ask what happens if two addresses share a large complex or an entrance lies on a different road. Discuss why geocoding results need verification and why a ‘best match’ algorithm can still return the wrong Punggol venue when the name is ambiguous.
Access, accuracy and privacy limits
Do not publish private family addresses or identify the homes of residents. OneMap API use may require account registration and tokens; follow official terms and avoid putting tokens into public WordPress source code.
Official mapping source: Use SLA OneMap to locate a real public destination without guessing coordinates. Check the dataset’s supported dates and licensing.
2. Distinguish WGS84 latitude-longitude from Singapore’s SVY21 grid
Where: A desktop OneMap coordinate-conversion lesson using fictional or OneMap’s own example coordinates.
The mapping problem
OneMap documents coordinate conversions among WGS84 EPSG:4326, SVY21 EPSG:3414 and Web Mercator EPSG:3857. These systems express location in different coordinate spaces. WGS84 provides angular latitude and longitude while Singapore’s SVY21 projected grid expresses easting and northing in a local system. A numeric pair without its coordinate reference system (CRS) can be misplotted or interpreted as an ordinary street distance. Coordinate literacy comes before placing pins on a map.
Safe mapping procedure
Read OneMap’s coordinate-converter page and write a table with the CRS name, EPSG identifier, type of coordinates and broad purpose. Use a documented example supplied by OneMap or a fully fictional point, clearly labelled, rather than a private location. Convert it using the official tool when properly authorised, and check both input order and output labels. For a paper test, compare why a latitude of approximately one degree north does not mean one metre north. Record output precision and note that projection transformations involve definitions and possible rounding.
Original worked example
A developer takes a sample pair labelled X=30,000 and Y=40,000 in SVY21 and pastes it into an application expecting WGS84 latitude and longitude. The point is invalid or misleading because the units and ranges differ. The correction identifies the source CRS and applies the documented transformation before mapping. It avoids treating X and longitude as the same field simply because both are horizontal coordinates.
A more demanding GIS question
Discuss Web Mercator’s visual convenience for online map tiles and its distortions, particularly toward high latitudes. Explain why projected units can be appropriate for local calculations when used correctly, while straight-line distances on an unverified pixel image cannot simply be read as actual walking travel. A good GIS file always documents the original CRS.
Access, accuracy and privacy limits
The OneMap conversion API may require a valid authentication token and has rate limits. Do not publish a token, invent successful transformations or claim a coordinate pair has been surveyed when it came from a simple web map.
Official mapping source: Distinguish WGS84 latitude-longitude from Singapore’s SVY21 grid. Check the dataset’s supported dates and licensing.
3. Solve a scale and distance problem using the actual Punggol Waterway connector label
Where: NParks Punggol Waterway Park and named Punggol Waterway Park Connector.
The mapping problem
NParks describes a 4.2-kilometre Waterway Park nature walk and separately an 8.4-kilometre Punggol Waterway Park Connector. Two nearby geographic features can share words in their titles while having different route extents. A correct geospatial analysis must identify which polyline the number applies to before calculating anything. It also distinguishes geographic distance, traced path length and actual travelled distance when a path is diverted or a visitor takes a side route.
Safe mapping procedure
Read the official pages for both named routes and create a small metadata table with name, source, published length and relevant map description. Convert 4.2km to 4,200m and 8.4km to 8,400m; do not assume their exact geometries or travel overlap from the numerical ratio. On paper draw a hypothetical 1:10,000 route map, where one centimetre represents one hundred metres, then calculate the length represented by a three-centimetre line. Label the paper map illustrative, not a downloaded survey of Punggol.
Original worked example
At 1:10,000 scale, three centimetres on the fictional drawing represent thirty thousand centimetres in the modelled ground, or three hundred metres. A learner first reports thirty kilometres because they multiply without reconciling units. Another learner divides 8.4 by 4.2 and says the connector is exactly two loops of the nature walk. The ratio is two, but the geographic route relationship has not been established. Both errors need different corrections.
A more demanding GIS question
Discuss why a path drawn as several straight segments can underestimate a winding actual route and why GPS traces can contain noise near buildings. Propose a method to compare the official named polyline with a GPS record if the owner had permission and appropriate data, without recording other walkers’ movements.
Access, accuracy and privacy limits
No activity requires the full walk. Do not place measuring tapes or tripods on shared paths, enter water or claim an official map’s dimensions are a current accessibility guarantee on every spur.
Official mapping source: Solve a scale and distance problem using the actual Punggol Waterway connector label. Check the dataset’s supported dates and licensing.
4. Compare the topology of Punggol MRT and its two LRT loops
Where: LTA’s current rail map, Punggol MRT NE17 and Punggol Coast MRT NE18.
The mapping problem
Topological questions concern what is connected to what, not the shape or visual size of a line. Punggol MRT is an interchange with East and West LRT loops, and LTA opened Punggol Coast MRT as the newer North East Line terminal in December 2024. A rail schematic simplifies geographic spacing to make connectivity easier to read. A student can use it to build a network graph while recognising that it is not a real-distance engineering survey or a source of exact train intervals.
Safe mapping procedure
Copy the correctly named operating stops from LTA’s current map and build a small graph with Punggol as a transfer node. Label different services and where a journey requires transferring. Write separate graph edge meanings: adjacency only, fictional equal cost or a documented real travel attribute. Never assign a cost without saying what it measures. Add a test where a user confuses Punggol Point LRT with Punggol Coast MRT and show the correct two different nodes.
Original worked example
A student places Punggol Point and Punggol Coast on one node because both contain the word ‘Punggol’. The resulting path appears to offer a direct transfer that does not exist. The correction assigns their proper LRT and MRT station identities and verifies the operating connection separately. Another error is claiming equal paper distances imply equal train travel time; a schematic is designed primarily for readability.
A more demanding GIS question
Build two small route models: one for fewest transfers and one with hypothetical travel-time weights. Discuss which is useful for a traveller with a stroller or limited stamina. Accessibility requires actual lift and pedestrian conditions, so an algorithm without current information should display uncertainty rather than promise a safe route.
Access, accuracy and privacy limits
Do not copy a 2028 rail masterplan as if every new connection is already operating. Follow current LTA passenger rules and keep algorithms purely educational; they are not real-time journey predictions.
Official mapping source: Compare the topology of Punggol MRT and its two LRT loops. Check the dataset’s supported dates and licensing.
5. Map a library visitor’s access network rather than drawing a misleading circle
Where: Punggol Regional Library at One Punggol and public pedestrian connections.
The mapping problem
GIS analysis often uses a circular buffer around a point to represent proximity, but people travel along paths, crossings, lifts and bridges. A circular half-kilometre buffer is not the same as a five-hundred-metre network service area. This difference matters around an interchange and a waterway, where a destination may appear close across water but require a longer walking route. A geospatial student should choose the representation that matches the decision and identify limitations when accessible paths are not verified.
Safe mapping procedure
Select One Punggol as a clearly named public destination. On an illustrative grid draw a five-hundred-metre radius circle and overlay a small hypothetical walking network containing one waterway and bridge. Count which model points are within the circle but not within five hundred metres of travel along the network. Then consult OneMap’s routing documentation for how actual walking routes might be obtained with proper authorised access. Do not invent a live travel-time metric for a particular resident.
Original worked example
An illustrative student map shows a point four hundred metres away in a straight line but seven hundred metres by a permitted path over a bridge. The circle includes the point; the walking-distance service area does not. Both calculations are internally correct but answer different questions. The correction is choosing the network representation for a visitor-access question and explaining that the data are synthetic.
A more demanding GIS question
Consider that a wheelchair-usable network may require different route attributes, including lifts, slopes or temporary closures, which ordinary map geometry may not provide. Define a rule for unknown accessibility information rather than treating every footpath edge as guaranteed usable. Ask what data would be needed for an evidence-led community access study.
Access, accuracy and privacy limits
Do not use a geospatial buffer to claim a person’s household is within a guaranteed journey time or eligibility catchment. Service access, walkability and legal boundaries require the appropriate official data and conditions.
Official mapping source: Map a library visitor’s access network rather than drawing a misleading circle. Check the dataset’s supported dates and licensing.
6. Test historical georeferencing with NLB’s Punggol Story Map
Where: NLB Curiocity’s Punggol story map and present OneMap geography.
The mapping problem
NLB documents that the historical place name Punggol included areas now associated with parts of Sengkang and Hougang. The story map uses SLA OneMap as its present-day base and draws on historical references, but explicitly says it is not comprehensive for every Punggol building. A historical map is a product of its time, scale and survey purpose. Georeferencing it against a modern map requires control points and careful uncertainty, not simply stretching an image until its road names look familiar.
Safe mapping procedure
Read the story map’s source notes and sketch a two-layer diagram: broad historical place naming and current map boundaries. Identify which features might be stable reference points and which may have changed through reclamation or road realignment. Write a georeferencing proposal listing three candidate control features and reasons each may be unreliable. Do not publish invented precise coordinates for former homes or say that an old village occupies a specific modern block without archival evidence.
Original worked example
A student overlays a crop of a historical Punggol map onto a new development and marks an old house at the entrance of a currently open shop. The old map’s scale and changed landscape do not justify that accuracy. The revised drawing shades an approximate historic context and attaches the archival date and uncertainty. This prevents a classroom GIS output from making a false historical claim.
A more demanding GIS question
Introduce root mean square error qualitatively as a way to assess fit against chosen control points, without inventing an exact calculated figure when points were never georeferenced. Discuss the risk of choosing only control points that support a desired conclusion and why the original map’s provenance must be preserved.
Access, accuracy and privacy limits
Do not use historical maps to navigate through closed construction sites, private buildings or restricted heritage areas. Respect rights in archival cartography and the source’s own stated limitations.
Official mapping source: Test historical georeferencing with NLB’s Punggol Story Map. Check the dataset’s supported dates and licensing.
7. Read Punggol Digital District’s planned footprint without assuming every path is open
Where: URA’s Punggol Digital District urban-design guidelines and JTC’s current public community map.
The mapping problem
URA’s guidelines describe the district as integrating SIT and JTC business-park developments in a transport-oriented, pedestrian-friendly setting. JTC’s current community information identifies operating amenities and the first opened stretch of the planned Heritage Trail. A planning boundary is not the same as an accessible walking route, and a completed transport station does not prove every depicted building phase is open. This is a useful geospatial source test because masterplan polygons and day-of-visit operating conditions answer different questions.
Safe mapping procedure
Read the latest URA boundary and design guidance and JTC’s current community page. Create separate legend classes for existing operating public facility, planned path, construction or unverified area, and district boundary. Mark only those statuses that an official current source supports. If a student wants to plan a walking route, use currently open entrances and paths from the site operator; do not draw a through-route on the masterplan as though the whole network is passable.
Original worked example
A student sees a roughly 1.3km planned Heritage Trail line and publishes a map encouraging visitors to walk its entire alignment. JTC’s current page identifies the first four hundred metres as open. The corrected map colours that section as documented open and leaves other stages unconfirmed. It becomes more useful to visitors without claiming the planning diagram itself was inaccurate.
A more demanding GIS question
Compare a land-use planning polygon with an actual pedestrian route network. Discuss why cadastral boundaries, access rights and physical footpaths may differ. Ask what update metadata a mobile wayfinding product would need to keep visitors from closed paths, and how the map should behave when opening status is unknown.
Access, accuracy and privacy limits
Never enter private SIT rooms, JTC business offices or worksite fences to verify a map. Treat plans, proposed links and actual opening notices as different evidence classes.
Official mapping source: Read Punggol Digital District’s planned footprint without assuming every path is open. Check the dataset’s supported dates and licensing.
8. Use SingStat planning-area population data without turning polygons into personal profiles
Where: SingStat 2026 planning-area demographic tables and OneMap Population Query documentation.
The mapping problem
SingStat releases geographic-distribution data by planning area and subzone, and OneMap documents Population Query endpoints for demographic information. Administrative boundaries are a convenient aggregation, but values for a whole polygon cannot tell us a particular resident’s age, household income or journey habits. A student mapping Punggol must record the reference year and exact boundary used. Furthermore, OneMap’s documented population-query examples may list older available years for particular endpoints; a current 2026 SingStat table is not automatically returned by every API method.
Safe mapping procedure
Choose one publicly released aggregate age statistic in SingStat’s 2026 publication and state its denominator, reference date and geography. Draw two fictional subzones with different population sizes to illustrate why identical colour shading can obscure absolute counts. Create a map legend that says whether colours represent numbers, percentages or categories. When considering OneMap’s API, read the actual documented supported years and response fields instead of silently assuming that every endpoint contains the newest table.
Original worked example
A student colours a hypothetical subzone dark because thirty per cent of its residents are below five, and then writes that it contains more children than a lighter-coloured subzone. Without total populations, that inference is invalid. The correction adds denominators and distinguishes a high share from a large number. The student also refrains from attaching one demographic percentage to a visible household or school group.
A more demanding GIS question
Compare choropleth shading by raw count against shading by proportion. Explain why raw totals can reflect area size or population scale and why rate maps answer different questions. Consider how boundary changes complicate time-series comparisons. Discuss uncertainty, suppression of sensitive small-area data and ethical aggregation choices.
Access, accuracy and privacy limits
Do not attempt to reidentify households through combinations of subzone data and other information. Use authentic dates, official sources and licensing rules. Demographic patterns are group descriptions, not personal dossiers.
Official mapping source: Use SingStat planning-area population data without turning polygons into personal profiles. Check the dataset’s supported dates and licensing.
9. Evaluate a safe routing map for step-free public access
Where: One Punggol, public transport nodes and BCA’s inclusive design principles.
The mapping problem
LTA and PA describe public transport and community-hub access, while BCA sets out Universal Design principles. A geospatial route intended for wheelchair users or visitors with prams needs more than a straight-line location. It may require data on lifts, curb crossings, surface conditions and temporary works. A network can be physically connected while unsuitable for a particular user. Building an ethical map means distinguishing confirmed information from assumed accessibility and never promising an unverified route.
Safe mapping procedure
Create a hypothetical small graph representing station, crossing, lift, hub entrance and library. Mark every link with its information status: verified, unverified or temporarily unavailable. Write a routing rule that refuses to guarantee step-free access when critical link data are missing, and instead prompts for current operator checking. Ask a peer to test the map with a fictional user who prefers rest stops or shelter. Revise labels that assume every user’s priorities are identical.
Original worked example
A route solver chooses the shortest path over a staircase because it has the smallest geometric length. For a user who requires step-free access, the path violates a stated constraint. The corrected graph removes incompatible edges from that hypothetical routing case and returns an alternative only when the necessary information is supported. If no verified path exists in the data, the honest result is ‘route not confirmed’.
A more demanding GIS question
Add a second criterion, such as fewer transfers or a nearby rest area, and discuss why accessibility is not one universal preference. Test the effect of a fictional lift outage while making clear that no real lift status has been measured. Explain why a user-facing interface should identify data currency and offer authorised updates.
Access, accuracy and privacy limits
Do not simulate a disability by using another person’s mobility aid, obstruct a lift for testing or invent current accessible-route conditions. Compliance determinations are professional matters; a student graph is an educational prototype.
Official mapping source: Evaluate a safe routing map for step-free public access. Check the dataset’s supported dates and licensing.
10. Build an ethical geospatial atlas of ten Punggol public facts
Where: A desk project using authoritative OneMap, NParks, LTA, NLB and JTC sources.
The mapping problem
A useful map atlas is a documented dataset, not just ten colourful pins. Each feature should have a verified locator, exact name, geometry type, source, last-check date, public access status and uncertainty. Punggol provides a diverse set: one integrated hub, a rail interchange, a newer terminal, a waterway path, a coastal park and a conserved structure. A student learns spatial data modelling by choosing appropriate points, lines and polygons for what the subject actually represents.
Safe mapping procedure
Select no more than ten publicly named Punggol features whose locations are supported by official sources. For each decide whether the map should represent a point, line or area. Keep exact private addresses, schoolchildren’s locations and sensitive wildlife points out of the atlas. Record sources and avoid applying one shared ‘open now’ status to every feature. Make a simple legend and ask a first-time reader to explain whether the line represents a trail, transit link, road or planning boundary. Correct any ambiguous symbol before publishing.
Original worked example
A student places a single dot labelled ‘8.4km Punggol Waterway Park Connector’ and claims the point is the whole route. A point might be useful as a locator or entrance, but the connector’s spatial extent is a line or route. The corrected atlas either uses an appropriately sourced polyline or labels the dot as a representative entrance, with the limitation clearly stated. This is a fundamental geometry-type repair.
A more demanding GIS question
Audit four error classes: ambiguous name, incorrect coordinate reference system, stale operating status and unsupported attribution. Create a version log and explain which errors could cause an inconvenient trip versus a serious safety problem. Consider map generalisation: on a small-scale printed map some detail must be omitted, but omission should not falsely turn planned routes into open ones.
Access, accuracy and privacy limits
Respect data licensing, avoid embedding OneMap credentials in public files and do not present hypothetical positions as official surveyed coordinates. Any map that names public services should be reviewed against current source and site access before distribution.
Official mapping source: Build an ethical geospatial atlas of ten Punggol public facts. Check the dataset’s supported dates and licensing.
A practical GIS data model
Create a table with a feature identifier, feature name, type, geometry, coordinate reference system, original source, as-of date, access condition and uncertainty. Keep the first version small. If a row represents Punggol Waterway Park Connector, type should indicate a route or line; if it represents One Punggol’s public address, identify whether the point is a public locator or a precise entrance. A record without a source or CRS should be treated as incomplete for a technical project.
Students can test the schema without collecting real coordinates. Use dummy geometries and compare how a routing graph fails when a nonexistent connection is inserted. Test a missing publication date, conflicting place names and an assumed open route. The error messages should identify which field needs checking, not silently fill it from guesses. A technically correct GeoJSON file can still carry false geographic claims, so content validation is essential.
Three Punggol geospatial study itineraries
A forty-five-minute OneMap desk session
Read OneMap’s main documentation, search for a genuine public destination, and identify what its location record refers to. Then study the coordinate conversion page and draw an input-output flow showing WGS84, SVY21 and Web Mercator. Use OneMap’s documented sample values rather than private home coordinates. End by explaining why a point’s CRS and object type are necessary to use it correctly.
A park-route comparison on paper
Read NParks’ descriptions of the 4.2km nature walk and 8.4km park connector. Create two independent records and a small map legend. Show an illustrative short public walking segment with a return route, and distinguish the length traced on paper from the official published route length. Do not force a long site visit or claim that both NParks distances describe the same exact polyline.
An urban change and accessibility atlas
Use URA and JTC to mark documented public amenities and planned district links. Add LTA’s Punggol Coast station as a confirmed operating rail node, and include NLB’s historical map as a separate dated interpretive layer. Test one fictional wheelchair access case using a graph whose link status may be unknown. Keep proposed features and unverified accessible paths clearly labelled instead of treating every line as ready to use.
Ten geospatial mistakes worth correcting before publication
- Map a building centroid as though it is a verified public entrance.
- Confuse WGS84 degrees with SVY21 or Web Mercator projected coordinates.
- Use extra decimal places as a substitute for locating the correct feature.
- Treat a schematic train map as a geographic scale drawing.
- Confuse 4.2km park nature walk and 8.4km park connector as one route.
- Use a straight-line buffer as proof of walking or step-free accessibility.
- Georeference an old historical map with fabricated exact control points.
- Present the whole planned Heritage Trail as open because it appears on a masterplan.
- Compare planning-area proportions without total population or time reference.
- Publish private household positions, sensitive wildlife locations or API secrets.
Frequently asked questions
What is geospatial science?
The study and use of data about location, spatial relationships, coordinates, maps and geographically distributed processes.
Is GIS the same as reading a normal map?
GIS can store and analyse structured spatial data, sources and geometry, beyond viewing a basemap.
What is OneMap?
SLA’s authoritative Singapore mapping platform with public map tools and documented APIs.
Can OneMap find Punggol addresses?
It provides search and geocoding services for supported roads, addresses and public places, subject to current data and terms.
What is a CRS?
A coordinate reference system that defines how location coordinates relate to Earth or a projected map.
What is WGS84?
A geographic reference system commonly used for latitude and longitude, represented as EPSG:4326.
What is SVY21?
Singapore’s local projected coordinate system, represented as EPSG:3414.
Why can I not interchange latitude with SVY21 X?
They use different definitions and units; valid transformation is required.
What is map scale?
The ratio between a distance shown on a map and the represented ground distance, under the map’s stated projection and conventions.
Is Punggol Waterway Park Connector 8.4km?
NParks lists the named park connector as 8.4km, while a separate nature walk is listed as 4.2km.
Is Punggol Coast MRT the same as Punggol Point LRT?
No. They are separate stations on different operating rail services.
What is graph topology?
The structure of connections among nodes, independently from exact visual distances.
What is a network service area?
The area reachable along an identified transport or pedestrian network under defined travel rules or costs.
Can a circular 500m buffer prove a five-minute walk?
No. Route geometry, crossings, speed, access and conditions matter.
Can I plot an exact historic village home from an old Punggol story map?
Not without evidence sufficient for that precision. Historical maps can be approximate and may predate later land changes.
Does a Punggol Digital District map prove every walkway is open?
No. Planned alignments and current operational access must be checked separately.
Which official source contains Punggol planning-area demographics?
SingStat publishes geographic-distribution datasets, and OneMap documents population-related API services with specific supported years.
Is a population proportion the same as an absolute count?
No. A proportion requires a denominator, and absolute numbers also depend on population size.
Can I make a step-free walking map from ordinary line geometry alone?
Not reliably. You need appropriate verified accessibility attributes and current operational conditions.
Can a student publish an online geospatial atlas?
Yes, using appropriately licensed public data, safe general locations, verified metadata and clear uncertainty labels.
Authoritative mapping sources and related Punggol learning
- Use SLA OneMap to locate a real public destination without guessing coordinates
- Distinguish WGS84 latitude-longitude from Singapore’s SVY21 grid
- Solve a scale and distance problem using the actual Punggol Waterway connector label
- Compare the topology of Punggol MRT and its two LRT loops
- Map a library visitor’s access network rather than drawing a misleading circle
- Test historical georeferencing with NLB’s Punggol Story Map
- Read Punggol Digital District’s planned footprint without assuming every path is open
- Use SingStat planning-area population data without turning polygons into personal profiles
- Evaluate a safe routing map for step-free public access
- Build an ethical geospatial atlas of ten Punggol public facts
- SLA OneMap coordinate conversions
- SLA OneMap population-query coverage and supported years
- JTC open district amenities and trail stages
- Punggol Geography field observations
- Punggol urban planning context
- Graph algorithms and careful data modelling
- Demographic inference and ethics
- eduKateSG step-by-step error repair learning model
The best map identifies both place and uncertainty
Punggol offers a compact introduction to geospatial science because public transport, waterway paths, older names, integrated services and phased new development overlap. Build a small accurate dataset before designing a large map. Check the feature geometry, coordinate reference system, source date and actual access, then repair the first mismatch. Spatial information becomes valuable when it helps a reader act correctly without exposing people or inventing precise locations.
The top 10 things to do in Punggol for Geospatial Science students are to geocode a public destination with SLA OneMap, distinguish WGS84 from SVY21 coordinates, compare official waterway route lengths, model MRT and LRT network topology, learn why a straight-line buffer is not a walking-distance service area, compare historical and present maps, distinguish planned Punggol Digital District geometry from actual access, map SingStat’s planning-area demographics responsibly, design step-free routing constraints and create an ethical ten-feature Punggol map atlas.
Start with OneMap and one known public destination. One Punggol at 1 Punggol Drive offers a verified address, public transport connections and several public services. Use SLA OneMap to look it up, then ask whether a map pin denotes a building, an entrance or a whole site. Do not invent a six-decimal-place coordinate from the centre of a screenshot. The next lesson is the difference between a point location, a route and a district boundary.
This October 2026 guide develops GIS, coordinate systems, map interpretation, routing, georeferencing and ethical spatial data use. It is not a replacement for surveying or a promise of real-time wayfinding. Source facts come from SLA, NParks, LTA, NLB, URA, JTC, SingStat and BCA. Numerical values in classroom examples are explicitly fictional unless attributed to an official route or dataset.
Choose the geospatial skill you need
- Location and geocoding: find a correct public address and state what the returned point means.
- Coordinate systems: distinguish degrees from projected coordinates and document the CRS.
- Map scale: convert units and identify which named route is being measured.
- Networks: model real station connections without assuming equal travel time.
- Accessibility: compare a circular radius with usable walking routes.
- Historical geography: align maps without assigning false modern coordinates to old settlements.
- Urban planning: distinguish a boundary or proposed link from open pedestrian infrastructure.
- Population mapping: preserve time, denominator and area boundaries.
- Cartographic ethics: omit private or sensitive locations and display uncertainty clearly.
The first geospatial question is what geometry represents the thing
A regional library may be shown as a public building point, a footprint polygon or an entrance location. A park connector is a path line rather than one dot. A planning area is an administrative polygon, not a specific household. Each representation supports different questions. A map can be technically valid while answering the wrong problem if it uses a building centroid to promise a wheelchair entrance or a straight-line distance to estimate walking time.
Coordinate metadata matters equally. OneMap documents WGS84 geographic coordinates and Singapore’s SVY21 projected system; confusing their numeric fields can put a point far from the intended location or create invalid positions. Even properly converted coordinates can be uncertain if the underlying input was only a guessed pin. Precision on screen does not establish accuracy on the ground. Students must record the CRS and the feature represented.
Finally, time is part of geography. LTA station services, park gate rules, construction phases and population distributions change. The effective opening of a path is not deduced from a masterplan alone, and a 2020 demographic API table is not automatically current for 2026. A trustworthy geospatial analysis records data currency, source and the status of unverified links.
Ten Punggol geospatial mapping exercises
1. Use SLA OneMap to locate a real public destination without guessing coordinates
Where: One Punggol at 1 Punggol Drive, using OneMap’s authoritative Singapore base map.
The mapping problem
OneMap is Singapore’s authoritative national map produced by SLA, with search and reverse-geocoding services covering local places and addresses. A geospatial student should begin by distinguishing a human-readable address, an officially named building and a coordinate pair. These are related but not identical forms of location information. When an online article calls a place ‘near Punggol MRT’, it has not supplied a precise official coordinate or demonstrated which pedestrian entrance is best. Searching the full verified One Punggol address provides a dependable starting record for map work.
Safe mapping procedure
Open OneMap’s public map or its documented search service and locate 1 Punggol Drive. Record the exact address string returned and the place type, using the name supplied by the source rather than an invented shortened label. Note whether the selected point represents a building, address centroid or entry location; these may differ. Make a screenshot only in accordance with map reuse terms, or draw an original diagram. Create a separate route question such as how a visitor would travel from Punggol MRT, then use routing information rather than a straight line to answer it.
Original worked example
A student uses a map’s display centre to create a latitude and longitude for the library entrance, claiming it is accurate to six decimal places. The point might be the building centre rather than the entrance. The correction records that it is a mapped building location with uncertain doorway precision and consults the venue’s directions for the actual visitor approach. Giving more decimal places does not make an unverified point correct.
A more demanding GIS question
Compare ordinary search with reverse geocoding using a documented public sample point. Ask what happens if two addresses share a large complex or an entrance lies on a different road. Discuss why geocoding results need verification and why a ‘best match’ algorithm can still return the wrong Punggol venue when the name is ambiguous.
Access, accuracy and privacy limits
Do not publish private family addresses or identify the homes of residents. OneMap API use may require account registration and tokens; follow official terms and avoid putting tokens into public WordPress source code.
Official mapping source: Use SLA OneMap to locate a real public destination without guessing coordinates. Check the dataset’s supported dates and licensing.
2. Distinguish WGS84 latitude-longitude from Singapore’s SVY21 grid
Where: A desktop OneMap coordinate-conversion lesson using fictional or OneMap’s own example coordinates.
The mapping problem
OneMap documents coordinate conversions among WGS84 EPSG:4326, SVY21 EPSG:3414 and Web Mercator EPSG:3857. These systems express location in different coordinate spaces. WGS84 provides angular latitude and longitude while Singapore’s SVY21 projected grid expresses easting and northing in a local system. A numeric pair without its coordinate reference system (CRS) can be misplotted or interpreted as an ordinary street distance. Coordinate literacy comes before placing pins on a map.
Safe mapping procedure
Read OneMap’s coordinate-converter page and write a table with the CRS name, EPSG identifier, type of coordinates and broad purpose. Use a documented example supplied by OneMap or a fully fictional point, clearly labelled, rather than a private location. Convert it using the official tool when properly authorised, and check both input order and output labels. For a paper test, compare why a latitude of approximately one degree north does not mean one metre north. Record output precision and note that projection transformations involve definitions and possible rounding.
Original worked example
A developer takes a sample pair labelled X=30,000 and Y=40,000 in SVY21 and pastes it into an application expecting WGS84 latitude and longitude. The point is invalid or misleading because the units and ranges differ. The correction identifies the source CRS and applies the documented transformation before mapping. It avoids treating X and longitude as the same field simply because both are horizontal coordinates.
A more demanding GIS question
Discuss Web Mercator’s visual convenience for online map tiles and its distortions, particularly toward high latitudes. Explain why projected units can be appropriate for local calculations when used correctly, while straight-line distances on an unverified pixel image cannot simply be read as actual walking travel. A good GIS file always documents the original CRS.
Access, accuracy and privacy limits
The OneMap conversion API may require a valid authentication token and has rate limits. Do not publish a token, invent successful transformations or claim a coordinate pair has been surveyed when it came from a simple web map.
Official mapping source: Distinguish WGS84 latitude-longitude from Singapore’s SVY21 grid. Check the dataset’s supported dates and licensing.
3. Solve a scale and distance problem using the actual Punggol Waterway connector label
Where: NParks Punggol Waterway Park and named Punggol Waterway Park Connector.
The mapping problem
NParks describes a 4.2-kilometre Waterway Park nature walk and separately an 8.4-kilometre Punggol Waterway Park Connector. Two nearby geographic features can share words in their titles while having different route extents. A correct geospatial analysis must identify which polyline the number applies to before calculating anything. It also distinguishes geographic distance, traced path length and actual travelled distance when a path is diverted or a visitor takes a side route.
Safe mapping procedure
Read the official pages for both named routes and create a small metadata table with name, source, published length and relevant map description. Convert 4.2km to 4,200m and 8.4km to 8,400m; do not assume their exact geometries or travel overlap from the numerical ratio. On paper draw a hypothetical 1:10,000 route map, where one centimetre represents one hundred metres, then calculate the length represented by a three-centimetre line. Label the paper map illustrative, not a downloaded survey of Punggol.
Original worked example
At 1:10,000 scale, three centimetres on the fictional drawing represent thirty thousand centimetres in the modelled ground, or three hundred metres. A learner first reports thirty kilometres because they multiply without reconciling units. Another learner divides 8.4 by 4.2 and says the connector is exactly two loops of the nature walk. The ratio is two, but the geographic route relationship has not been established. Both errors need different corrections.
A more demanding GIS question
Discuss why a path drawn as several straight segments can underestimate a winding actual route and why GPS traces can contain noise near buildings. Propose a method to compare the official named polyline with a GPS record if the owner had permission and appropriate data, without recording other walkers’ movements.
Access, accuracy and privacy limits
No activity requires the full walk. Do not place measuring tapes or tripods on shared paths, enter water or claim an official map’s dimensions are a current accessibility guarantee on every spur.
Official mapping source: Solve a scale and distance problem using the actual Punggol Waterway connector label. Check the dataset’s supported dates and licensing.
4. Compare the topology of Punggol MRT and its two LRT loops
Where: LTA’s current rail map, Punggol MRT NE17 and Punggol Coast MRT NE18.
The mapping problem
Topological questions concern what is connected to what, not the shape or visual size of a line. Punggol MRT is an interchange with East and West LRT loops, and LTA opened Punggol Coast MRT as the newer North East Line terminal in December 2024. A rail schematic simplifies geographic spacing to make connectivity easier to read. A student can use it to build a network graph while recognising that it is not a real-distance engineering survey or a source of exact train intervals.
Safe mapping procedure
Copy the correctly named operating stops from LTA’s current map and build a small graph with Punggol as a transfer node. Label different services and where a journey requires transferring. Write separate graph edge meanings: adjacency only, fictional equal cost or a documented real travel attribute. Never assign a cost without saying what it measures. Add a test where a user confuses Punggol Point LRT with Punggol Coast MRT and show the correct two different nodes.
Original worked example
A student places Punggol Point and Punggol Coast on one node because both contain the word ‘Punggol’. The resulting path appears to offer a direct transfer that does not exist. The correction assigns their proper LRT and MRT station identities and verifies the operating connection separately. Another error is claiming equal paper distances imply equal train travel time; a schematic is designed primarily for readability.
A more demanding GIS question
Build two small route models: one for fewest transfers and one with hypothetical travel-time weights. Discuss which is useful for a traveller with a stroller or limited stamina. Accessibility requires actual lift and pedestrian conditions, so an algorithm without current information should display uncertainty rather than promise a safe route.
Access, accuracy and privacy limits
Do not copy a 2028 rail masterplan as if every new connection is already operating. Follow current LTA passenger rules and keep algorithms purely educational; they are not real-time journey predictions.
Official mapping source: Compare the topology of Punggol MRT and its two LRT loops. Check the dataset’s supported dates and licensing.
5. Map a library visitor’s access network rather than drawing a misleading circle
Where: Punggol Regional Library at One Punggol and public pedestrian connections.
The mapping problem
GIS analysis often uses a circular buffer around a point to represent proximity, but people travel along paths, crossings, lifts and bridges. A circular half-kilometre buffer is not the same as a five-hundred-metre network service area. This difference matters around an interchange and a waterway, where a destination may appear close across water but require a longer walking route. A geospatial student should choose the representation that matches the decision and identify limitations when accessible paths are not verified.
Safe mapping procedure
Select One Punggol as a clearly named public destination. On an illustrative grid draw a five-hundred-metre radius circle and overlay a small hypothetical walking network containing one waterway and bridge. Count which model points are within the circle but not within five hundred metres of travel along the network. Then consult OneMap’s routing documentation for how actual walking routes might be obtained with proper authorised access. Do not invent a live travel-time metric for a particular resident.
Original worked example
An illustrative student map shows a point four hundred metres away in a straight line but seven hundred metres by a permitted path over a bridge. The circle includes the point; the walking-distance service area does not. Both calculations are internally correct but answer different questions. The correction is choosing the network representation for a visitor-access question and explaining that the data are synthetic.
A more demanding GIS question
Consider that a wheelchair-usable network may require different route attributes, including lifts, slopes or temporary closures, which ordinary map geometry may not provide. Define a rule for unknown accessibility information rather than treating every footpath edge as guaranteed usable. Ask what data would be needed for an evidence-led community access study.
Access, accuracy and privacy limits
Do not use a geospatial buffer to claim a person’s household is within a guaranteed journey time or eligibility catchment. Service access, walkability and legal boundaries require the appropriate official data and conditions.
Official mapping source: Map a library visitor’s access network rather than drawing a misleading circle. Check the dataset’s supported dates and licensing.
6. Test historical georeferencing with NLB’s Punggol Story Map
Where: NLB Curiocity’s Punggol story map and present OneMap geography.
The mapping problem
NLB documents that the historical place name Punggol included areas now associated with parts of Sengkang and Hougang. The story map uses SLA OneMap as its present-day base and draws on historical references, but explicitly says it is not comprehensive for every Punggol building. A historical map is a product of its time, scale and survey purpose. Georeferencing it against a modern map requires control points and careful uncertainty, not simply stretching an image until its road names look familiar.
Safe mapping procedure
Read the story map’s source notes and sketch a two-layer diagram: broad historical place naming and current map boundaries. Identify which features might be stable reference points and which may have changed through reclamation or road realignment. Write a georeferencing proposal listing three candidate control features and reasons each may be unreliable. Do not publish invented precise coordinates for former homes or say that an old village occupies a specific modern block without archival evidence.
Original worked example
A student overlays a crop of a historical Punggol map onto a new development and marks an old house at the entrance of a currently open shop. The old map’s scale and changed landscape do not justify that accuracy. The revised drawing shades an approximate historic context and attaches the archival date and uncertainty. This prevents a classroom GIS output from making a false historical claim.
A more demanding GIS question
Introduce root mean square error qualitatively as a way to assess fit against chosen control points, without inventing an exact calculated figure when points were never georeferenced. Discuss the risk of choosing only control points that support a desired conclusion and why the original map’s provenance must be preserved.
Access, accuracy and privacy limits
Do not use historical maps to navigate through closed construction sites, private buildings or restricted heritage areas. Respect rights in archival cartography and the source’s own stated limitations.
Official mapping source: Test historical georeferencing with NLB’s Punggol Story Map. Check the dataset’s supported dates and licensing.
7. Read Punggol Digital District’s planned footprint without assuming every path is open
Where: URA’s Punggol Digital District urban-design guidelines and JTC’s current public community map.
The mapping problem
URA’s guidelines describe the district as integrating SIT and JTC business-park developments in a transport-oriented, pedestrian-friendly setting. JTC’s current community information identifies operating amenities and the first opened stretch of the planned Heritage Trail. A planning boundary is not the same as an accessible walking route, and a completed transport station does not prove every depicted building phase is open. This is a useful geospatial source test because masterplan polygons and day-of-visit operating conditions answer different questions.
Safe mapping procedure
Read the latest URA boundary and design guidance and JTC’s current community page. Create separate legend classes for existing operating public facility, planned path, construction or unverified area, and district boundary. Mark only those statuses that an official current source supports. If a student wants to plan a walking route, use currently open entrances and paths from the site operator; do not draw a through-route on the masterplan as though the whole network is passable.
Original worked example
A student sees a roughly 1.3km planned Heritage Trail line and publishes a map encouraging visitors to walk its entire alignment. JTC’s current page identifies the first four hundred metres as open. The corrected map colours that section as documented open and leaves other stages unconfirmed. It becomes more useful to visitors without claiming the planning diagram itself was inaccurate.
A more demanding GIS question
Compare a land-use planning polygon with an actual pedestrian route network. Discuss why cadastral boundaries, access rights and physical footpaths may differ. Ask what update metadata a mobile wayfinding product would need to keep visitors from closed paths, and how the map should behave when opening status is unknown.
Access, accuracy and privacy limits
Never enter private SIT rooms, JTC business offices or worksite fences to verify a map. Treat plans, proposed links and actual opening notices as different evidence classes.
Official mapping source: Read Punggol Digital District’s planned footprint without assuming every path is open. Check the dataset’s supported dates and licensing.
8. Use SingStat planning-area population data without turning polygons into personal profiles
Where: SingStat 2026 planning-area demographic tables and OneMap Population Query documentation.
The mapping problem
SingStat releases geographic-distribution data by planning area and subzone, and OneMap documents Population Query endpoints for demographic information. Administrative boundaries are a convenient aggregation, but values for a whole polygon cannot tell us a particular resident’s age, household income or journey habits. A student mapping Punggol must record the reference year and exact boundary used. Furthermore, OneMap’s documented population-query examples may list older available years for particular endpoints; a current 2026 SingStat table is not automatically returned by every API method.
Safe mapping procedure
Choose one publicly released aggregate age statistic in SingStat’s 2026 publication and state its denominator, reference date and geography. Draw two fictional subzones with different population sizes to illustrate why identical colour shading can obscure absolute counts. Create a map legend that says whether colours represent numbers, percentages or categories. When considering OneMap’s API, read the actual documented supported years and response fields instead of silently assuming that every endpoint contains the newest table.
Original worked example
A student colours a hypothetical subzone dark because thirty per cent of its residents are below five, and then writes that it contains more children than a lighter-coloured subzone. Without total populations, that inference is invalid. The correction adds denominators and distinguishes a high share from a large number. The student also refrains from attaching one demographic percentage to a visible household or school group.
A more demanding GIS question
Compare choropleth shading by raw count against shading by proportion. Explain why raw totals can reflect area size or population scale and why rate maps answer different questions. Consider how boundary changes complicate time-series comparisons. Discuss uncertainty, suppression of sensitive small-area data and ethical aggregation choices.
Access, accuracy and privacy limits
Do not attempt to reidentify households through combinations of subzone data and other information. Use authentic dates, official sources and licensing rules. Demographic patterns are group descriptions, not personal dossiers.
Official mapping source: Use SingStat planning-area population data without turning polygons into personal profiles. Check the dataset’s supported dates and licensing.
9. Evaluate a safe routing map for step-free public access
Where: One Punggol, public transport nodes and BCA’s inclusive design principles.
The mapping problem
LTA and PA describe public transport and community-hub access, while BCA sets out Universal Design principles. A geospatial route intended for wheelchair users or visitors with prams needs more than a straight-line location. It may require data on lifts, curb crossings, surface conditions and temporary works. A network can be physically connected while unsuitable for a particular user. Building an ethical map means distinguishing confirmed information from assumed accessibility and never promising an unverified route.
Safe mapping procedure
Create a hypothetical small graph representing station, crossing, lift, hub entrance and library. Mark every link with its information status: verified, unverified or temporarily unavailable. Write a routing rule that refuses to guarantee step-free access when critical link data are missing, and instead prompts for current operator checking. Ask a peer to test the map with a fictional user who prefers rest stops or shelter. Revise labels that assume every user’s priorities are identical.
Original worked example
A route solver chooses the shortest path over a staircase because it has the smallest geometric length. For a user who requires step-free access, the path violates a stated constraint. The corrected graph removes incompatible edges from that hypothetical routing case and returns an alternative only when the necessary information is supported. If no verified path exists in the data, the honest result is ‘route not confirmed’.
A more demanding GIS question
Add a second criterion, such as fewer transfers or a nearby rest area, and discuss why accessibility is not one universal preference. Test the effect of a fictional lift outage while making clear that no real lift status has been measured. Explain why a user-facing interface should identify data currency and offer authorised updates.
Access, accuracy and privacy limits
Do not simulate a disability by using another person’s mobility aid, obstruct a lift for testing or invent current accessible-route conditions. Compliance determinations are professional matters; a student graph is an educational prototype.
Official mapping source: Evaluate a safe routing map for step-free public access. Check the dataset’s supported dates and licensing.
10. Build an ethical geospatial atlas of ten Punggol public facts
Where: A desk project using authoritative OneMap, NParks, LTA, NLB and JTC sources.
The mapping problem
A useful map atlas is a documented dataset, not just ten colourful pins. Each feature should have a verified locator, exact name, geometry type, source, last-check date, public access status and uncertainty. Punggol provides a diverse set: one integrated hub, a rail interchange, a newer terminal, a waterway path, a coastal park and a conserved structure. A student learns spatial data modelling by choosing appropriate points, lines and polygons for what the subject actually represents.
Safe mapping procedure
Select no more than ten publicly named Punggol features whose locations are supported by official sources. For each decide whether the map should represent a point, line or area. Keep exact private addresses, schoolchildren’s locations and sensitive wildlife points out of the atlas. Record sources and avoid applying one shared ‘open now’ status to every feature. Make a simple legend and ask a first-time reader to explain whether the line represents a trail, transit link, road or planning boundary. Correct any ambiguous symbol before publishing.
Original worked example
A student places a single dot labelled ‘8.4km Punggol Waterway Park Connector’ and claims the point is the whole route. A point might be useful as a locator or entrance, but the connector’s spatial extent is a line or route. The corrected atlas either uses an appropriately sourced polyline or labels the dot as a representative entrance, with the limitation clearly stated. This is a fundamental geometry-type repair.
A more demanding GIS question
Audit four error classes: ambiguous name, incorrect coordinate reference system, stale operating status and unsupported attribution. Create a version log and explain which errors could cause an inconvenient trip versus a serious safety problem. Consider map generalisation: on a small-scale printed map some detail must be omitted, but omission should not falsely turn planned routes into open ones.
Access, accuracy and privacy limits
Respect data licensing, avoid embedding OneMap credentials in public files and do not present hypothetical positions as official surveyed coordinates. Any map that names public services should be reviewed against current source and site access before distribution.
Official mapping source: Build an ethical geospatial atlas of ten Punggol public facts. Check the dataset’s supported dates and licensing.
A practical GIS data model
Create a table with a feature identifier, feature name, type, geometry, coordinate reference system, original source, as-of date, access condition and uncertainty. Keep the first version small. If a row represents Punggol Waterway Park Connector, type should indicate a route or line; if it represents One Punggol’s public address, identify whether the point is a public locator or a precise entrance. A record without a source or CRS should be treated as incomplete for a technical project.
Students can test the schema without collecting real coordinates. Use dummy geometries and compare how a routing graph fails when a nonexistent connection is inserted. Test a missing publication date, conflicting place names and an assumed open route. The error messages should identify which field needs checking, not silently fill it from guesses. A technically correct GeoJSON file can still carry false geographic claims, so content validation is essential.
Three Punggol geospatial study itineraries
A forty-five-minute OneMap desk session
Read OneMap’s main documentation, search for a genuine public destination, and identify what its location record refers to. Then study the coordinate conversion page and draw an input-output flow showing WGS84, SVY21 and Web Mercator. Use OneMap’s documented sample values rather than private home coordinates. End by explaining why a point’s CRS and object type are necessary to use it correctly.
A park-route comparison on paper
Read NParks’ descriptions of the 4.2km nature walk and 8.4km park connector. Create two independent records and a small map legend. Show an illustrative short public walking segment with a return route, and distinguish the length traced on paper from the official published route length. Do not force a long site visit or claim that both NParks distances describe the same exact polyline.
An urban change and accessibility atlas
Use URA and JTC to mark documented public amenities and planned district links. Add LTA’s Punggol Coast station as a confirmed operating rail node, and include NLB’s historical map as a separate dated interpretive layer. Test one fictional wheelchair access case using a graph whose link status may be unknown. Keep proposed features and unverified accessible paths clearly labelled instead of treating every line as ready to use.
Ten geospatial mistakes worth correcting before publication
- Map a building centroid as though it is a verified public entrance.
- Confuse WGS84 degrees with SVY21 or Web Mercator projected coordinates.
- Use extra decimal places as a substitute for locating the correct feature.
- Treat a schematic train map as a geographic scale drawing.
- Confuse 4.2km park nature walk and 8.4km park connector as one route.
- Use a straight-line buffer as proof of walking or step-free accessibility.
- Georeference an old historical map with fabricated exact control points.
- Present the whole planned Heritage Trail as open because it appears on a masterplan.
- Compare planning-area proportions without total population or time reference.
- Publish private household positions, sensitive wildlife locations or API secrets.
Frequently asked questions
What is geospatial science?
The study and use of data about location, spatial relationships, coordinates, maps and geographically distributed processes.
Is GIS the same as reading a normal map?
GIS can store and analyse structured spatial data, sources and geometry, beyond viewing a basemap.
What is OneMap?
SLA’s authoritative Singapore mapping platform with public map tools and documented APIs.
Can OneMap find Punggol addresses?
It provides search and geocoding services for supported roads, addresses and public places, subject to current data and terms.
What is a CRS?
A coordinate reference system that defines how location coordinates relate to Earth or a projected map.
What is WGS84?
A geographic reference system commonly used for latitude and longitude, represented as EPSG:4326.
What is SVY21?
Singapore’s local projected coordinate system, represented as EPSG:3414.
Why can I not interchange latitude with SVY21 X?
They use different definitions and units; valid transformation is required.
What is map scale?
The ratio between a distance shown on a map and the represented ground distance, under the map’s stated projection and conventions.
Is Punggol Waterway Park Connector 8.4km?
NParks lists the named park connector as 8.4km, while a separate nature walk is listed as 4.2km.
Is Punggol Coast MRT the same as Punggol Point LRT?
No. They are separate stations on different operating rail services.
What is graph topology?
The structure of connections among nodes, independently from exact visual distances.
What is a network service area?
The area reachable along an identified transport or pedestrian network under defined travel rules or costs.
Can a circular 500m buffer prove a five-minute walk?
No. Route geometry, crossings, speed, access and conditions matter.
Can I plot an exact historic village home from an old Punggol story map?
Not without evidence sufficient for that precision. Historical maps can be approximate and may predate later land changes.
Does a Punggol Digital District map prove every walkway is open?
No. Planned alignments and current operational access must be checked separately.
Which official source contains Punggol planning-area demographics?
SingStat publishes geographic-distribution datasets, and OneMap documents population-related API services with specific supported years.
Is a population proportion the same as an absolute count?
No. A proportion requires a denominator, and absolute numbers also depend on population size.
Can I make a step-free walking map from ordinary line geometry alone?
Not reliably. You need appropriate verified accessibility attributes and current operational conditions.
Can a student publish an online geospatial atlas?
Yes, using appropriately licensed public data, safe general locations, verified metadata and clear uncertainty labels.
Authoritative mapping sources and related Punggol learning
- Use SLA OneMap to locate a real public destination without guessing coordinates
- Distinguish WGS84 latitude-longitude from Singapore’s SVY21 grid
- Solve a scale and distance problem using the actual Punggol Waterway connector label
- Compare the topology of Punggol MRT and its two LRT loops
- Map a library visitor’s access network rather than drawing a misleading circle
- Test historical georeferencing with NLB’s Punggol Story Map
- Read Punggol Digital District’s planned footprint without assuming every path is open
- Use SingStat planning-area population data without turning polygons into personal profiles
- Evaluate a safe routing map for step-free public access
- Build an ethical geospatial atlas of ten Punggol public facts
- SLA OneMap coordinate conversions
- SLA OneMap population-query coverage and supported years
- JTC open district amenities and trail stages
- Punggol Geography field observations
- Punggol urban planning context
- Graph algorithms and careful data modelling
- Demographic inference and ethics
- eduKateSG step-by-step error repair learning model
The best map identifies both place and uncertainty
Punggol offers a compact introduction to geospatial science because public transport, waterway paths, older names, integrated services and phased new development overlap. Build a small accurate dataset before designing a large map. Check the feature geometry, coordinate reference system, source date and actual access, then repair the first mismatch. Spatial information becomes valuable when it helps a reader act correctly without exposing people or inventing precise locations.
- Map a building centroid as though it is a verified public entrance.
- Confuse WGS84 degrees with SVY21 or Web Mercator projected coordinates.
- Use extra decimal places as a substitute for locating the correct feature.
- Treat a schematic train map as a geographic scale drawing.
- Confuse 4.2km park nature walk and 8.4km park connector as one route.
- Use a straight-line buffer as proof of walking or step-free accessibility.
- Georeference an old historical map with fabricated exact control points.
- Present the whole planned Heritage Trail as open because it appears on a masterplan.
- Compare planning-area proportions without total population or time reference.
- Publish private household positions, sensitive wildlife locations or API secrets.
Frequently asked questions
What is geospatial science?
The study and use of data about location, spatial relationships, coordinates, maps and geographically distributed processes.
Is GIS the same as reading a normal map?
GIS can store and analyse structured spatial data, sources and geometry, beyond viewing a basemap.
What is OneMap?
SLA’s authoritative Singapore mapping platform with public map tools and documented APIs.
Can OneMap find Punggol addresses?
It provides search and geocoding services for supported roads, addresses and public places, subject to current data and terms.
What is a CRS?
A coordinate reference system that defines how location coordinates relate to Earth or a projected map.
What is WGS84?
A geographic reference system commonly used for latitude and longitude, represented as EPSG:4326.
What is SVY21?
Singapore’s local projected coordinate system, represented as EPSG:3414.
Why can I not interchange latitude with SVY21 X?
They use different definitions and units; valid transformation is required.
What is map scale?
The ratio between a distance shown on a map and the represented ground distance, under the map’s stated projection and conventions.
Is Punggol Waterway Park Connector 8.4km?
NParks lists the named park connector as 8.4km, while a separate nature walk is listed as 4.2km.
Is Punggol Coast MRT the same as Punggol Point LRT?
No. They are separate stations on different operating rail services.
What is graph topology?
The structure of connections among nodes, independently from exact visual distances.
What is a network service area?
The area reachable along an identified transport or pedestrian network under defined travel rules or costs.
Can a circular 500m buffer prove a five-minute walk?
No. Route geometry, crossings, speed, access and conditions matter.
Can I plot an exact historic village home from an old Punggol story map?
Not without evidence sufficient for that precision. Historical maps can be approximate and may predate later land changes.
Does a Punggol Digital District map prove every walkway is open?
No. Planned alignments and current operational access must be checked separately.
Which official source contains Punggol planning-area demographics?
SingStat publishes geographic-distribution datasets, and OneMap documents population-related API services with specific supported years.
Is a population proportion the same as an absolute count?
No. A proportion requires a denominator, and absolute numbers also depend on population size.
Can I make a step-free walking map from ordinary line geometry alone?
Not reliably. You need appropriate verified accessibility attributes and current operational conditions.
Can a student publish an online geospatial atlas?
Yes, using appropriately licensed public data, safe general locations, verified metadata and clear uncertainty labels.
Authoritative mapping sources and related Punggol learning
- Use SLA OneMap to locate a real public destination without guessing coordinates
- Distinguish WGS84 latitude-longitude from Singapore’s SVY21 grid
- Solve a scale and distance problem using the actual Punggol Waterway connector label
- Compare the topology of Punggol MRT and its two LRT loops
- Map a library visitor’s access network rather than drawing a misleading circle
- Test historical georeferencing with NLB’s Punggol Story Map
- Read Punggol Digital District’s planned footprint without assuming every path is open
- Use SingStat planning-area population data without turning polygons into personal profiles
- Evaluate a safe routing map for step-free public access
- Build an ethical geospatial atlas of ten Punggol public facts
- SLA OneMap coordinate conversions
- SLA OneMap population-query coverage and supported years
- JTC open district amenities and trail stages
- Punggol Geography field observations
- Punggol urban planning context
- Graph algorithms and careful data modelling
- Demographic inference and ethics
- eduKateSG step-by-step error repair learning model
The best map identifies both place and uncertainty
Punggol offers a compact introduction to geospatial science because public transport, waterway paths, older names, integrated services and phased new development overlap. Build a small accurate dataset before designing a large map. Check the feature geometry, coordinate reference system, source date and actual access, then repair the first mismatch. Spatial information becomes valuable when it helps a reader act correctly without exposing people or inventing precise locations.
- Location and geocoding: find a correct public address and state what the returned point means.
- Coordinate systems: distinguish degrees from projected coordinates and document the CRS.
- Map scale: convert units and identify which named route is being measured.
- Networks: model real station connections without assuming equal travel time.
- Accessibility: compare a circular radius with usable walking routes.
- Historical geography: align maps without assigning false modern coordinates to old settlements.
- Urban planning: distinguish a boundary or proposed link from open pedestrian infrastructure.
- Population mapping: preserve time, denominator and area boundaries.
- Cartographic ethics: omit private or sensitive locations and display uncertainty clearly.
The first geospatial question is what geometry represents the thing
A regional library may be shown as a public building point, a footprint polygon or an entrance location. A park connector is a path line rather than one dot. A planning area is an administrative polygon, not a specific household. Each representation supports different questions. A map can be technically valid while answering the wrong problem if it uses a building centroid to promise a wheelchair entrance or a straight-line distance to estimate walking time.
Coordinate metadata matters equally. OneMap documents WGS84 geographic coordinates and Singapore’s SVY21 projected system; confusing their numeric fields can put a point far from the intended location or create invalid positions. Even properly converted coordinates can be uncertain if the underlying input was only a guessed pin. Precision on screen does not establish accuracy on the ground. Students must record the CRS and the feature represented.
Finally, time is part of geography. LTA station services, park gate rules, construction phases and population distributions change. The effective opening of a path is not deduced from a masterplan alone, and a 2020 demographic API table is not automatically current for 2026. A trustworthy geospatial analysis records data currency, source and the status of unverified links.
Ten Punggol geospatial mapping exercises
1. Use SLA OneMap to locate a real public destination without guessing coordinates
Where: One Punggol at 1 Punggol Drive, using OneMap’s authoritative Singapore base map.
The mapping problem
OneMap is Singapore’s authoritative national map produced by SLA, with search and reverse-geocoding services covering local places and addresses. A geospatial student should begin by distinguishing a human-readable address, an officially named building and a coordinate pair. These are related but not identical forms of location information. When an online article calls a place ‘near Punggol MRT’, it has not supplied a precise official coordinate or demonstrated which pedestrian entrance is best. Searching the full verified One Punggol address provides a dependable starting record for map work.
Safe mapping procedure
Open OneMap’s public map or its documented search service and locate 1 Punggol Drive. Record the exact address string returned and the place type, using the name supplied by the source rather than an invented shortened label. Note whether the selected point represents a building, address centroid or entry location; these may differ. Make a screenshot only in accordance with map reuse terms, or draw an original diagram. Create a separate route question such as how a visitor would travel from Punggol MRT, then use routing information rather than a straight line to answer it.
Original worked example
A student uses a map’s display centre to create a latitude and longitude for the library entrance, claiming it is accurate to six decimal places. The point might be the building centre rather than the entrance. The correction records that it is a mapped building location with uncertain doorway precision and consults the venue’s directions for the actual visitor approach. Giving more decimal places does not make an unverified point correct.
A more demanding GIS question
Compare ordinary search with reverse geocoding using a documented public sample point. Ask what happens if two addresses share a large complex or an entrance lies on a different road. Discuss why geocoding results need verification and why a ‘best match’ algorithm can still return the wrong Punggol venue when the name is ambiguous.
Access, accuracy and privacy limits
Do not publish private family addresses or identify the homes of residents. OneMap API use may require account registration and tokens; follow official terms and avoid putting tokens into public WordPress source code.
Official mapping source: Use SLA OneMap to locate a real public destination without guessing coordinates. Check the dataset’s supported dates and licensing.
2. Distinguish WGS84 latitude-longitude from Singapore’s SVY21 grid
Where: A desktop OneMap coordinate-conversion lesson using fictional or OneMap’s own example coordinates.
The mapping problem
OneMap documents coordinate conversions among WGS84 EPSG:4326, SVY21 EPSG:3414 and Web Mercator EPSG:3857. These systems express location in different coordinate spaces. WGS84 provides angular latitude and longitude while Singapore’s SVY21 projected grid expresses easting and northing in a local system. A numeric pair without its coordinate reference system (CRS) can be misplotted or interpreted as an ordinary street distance. Coordinate literacy comes before placing pins on a map.
Safe mapping procedure
Read OneMap’s coordinate-converter page and write a table with the CRS name, EPSG identifier, type of coordinates and broad purpose. Use a documented example supplied by OneMap or a fully fictional point, clearly labelled, rather than a private location. Convert it using the official tool when properly authorised, and check both input order and output labels. For a paper test, compare why a latitude of approximately one degree north does not mean one metre north. Record output precision and note that projection transformations involve definitions and possible rounding.
Original worked example
A developer takes a sample pair labelled X=30,000 and Y=40,000 in SVY21 and pastes it into an application expecting WGS84 latitude and longitude. The point is invalid or misleading because the units and ranges differ. The correction identifies the source CRS and applies the documented transformation before mapping. It avoids treating X and longitude as the same field simply because both are horizontal coordinates.
A more demanding GIS question
Discuss Web Mercator’s visual convenience for online map tiles and its distortions, particularly toward high latitudes. Explain why projected units can be appropriate for local calculations when used correctly, while straight-line distances on an unverified pixel image cannot simply be read as actual walking travel. A good GIS file always documents the original CRS.
Access, accuracy and privacy limits
The OneMap conversion API may require a valid authentication token and has rate limits. Do not publish a token, invent successful transformations or claim a coordinate pair has been surveyed when it came from a simple web map.
Official mapping source: Distinguish WGS84 latitude-longitude from Singapore’s SVY21 grid. Check the dataset’s supported dates and licensing.
3. Solve a scale and distance problem using the actual Punggol Waterway connector label
Where: NParks Punggol Waterway Park and named Punggol Waterway Park Connector.
The mapping problem
NParks describes a 4.2-kilometre Waterway Park nature walk and separately an 8.4-kilometre Punggol Waterway Park Connector. Two nearby geographic features can share words in their titles while having different route extents. A correct geospatial analysis must identify which polyline the number applies to before calculating anything. It also distinguishes geographic distance, traced path length and actual travelled distance when a path is diverted or a visitor takes a side route.
Safe mapping procedure
Read the official pages for both named routes and create a small metadata table with name, source, published length and relevant map description. Convert 4.2km to 4,200m and 8.4km to 8,400m; do not assume their exact geometries or travel overlap from the numerical ratio. On paper draw a hypothetical 1:10,000 route map, where one centimetre represents one hundred metres, then calculate the length represented by a three-centimetre line. Label the paper map illustrative, not a downloaded survey of Punggol.
Original worked example
At 1:10,000 scale, three centimetres on the fictional drawing represent thirty thousand centimetres in the modelled ground, or three hundred metres. A learner first reports thirty kilometres because they multiply without reconciling units. Another learner divides 8.4 by 4.2 and says the connector is exactly two loops of the nature walk. The ratio is two, but the geographic route relationship has not been established. Both errors need different corrections.
A more demanding GIS question
Discuss why a path drawn as several straight segments can underestimate a winding actual route and why GPS traces can contain noise near buildings. Propose a method to compare the official named polyline with a GPS record if the owner had permission and appropriate data, without recording other walkers’ movements.
Access, accuracy and privacy limits
No activity requires the full walk. Do not place measuring tapes or tripods on shared paths, enter water or claim an official map’s dimensions are a current accessibility guarantee on every spur.
Official mapping source: Solve a scale and distance problem using the actual Punggol Waterway connector label. Check the dataset’s supported dates and licensing.
4. Compare the topology of Punggol MRT and its two LRT loops
Where: LTA’s current rail map, Punggol MRT NE17 and Punggol Coast MRT NE18.
The mapping problem
Topological questions concern what is connected to what, not the shape or visual size of a line. Punggol MRT is an interchange with East and West LRT loops, and LTA opened Punggol Coast MRT as the newer North East Line terminal in December 2024. A rail schematic simplifies geographic spacing to make connectivity easier to read. A student can use it to build a network graph while recognising that it is not a real-distance engineering survey or a source of exact train intervals.
Safe mapping procedure
Copy the correctly named operating stops from LTA’s current map and build a small graph with Punggol as a transfer node. Label different services and where a journey requires transferring. Write separate graph edge meanings: adjacency only, fictional equal cost or a documented real travel attribute. Never assign a cost without saying what it measures. Add a test where a user confuses Punggol Point LRT with Punggol Coast MRT and show the correct two different nodes.
Original worked example
A student places Punggol Point and Punggol Coast on one node because both contain the word ‘Punggol’. The resulting path appears to offer a direct transfer that does not exist. The correction assigns their proper LRT and MRT station identities and verifies the operating connection separately. Another error is claiming equal paper distances imply equal train travel time; a schematic is designed primarily for readability.
A more demanding GIS question
Build two small route models: one for fewest transfers and one with hypothetical travel-time weights. Discuss which is useful for a traveller with a stroller or limited stamina. Accessibility requires actual lift and pedestrian conditions, so an algorithm without current information should display uncertainty rather than promise a safe route.
Access, accuracy and privacy limits
Do not copy a 2028 rail masterplan as if every new connection is already operating. Follow current LTA passenger rules and keep algorithms purely educational; they are not real-time journey predictions.
Official mapping source: Compare the topology of Punggol MRT and its two LRT loops. Check the dataset’s supported dates and licensing.
5. Map a library visitor’s access network rather than drawing a misleading circle
Where: Punggol Regional Library at One Punggol and public pedestrian connections.
The mapping problem
GIS analysis often uses a circular buffer around a point to represent proximity, but people travel along paths, crossings, lifts and bridges. A circular half-kilometre buffer is not the same as a five-hundred-metre network service area. This difference matters around an interchange and a waterway, where a destination may appear close across water but require a longer walking route. A geospatial student should choose the representation that matches the decision and identify limitations when accessible paths are not verified.
Safe mapping procedure
Select One Punggol as a clearly named public destination. On an illustrative grid draw a five-hundred-metre radius circle and overlay a small hypothetical walking network containing one waterway and bridge. Count which model points are within the circle but not within five hundred metres of travel along the network. Then consult OneMap’s routing documentation for how actual walking routes might be obtained with proper authorised access. Do not invent a live travel-time metric for a particular resident.
Original worked example
An illustrative student map shows a point four hundred metres away in a straight line but seven hundred metres by a permitted path over a bridge. The circle includes the point; the walking-distance service area does not. Both calculations are internally correct but answer different questions. The correction is choosing the network representation for a visitor-access question and explaining that the data are synthetic.
A more demanding GIS question
Consider that a wheelchair-usable network may require different route attributes, including lifts, slopes or temporary closures, which ordinary map geometry may not provide. Define a rule for unknown accessibility information rather than treating every footpath edge as guaranteed usable. Ask what data would be needed for an evidence-led community access study.
Access, accuracy and privacy limits
Do not use a geospatial buffer to claim a person’s household is within a guaranteed journey time or eligibility catchment. Service access, walkability and legal boundaries require the appropriate official data and conditions.
Official mapping source: Map a library visitor’s access network rather than drawing a misleading circle. Check the dataset’s supported dates and licensing.
6. Test historical georeferencing with NLB’s Punggol Story Map
Where: NLB Curiocity’s Punggol story map and present OneMap geography.
The mapping problem
NLB documents that the historical place name Punggol included areas now associated with parts of Sengkang and Hougang. The story map uses SLA OneMap as its present-day base and draws on historical references, but explicitly says it is not comprehensive for every Punggol building. A historical map is a product of its time, scale and survey purpose. Georeferencing it against a modern map requires control points and careful uncertainty, not simply stretching an image until its road names look familiar.
Safe mapping procedure
Read the story map’s source notes and sketch a two-layer diagram: broad historical place naming and current map boundaries. Identify which features might be stable reference points and which may have changed through reclamation or road realignment. Write a georeferencing proposal listing three candidate control features and reasons each may be unreliable. Do not publish invented precise coordinates for former homes or say that an old village occupies a specific modern block without archival evidence.
Original worked example
A student overlays a crop of a historical Punggol map onto a new development and marks an old house at the entrance of a currently open shop. The old map’s scale and changed landscape do not justify that accuracy. The revised drawing shades an approximate historic context and attaches the archival date and uncertainty. This prevents a classroom GIS output from making a false historical claim.
A more demanding GIS question
Introduce root mean square error qualitatively as a way to assess fit against chosen control points, without inventing an exact calculated figure when points were never georeferenced. Discuss the risk of choosing only control points that support a desired conclusion and why the original map’s provenance must be preserved.
Access, accuracy and privacy limits
Do not use historical maps to navigate through closed construction sites, private buildings or restricted heritage areas. Respect rights in archival cartography and the source’s own stated limitations.
Official mapping source: Test historical georeferencing with NLB’s Punggol Story Map. Check the dataset’s supported dates and licensing.
7. Read Punggol Digital District’s planned footprint without assuming every path is open
Where: URA’s Punggol Digital District urban-design guidelines and JTC’s current public community map.
The mapping problem
URA’s guidelines describe the district as integrating SIT and JTC business-park developments in a transport-oriented, pedestrian-friendly setting. JTC’s current community information identifies operating amenities and the first opened stretch of the planned Heritage Trail. A planning boundary is not the same as an accessible walking route, and a completed transport station does not prove every depicted building phase is open. This is a useful geospatial source test because masterplan polygons and day-of-visit operating conditions answer different questions.
Safe mapping procedure
Read the latest URA boundary and design guidance and JTC’s current community page. Create separate legend classes for existing operating public facility, planned path, construction or unverified area, and district boundary. Mark only those statuses that an official current source supports. If a student wants to plan a walking route, use currently open entrances and paths from the site operator; do not draw a through-route on the masterplan as though the whole network is passable.
Original worked example
A student sees a roughly 1.3km planned Heritage Trail line and publishes a map encouraging visitors to walk its entire alignment. JTC’s current page identifies the first four hundred metres as open. The corrected map colours that section as documented open and leaves other stages unconfirmed. It becomes more useful to visitors without claiming the planning diagram itself was inaccurate.
A more demanding GIS question
Compare a land-use planning polygon with an actual pedestrian route network. Discuss why cadastral boundaries, access rights and physical footpaths may differ. Ask what update metadata a mobile wayfinding product would need to keep visitors from closed paths, and how the map should behave when opening status is unknown.
Access, accuracy and privacy limits
Never enter private SIT rooms, JTC business offices or worksite fences to verify a map. Treat plans, proposed links and actual opening notices as different evidence classes.
Official mapping source: Read Punggol Digital District’s planned footprint without assuming every path is open. Check the dataset’s supported dates and licensing.
8. Use SingStat planning-area population data without turning polygons into personal profiles
Where: SingStat 2026 planning-area demographic tables and OneMap Population Query documentation.
The mapping problem
SingStat releases geographic-distribution data by planning area and subzone, and OneMap documents Population Query endpoints for demographic information. Administrative boundaries are a convenient aggregation, but values for a whole polygon cannot tell us a particular resident’s age, household income or journey habits. A student mapping Punggol must record the reference year and exact boundary used. Furthermore, OneMap’s documented population-query examples may list older available years for particular endpoints; a current 2026 SingStat table is not automatically returned by every API method.
Safe mapping procedure
Choose one publicly released aggregate age statistic in SingStat’s 2026 publication and state its denominator, reference date and geography. Draw two fictional subzones with different population sizes to illustrate why identical colour shading can obscure absolute counts. Create a map legend that says whether colours represent numbers, percentages or categories. When considering OneMap’s API, read the actual documented supported years and response fields instead of silently assuming that every endpoint contains the newest table.
Original worked example
A student colours a hypothetical subzone dark because thirty per cent of its residents are below five, and then writes that it contains more children than a lighter-coloured subzone. Without total populations, that inference is invalid. The correction adds denominators and distinguishes a high share from a large number. The student also refrains from attaching one demographic percentage to a visible household or school group.
A more demanding GIS question
Compare choropleth shading by raw count against shading by proportion. Explain why raw totals can reflect area size or population scale and why rate maps answer different questions. Consider how boundary changes complicate time-series comparisons. Discuss uncertainty, suppression of sensitive small-area data and ethical aggregation choices.
Access, accuracy and privacy limits
Do not attempt to reidentify households through combinations of subzone data and other information. Use authentic dates, official sources and licensing rules. Demographic patterns are group descriptions, not personal dossiers.
Official mapping source: Use SingStat planning-area population data without turning polygons into personal profiles. Check the dataset’s supported dates and licensing.
9. Evaluate a safe routing map for step-free public access
Where: One Punggol, public transport nodes and BCA’s inclusive design principles.
The mapping problem
LTA and PA describe public transport and community-hub access, while BCA sets out Universal Design principles. A geospatial route intended for wheelchair users or visitors with prams needs more than a straight-line location. It may require data on lifts, curb crossings, surface conditions and temporary works. A network can be physically connected while unsuitable for a particular user. Building an ethical map means distinguishing confirmed information from assumed accessibility and never promising an unverified route.
Safe mapping procedure
Create a hypothetical small graph representing station, crossing, lift, hub entrance and library. Mark every link with its information status: verified, unverified or temporarily unavailable. Write a routing rule that refuses to guarantee step-free access when critical link data are missing, and instead prompts for current operator checking. Ask a peer to test the map with a fictional user who prefers rest stops or shelter. Revise labels that assume every user’s priorities are identical.
Original worked example
A route solver chooses the shortest path over a staircase because it has the smallest geometric length. For a user who requires step-free access, the path violates a stated constraint. The corrected graph removes incompatible edges from that hypothetical routing case and returns an alternative only when the necessary information is supported. If no verified path exists in the data, the honest result is ‘route not confirmed’.
A more demanding GIS question
Add a second criterion, such as fewer transfers or a nearby rest area, and discuss why accessibility is not one universal preference. Test the effect of a fictional lift outage while making clear that no real lift status has been measured. Explain why a user-facing interface should identify data currency and offer authorised updates.
Access, accuracy and privacy limits
Do not simulate a disability by using another person’s mobility aid, obstruct a lift for testing or invent current accessible-route conditions. Compliance determinations are professional matters; a student graph is an educational prototype.
Official mapping source: Evaluate a safe routing map for step-free public access. Check the dataset’s supported dates and licensing.
10. Build an ethical geospatial atlas of ten Punggol public facts
Where: A desk project using authoritative OneMap, NParks, LTA, NLB and JTC sources.
The mapping problem
A useful map atlas is a documented dataset, not just ten colourful pins. Each feature should have a verified locator, exact name, geometry type, source, last-check date, public access status and uncertainty. Punggol provides a diverse set: one integrated hub, a rail interchange, a newer terminal, a waterway path, a coastal park and a conserved structure. A student learns spatial data modelling by choosing appropriate points, lines and polygons for what the subject actually represents.
Safe mapping procedure
Select no more than ten publicly named Punggol features whose locations are supported by official sources. For each decide whether the map should represent a point, line or area. Keep exact private addresses, schoolchildren’s locations and sensitive wildlife points out of the atlas. Record sources and avoid applying one shared ‘open now’ status to every feature. Make a simple legend and ask a first-time reader to explain whether the line represents a trail, transit link, road or planning boundary. Correct any ambiguous symbol before publishing.
Original worked example
A student places a single dot labelled ‘8.4km Punggol Waterway Park Connector’ and claims the point is the whole route. A point might be useful as a locator or entrance, but the connector’s spatial extent is a line or route. The corrected atlas either uses an appropriately sourced polyline or labels the dot as a representative entrance, with the limitation clearly stated. This is a fundamental geometry-type repair.
A more demanding GIS question
Audit four error classes: ambiguous name, incorrect coordinate reference system, stale operating status and unsupported attribution. Create a version log and explain which errors could cause an inconvenient trip versus a serious safety problem. Consider map generalisation: on a small-scale printed map some detail must be omitted, but omission should not falsely turn planned routes into open ones.
Access, accuracy and privacy limits
Respect data licensing, avoid embedding OneMap credentials in public files and do not present hypothetical positions as official surveyed coordinates. Any map that names public services should be reviewed against current source and site access before distribution.
Official mapping source: Build an ethical geospatial atlas of ten Punggol public facts. Check the dataset’s supported dates and licensing.
A practical GIS data model
Create a table with a feature identifier, feature name, type, geometry, coordinate reference system, original source, as-of date, access condition and uncertainty. Keep the first version small. If a row represents Punggol Waterway Park Connector, type should indicate a route or line; if it represents One Punggol’s public address, identify whether the point is a public locator or a precise entrance. A record without a source or CRS should be treated as incomplete for a technical project.
Students can test the schema without collecting real coordinates. Use dummy geometries and compare how a routing graph fails when a nonexistent connection is inserted. Test a missing publication date, conflicting place names and an assumed open route. The error messages should identify which field needs checking, not silently fill it from guesses. A technically correct GeoJSON file can still carry false geographic claims, so content validation is essential.
Three Punggol geospatial study itineraries
A forty-five-minute OneMap desk session
Read OneMap’s main documentation, search for a genuine public destination, and identify what its location record refers to. Then study the coordinate conversion page and draw an input-output flow showing WGS84, SVY21 and Web Mercator. Use OneMap’s documented sample values rather than private home coordinates. End by explaining why a point’s CRS and object type are necessary to use it correctly.
A park-route comparison on paper
Read NParks’ descriptions of the 4.2km nature walk and 8.4km park connector. Create two independent records and a small map legend. Show an illustrative short public walking segment with a return route, and distinguish the length traced on paper from the official published route length. Do not force a long site visit or claim that both NParks distances describe the same exact polyline.
An urban change and accessibility atlas
Use URA and JTC to mark documented public amenities and planned district links. Add LTA’s Punggol Coast station as a confirmed operating rail node, and include NLB’s historical map as a separate dated interpretive layer. Test one fictional wheelchair access case using a graph whose link status may be unknown. Keep proposed features and unverified accessible paths clearly labelled instead of treating every line as ready to use.
Ten geospatial mistakes worth correcting before publication
- Map a building centroid as though it is a verified public entrance.
- Confuse WGS84 degrees with SVY21 or Web Mercator projected coordinates.
- Use extra decimal places as a substitute for locating the correct feature.
- Treat a schematic train map as a geographic scale drawing.
- Confuse 4.2km park nature walk and 8.4km park connector as one route.
- Use a straight-line buffer as proof of walking or step-free accessibility.
- Georeference an old historical map with fabricated exact control points.
- Present the whole planned Heritage Trail as open because it appears on a masterplan.
- Compare planning-area proportions without total population or time reference.
- Publish private household positions, sensitive wildlife locations or API secrets.
Frequently asked questions
What is geospatial science?
The study and use of data about location, spatial relationships, coordinates, maps and geographically distributed processes.
Is GIS the same as reading a normal map?
GIS can store and analyse structured spatial data, sources and geometry, beyond viewing a basemap.
What is OneMap?
SLA’s authoritative Singapore mapping platform with public map tools and documented APIs.
Can OneMap find Punggol addresses?
It provides search and geocoding services for supported roads, addresses and public places, subject to current data and terms.
What is a CRS?
A coordinate reference system that defines how location coordinates relate to Earth or a projected map.
What is WGS84?
A geographic reference system commonly used for latitude and longitude, represented as EPSG:4326.
What is SVY21?
Singapore’s local projected coordinate system, represented as EPSG:3414.
Why can I not interchange latitude with SVY21 X?
They use different definitions and units; valid transformation is required.
What is map scale?
The ratio between a distance shown on a map and the represented ground distance, under the map’s stated projection and conventions.
Is Punggol Waterway Park Connector 8.4km?
NParks lists the named park connector as 8.4km, while a separate nature walk is listed as 4.2km.
Is Punggol Coast MRT the same as Punggol Point LRT?
No. They are separate stations on different operating rail services.
What is graph topology?
The structure of connections among nodes, independently from exact visual distances.
What is a network service area?
The area reachable along an identified transport or pedestrian network under defined travel rules or costs.
Can a circular 500m buffer prove a five-minute walk?
No. Route geometry, crossings, speed, access and conditions matter.
Can I plot an exact historic village home from an old Punggol story map?
Not without evidence sufficient for that precision. Historical maps can be approximate and may predate later land changes.
Does a Punggol Digital District map prove every walkway is open?
No. Planned alignments and current operational access must be checked separately.
Which official source contains Punggol planning-area demographics?
SingStat publishes geographic-distribution datasets, and OneMap documents population-related API services with specific supported years.
Is a population proportion the same as an absolute count?
No. A proportion requires a denominator, and absolute numbers also depend on population size.
Can I make a step-free walking map from ordinary line geometry alone?
Not reliably. You need appropriate verified accessibility attributes and current operational conditions.
Can a student publish an online geospatial atlas?
Yes, using appropriately licensed public data, safe general locations, verified metadata and clear uncertainty labels.
Authoritative mapping sources and related Punggol learning
- Use SLA OneMap to locate a real public destination without guessing coordinates
- Distinguish WGS84 latitude-longitude from Singapore’s SVY21 grid
- Solve a scale and distance problem using the actual Punggol Waterway connector label
- Compare the topology of Punggol MRT and its two LRT loops
- Map a library visitor’s access network rather than drawing a misleading circle
- Test historical georeferencing with NLB’s Punggol Story Map
- Read Punggol Digital District’s planned footprint without assuming every path is open
- Use SingStat planning-area population data without turning polygons into personal profiles
- Evaluate a safe routing map for step-free public access
- Build an ethical geospatial atlas of ten Punggol public facts
- SLA OneMap coordinate conversions
- SLA OneMap population-query coverage and supported years
- JTC open district amenities and trail stages
- Punggol Geography field observations
- Punggol urban planning context
- Graph algorithms and careful data modelling
- Demographic inference and ethics
- eduKateSG step-by-step error repair learning model
The best map identifies both place and uncertainty
Punggol offers a compact introduction to geospatial science because public transport, waterway paths, older names, integrated services and phased new development overlap. Build a small accurate dataset before designing a large map. Check the feature geometry, coordinate reference system, source date and actual access, then repair the first mismatch. Spatial information becomes valuable when it helps a reader act correctly without exposing people or inventing precise locations.
The top 10 things to do in Punggol for Geospatial Science students are to geocode a public destination with SLA OneMap, distinguish WGS84 from SVY21 coordinates, compare official waterway route lengths, model MRT and LRT network topology, learn why a straight-line buffer is not a walking-distance service area, compare historical and present maps, distinguish planned Punggol Digital District geometry from actual access, map SingStat’s planning-area demographics responsibly, design step-free routing constraints and create an ethical ten-feature Punggol map atlas.
Start with OneMap and one known public destination. One Punggol at 1 Punggol Drive offers a verified address, public transport connections and several public services. Use SLA OneMap to look it up, then ask whether a map pin denotes a building, an entrance or a whole site. Do not invent a six-decimal-place coordinate from the centre of a screenshot. The next lesson is the difference between a point location, a route and a district boundary.
This October 2026 guide develops GIS, coordinate systems, map interpretation, routing, georeferencing and ethical spatial data use. It is not a replacement for surveying or a promise of real-time wayfinding. Source facts come from SLA, NParks, LTA, NLB, URA, JTC, SingStat and BCA. Numerical values in classroom examples are explicitly fictional unless attributed to an official route or dataset.
Choose the geospatial skill you need
- Location and geocoding: find a correct public address and state what the returned point means.
- Coordinate systems: distinguish degrees from projected coordinates and document the CRS.
- Map scale: convert units and identify which named route is being measured.
- Networks: model real station connections without assuming equal travel time.
- Accessibility: compare a circular radius with usable walking routes.
- Historical geography: align maps without assigning false modern coordinates to old settlements.
- Urban planning: distinguish a boundary or proposed link from open pedestrian infrastructure.
- Population mapping: preserve time, denominator and area boundaries.
- Cartographic ethics: omit private or sensitive locations and display uncertainty clearly.
The first geospatial question is what geometry represents the thing
A regional library may be shown as a public building point, a footprint polygon or an entrance location. A park connector is a path line rather than one dot. A planning area is an administrative polygon, not a specific household. Each representation supports different questions. A map can be technically valid while answering the wrong problem if it uses a building centroid to promise a wheelchair entrance or a straight-line distance to estimate walking time.
Coordinate metadata matters equally. OneMap documents WGS84 geographic coordinates and Singapore’s SVY21 projected system; confusing their numeric fields can put a point far from the intended location or create invalid positions. Even properly converted coordinates can be uncertain if the underlying input was only a guessed pin. Precision on screen does not establish accuracy on the ground. Students must record the CRS and the feature represented.
Finally, time is part of geography. LTA station services, park gate rules, construction phases and population distributions change. The effective opening of a path is not deduced from a masterplan alone, and a 2020 demographic API table is not automatically current for 2026. A trustworthy geospatial analysis records data currency, source and the status of unverified links.
Ten Punggol geospatial mapping exercises
1. Use SLA OneMap to locate a real public destination without guessing coordinates
Where: One Punggol at 1 Punggol Drive, using OneMap’s authoritative Singapore base map.
The mapping problem
OneMap is Singapore’s authoritative national map produced by SLA, with search and reverse-geocoding services covering local places and addresses. A geospatial student should begin by distinguishing a human-readable address, an officially named building and a coordinate pair. These are related but not identical forms of location information. When an online article calls a place ‘near Punggol MRT’, it has not supplied a precise official coordinate or demonstrated which pedestrian entrance is best. Searching the full verified One Punggol address provides a dependable starting record for map work.
Safe mapping procedure
Open OneMap’s public map or its documented search service and locate 1 Punggol Drive. Record the exact address string returned and the place type, using the name supplied by the source rather than an invented shortened label. Note whether the selected point represents a building, address centroid or entry location; these may differ. Make a screenshot only in accordance with map reuse terms, or draw an original diagram. Create a separate route question such as how a visitor would travel from Punggol MRT, then use routing information rather than a straight line to answer it.
Original worked example
A student uses a map’s display centre to create a latitude and longitude for the library entrance, claiming it is accurate to six decimal places. The point might be the building centre rather than the entrance. The correction records that it is a mapped building location with uncertain doorway precision and consults the venue’s directions for the actual visitor approach. Giving more decimal places does not make an unverified point correct.
A more demanding GIS question
Compare ordinary search with reverse geocoding using a documented public sample point. Ask what happens if two addresses share a large complex or an entrance lies on a different road. Discuss why geocoding results need verification and why a ‘best match’ algorithm can still return the wrong Punggol venue when the name is ambiguous.
Access, accuracy and privacy limits
Do not publish private family addresses or identify the homes of residents. OneMap API use may require account registration and tokens; follow official terms and avoid putting tokens into public WordPress source code.
Official mapping source: Use SLA OneMap to locate a real public destination without guessing coordinates. Check the dataset’s supported dates and licensing.
2. Distinguish WGS84 latitude-longitude from Singapore’s SVY21 grid
Where: A desktop OneMap coordinate-conversion lesson using fictional or OneMap’s own example coordinates.
The mapping problem
OneMap documents coordinate conversions among WGS84 EPSG:4326, SVY21 EPSG:3414 and Web Mercator EPSG:3857. These systems express location in different coordinate spaces. WGS84 provides angular latitude and longitude while Singapore’s SVY21 projected grid expresses easting and northing in a local system. A numeric pair without its coordinate reference system (CRS) can be misplotted or interpreted as an ordinary street distance. Coordinate literacy comes before placing pins on a map.
Safe mapping procedure
Read OneMap’s coordinate-converter page and write a table with the CRS name, EPSG identifier, type of coordinates and broad purpose. Use a documented example supplied by OneMap or a fully fictional point, clearly labelled, rather than a private location. Convert it using the official tool when properly authorised, and check both input order and output labels. For a paper test, compare why a latitude of approximately one degree north does not mean one metre north. Record output precision and note that projection transformations involve definitions and possible rounding.
Original worked example
A developer takes a sample pair labelled X=30,000 and Y=40,000 in SVY21 and pastes it into an application expecting WGS84 latitude and longitude. The point is invalid or misleading because the units and ranges differ. The correction identifies the source CRS and applies the documented transformation before mapping. It avoids treating X and longitude as the same field simply because both are horizontal coordinates.
A more demanding GIS question
Discuss Web Mercator’s visual convenience for online map tiles and its distortions, particularly toward high latitudes. Explain why projected units can be appropriate for local calculations when used correctly, while straight-line distances on an unverified pixel image cannot simply be read as actual walking travel. A good GIS file always documents the original CRS.
Access, accuracy and privacy limits
The OneMap conversion API may require a valid authentication token and has rate limits. Do not publish a token, invent successful transformations or claim a coordinate pair has been surveyed when it came from a simple web map.
Official mapping source: Distinguish WGS84 latitude-longitude from Singapore’s SVY21 grid. Check the dataset’s supported dates and licensing.
3. Solve a scale and distance problem using the actual Punggol Waterway connector label
Where: NParks Punggol Waterway Park and named Punggol Waterway Park Connector.
The mapping problem
NParks describes a 4.2-kilometre Waterway Park nature walk and separately an 8.4-kilometre Punggol Waterway Park Connector. Two nearby geographic features can share words in their titles while having different route extents. A correct geospatial analysis must identify which polyline the number applies to before calculating anything. It also distinguishes geographic distance, traced path length and actual travelled distance when a path is diverted or a visitor takes a side route.
Safe mapping procedure
Read the official pages for both named routes and create a small metadata table with name, source, published length and relevant map description. Convert 4.2km to 4,200m and 8.4km to 8,400m; do not assume their exact geometries or travel overlap from the numerical ratio. On paper draw a hypothetical 1:10,000 route map, where one centimetre represents one hundred metres, then calculate the length represented by a three-centimetre line. Label the paper map illustrative, not a downloaded survey of Punggol.
Original worked example
At 1:10,000 scale, three centimetres on the fictional drawing represent thirty thousand centimetres in the modelled ground, or three hundred metres. A learner first reports thirty kilometres because they multiply without reconciling units. Another learner divides 8.4 by 4.2 and says the connector is exactly two loops of the nature walk. The ratio is two, but the geographic route relationship has not been established. Both errors need different corrections.
A more demanding GIS question
Discuss why a path drawn as several straight segments can underestimate a winding actual route and why GPS traces can contain noise near buildings. Propose a method to compare the official named polyline with a GPS record if the owner had permission and appropriate data, without recording other walkers’ movements.
Access, accuracy and privacy limits
No activity requires the full walk. Do not place measuring tapes or tripods on shared paths, enter water or claim an official map’s dimensions are a current accessibility guarantee on every spur.
Official mapping source: Solve a scale and distance problem using the actual Punggol Waterway connector label. Check the dataset’s supported dates and licensing.
4. Compare the topology of Punggol MRT and its two LRT loops
Where: LTA’s current rail map, Punggol MRT NE17 and Punggol Coast MRT NE18.
The mapping problem
Topological questions concern what is connected to what, not the shape or visual size of a line. Punggol MRT is an interchange with East and West LRT loops, and LTA opened Punggol Coast MRT as the newer North East Line terminal in December 2024. A rail schematic simplifies geographic spacing to make connectivity easier to read. A student can use it to build a network graph while recognising that it is not a real-distance engineering survey or a source of exact train intervals.
Safe mapping procedure
Copy the correctly named operating stops from LTA’s current map and build a small graph with Punggol as a transfer node. Label different services and where a journey requires transferring. Write separate graph edge meanings: adjacency only, fictional equal cost or a documented real travel attribute. Never assign a cost without saying what it measures. Add a test where a user confuses Punggol Point LRT with Punggol Coast MRT and show the correct two different nodes.
Original worked example
A student places Punggol Point and Punggol Coast on one node because both contain the word ‘Punggol’. The resulting path appears to offer a direct transfer that does not exist. The correction assigns their proper LRT and MRT station identities and verifies the operating connection separately. Another error is claiming equal paper distances imply equal train travel time; a schematic is designed primarily for readability.
A more demanding GIS question
Build two small route models: one for fewest transfers and one with hypothetical travel-time weights. Discuss which is useful for a traveller with a stroller or limited stamina. Accessibility requires actual lift and pedestrian conditions, so an algorithm without current information should display uncertainty rather than promise a safe route.
Access, accuracy and privacy limits
Do not copy a 2028 rail masterplan as if every new connection is already operating. Follow current LTA passenger rules and keep algorithms purely educational; they are not real-time journey predictions.
Official mapping source: Compare the topology of Punggol MRT and its two LRT loops. Check the dataset’s supported dates and licensing.
5. Map a library visitor’s access network rather than drawing a misleading circle
Where: Punggol Regional Library at One Punggol and public pedestrian connections.
The mapping problem
GIS analysis often uses a circular buffer around a point to represent proximity, but people travel along paths, crossings, lifts and bridges. A circular half-kilometre buffer is not the same as a five-hundred-metre network service area. This difference matters around an interchange and a waterway, where a destination may appear close across water but require a longer walking route. A geospatial student should choose the representation that matches the decision and identify limitations when accessible paths are not verified.
Safe mapping procedure
Select One Punggol as a clearly named public destination. On an illustrative grid draw a five-hundred-metre radius circle and overlay a small hypothetical walking network containing one waterway and bridge. Count which model points are within the circle but not within five hundred metres of travel along the network. Then consult OneMap’s routing documentation for how actual walking routes might be obtained with proper authorised access. Do not invent a live travel-time metric for a particular resident.
Original worked example
An illustrative student map shows a point four hundred metres away in a straight line but seven hundred metres by a permitted path over a bridge. The circle includes the point; the walking-distance service area does not. Both calculations are internally correct but answer different questions. The correction is choosing the network representation for a visitor-access question and explaining that the data are synthetic.
A more demanding GIS question
Consider that a wheelchair-usable network may require different route attributes, including lifts, slopes or temporary closures, which ordinary map geometry may not provide. Define a rule for unknown accessibility information rather than treating every footpath edge as guaranteed usable. Ask what data would be needed for an evidence-led community access study.
Access, accuracy and privacy limits
Do not use a geospatial buffer to claim a person’s household is within a guaranteed journey time or eligibility catchment. Service access, walkability and legal boundaries require the appropriate official data and conditions.
Official mapping source: Map a library visitor’s access network rather than drawing a misleading circle. Check the dataset’s supported dates and licensing.
6. Test historical georeferencing with NLB’s Punggol Story Map
Where: NLB Curiocity’s Punggol story map and present OneMap geography.
The mapping problem
NLB documents that the historical place name Punggol included areas now associated with parts of Sengkang and Hougang. The story map uses SLA OneMap as its present-day base and draws on historical references, but explicitly says it is not comprehensive for every Punggol building. A historical map is a product of its time, scale and survey purpose. Georeferencing it against a modern map requires control points and careful uncertainty, not simply stretching an image until its road names look familiar.
Safe mapping procedure
Read the story map’s source notes and sketch a two-layer diagram: broad historical place naming and current map boundaries. Identify which features might be stable reference points and which may have changed through reclamation or road realignment. Write a georeferencing proposal listing three candidate control features and reasons each may be unreliable. Do not publish invented precise coordinates for former homes or say that an old village occupies a specific modern block without archival evidence.
Original worked example
A student overlays a crop of a historical Punggol map onto a new development and marks an old house at the entrance of a currently open shop. The old map’s scale and changed landscape do not justify that accuracy. The revised drawing shades an approximate historic context and attaches the archival date and uncertainty. This prevents a classroom GIS output from making a false historical claim.
A more demanding GIS question
Introduce root mean square error qualitatively as a way to assess fit against chosen control points, without inventing an exact calculated figure when points were never georeferenced. Discuss the risk of choosing only control points that support a desired conclusion and why the original map’s provenance must be preserved.
Access, accuracy and privacy limits
Do not use historical maps to navigate through closed construction sites, private buildings or restricted heritage areas. Respect rights in archival cartography and the source’s own stated limitations.
Official mapping source: Test historical georeferencing with NLB’s Punggol Story Map. Check the dataset’s supported dates and licensing.
7. Read Punggol Digital District’s planned footprint without assuming every path is open
Where: URA’s Punggol Digital District urban-design guidelines and JTC’s current public community map.
The mapping problem
URA’s guidelines describe the district as integrating SIT and JTC business-park developments in a transport-oriented, pedestrian-friendly setting. JTC’s current community information identifies operating amenities and the first opened stretch of the planned Heritage Trail. A planning boundary is not the same as an accessible walking route, and a completed transport station does not prove every depicted building phase is open. This is a useful geospatial source test because masterplan polygons and day-of-visit operating conditions answer different questions.
Safe mapping procedure
Read the latest URA boundary and design guidance and JTC’s current community page. Create separate legend classes for existing operating public facility, planned path, construction or unverified area, and district boundary. Mark only those statuses that an official current source supports. If a student wants to plan a walking route, use currently open entrances and paths from the site operator; do not draw a through-route on the masterplan as though the whole network is passable.
Original worked example
A student sees a roughly 1.3km planned Heritage Trail line and publishes a map encouraging visitors to walk its entire alignment. JTC’s current page identifies the first four hundred metres as open. The corrected map colours that section as documented open and leaves other stages unconfirmed. It becomes more useful to visitors without claiming the planning diagram itself was inaccurate.
A more demanding GIS question
Compare a land-use planning polygon with an actual pedestrian route network. Discuss why cadastral boundaries, access rights and physical footpaths may differ. Ask what update metadata a mobile wayfinding product would need to keep visitors from closed paths, and how the map should behave when opening status is unknown.
Access, accuracy and privacy limits
Never enter private SIT rooms, JTC business offices or worksite fences to verify a map. Treat plans, proposed links and actual opening notices as different evidence classes.
Official mapping source: Read Punggol Digital District’s planned footprint without assuming every path is open. Check the dataset’s supported dates and licensing.
8. Use SingStat planning-area population data without turning polygons into personal profiles
Where: SingStat 2026 planning-area demographic tables and OneMap Population Query documentation.
The mapping problem
SingStat releases geographic-distribution data by planning area and subzone, and OneMap documents Population Query endpoints for demographic information. Administrative boundaries are a convenient aggregation, but values for a whole polygon cannot tell us a particular resident’s age, household income or journey habits. A student mapping Punggol must record the reference year and exact boundary used. Furthermore, OneMap’s documented population-query examples may list older available years for particular endpoints; a current 2026 SingStat table is not automatically returned by every API method.
Safe mapping procedure
Choose one publicly released aggregate age statistic in SingStat’s 2026 publication and state its denominator, reference date and geography. Draw two fictional subzones with different population sizes to illustrate why identical colour shading can obscure absolute counts. Create a map legend that says whether colours represent numbers, percentages or categories. When considering OneMap’s API, read the actual documented supported years and response fields instead of silently assuming that every endpoint contains the newest table.
Original worked example
A student colours a hypothetical subzone dark because thirty per cent of its residents are below five, and then writes that it contains more children than a lighter-coloured subzone. Without total populations, that inference is invalid. The correction adds denominators and distinguishes a high share from a large number. The student also refrains from attaching one demographic percentage to a visible household or school group.
A more demanding GIS question
Compare choropleth shading by raw count against shading by proportion. Explain why raw totals can reflect area size or population scale and why rate maps answer different questions. Consider how boundary changes complicate time-series comparisons. Discuss uncertainty, suppression of sensitive small-area data and ethical aggregation choices.
Access, accuracy and privacy limits
Do not attempt to reidentify households through combinations of subzone data and other information. Use authentic dates, official sources and licensing rules. Demographic patterns are group descriptions, not personal dossiers.
Official mapping source: Use SingStat planning-area population data without turning polygons into personal profiles. Check the dataset’s supported dates and licensing.
9. Evaluate a safe routing map for step-free public access
Where: One Punggol, public transport nodes and BCA’s inclusive design principles.
The mapping problem
LTA and PA describe public transport and community-hub access, while BCA sets out Universal Design principles. A geospatial route intended for wheelchair users or visitors with prams needs more than a straight-line location. It may require data on lifts, curb crossings, surface conditions and temporary works. A network can be physically connected while unsuitable for a particular user. Building an ethical map means distinguishing confirmed information from assumed accessibility and never promising an unverified route.
Safe mapping procedure
Create a hypothetical small graph representing station, crossing, lift, hub entrance and library. Mark every link with its information status: verified, unverified or temporarily unavailable. Write a routing rule that refuses to guarantee step-free access when critical link data are missing, and instead prompts for current operator checking. Ask a peer to test the map with a fictional user who prefers rest stops or shelter. Revise labels that assume every user’s priorities are identical.
Original worked example
A route solver chooses the shortest path over a staircase because it has the smallest geometric length. For a user who requires step-free access, the path violates a stated constraint. The corrected graph removes incompatible edges from that hypothetical routing case and returns an alternative only when the necessary information is supported. If no verified path exists in the data, the honest result is ‘route not confirmed’.
A more demanding GIS question
Add a second criterion, such as fewer transfers or a nearby rest area, and discuss why accessibility is not one universal preference. Test the effect of a fictional lift outage while making clear that no real lift status has been measured. Explain why a user-facing interface should identify data currency and offer authorised updates.
Access, accuracy and privacy limits
Do not simulate a disability by using another person’s mobility aid, obstruct a lift for testing or invent current accessible-route conditions. Compliance determinations are professional matters; a student graph is an educational prototype.
Official mapping source: Evaluate a safe routing map for step-free public access. Check the dataset’s supported dates and licensing.
10. Build an ethical geospatial atlas of ten Punggol public facts
Where: A desk project using authoritative OneMap, NParks, LTA, NLB and JTC sources.
The mapping problem
A useful map atlas is a documented dataset, not just ten colourful pins. Each feature should have a verified locator, exact name, geometry type, source, last-check date, public access status and uncertainty. Punggol provides a diverse set: one integrated hub, a rail interchange, a newer terminal, a waterway path, a coastal park and a conserved structure. A student learns spatial data modelling by choosing appropriate points, lines and polygons for what the subject actually represents.
Safe mapping procedure
Select no more than ten publicly named Punggol features whose locations are supported by official sources. For each decide whether the map should represent a point, line or area. Keep exact private addresses, schoolchildren’s locations and sensitive wildlife points out of the atlas. Record sources and avoid applying one shared ‘open now’ status to every feature. Make a simple legend and ask a first-time reader to explain whether the line represents a trail, transit link, road or planning boundary. Correct any ambiguous symbol before publishing.
Original worked example
A student places a single dot labelled ‘8.4km Punggol Waterway Park Connector’ and claims the point is the whole route. A point might be useful as a locator or entrance, but the connector’s spatial extent is a line or route. The corrected atlas either uses an appropriately sourced polyline or labels the dot as a representative entrance, with the limitation clearly stated. This is a fundamental geometry-type repair.
A more demanding GIS question
Audit four error classes: ambiguous name, incorrect coordinate reference system, stale operating status and unsupported attribution. Create a version log and explain which errors could cause an inconvenient trip versus a serious safety problem. Consider map generalisation: on a small-scale printed map some detail must be omitted, but omission should not falsely turn planned routes into open ones.
Access, accuracy and privacy limits
Respect data licensing, avoid embedding OneMap credentials in public files and do not present hypothetical positions as official surveyed coordinates. Any map that names public services should be reviewed against current source and site access before distribution.
Official mapping source: Build an ethical geospatial atlas of ten Punggol public facts. Check the dataset’s supported dates and licensing.
A practical GIS data model
Create a table with a feature identifier, feature name, type, geometry, coordinate reference system, original source, as-of date, access condition and uncertainty. Keep the first version small. If a row represents Punggol Waterway Park Connector, type should indicate a route or line; if it represents One Punggol’s public address, identify whether the point is a public locator or a precise entrance. A record without a source or CRS should be treated as incomplete for a technical project.
Students can test the schema without collecting real coordinates. Use dummy geometries and compare how a routing graph fails when a nonexistent connection is inserted. Test a missing publication date, conflicting place names and an assumed open route. The error messages should identify which field needs checking, not silently fill it from guesses. A technically correct GeoJSON file can still carry false geographic claims, so content validation is essential.
Three Punggol geospatial study itineraries
A forty-five-minute OneMap desk session
Read OneMap’s main documentation, search for a genuine public destination, and identify what its location record refers to. Then study the coordinate conversion page and draw an input-output flow showing WGS84, SVY21 and Web Mercator. Use OneMap’s documented sample values rather than private home coordinates. End by explaining why a point’s CRS and object type are necessary to use it correctly.
A park-route comparison on paper
Read NParks’ descriptions of the 4.2km nature walk and 8.4km park connector. Create two independent records and a small map legend. Show an illustrative short public walking segment with a return route, and distinguish the length traced on paper from the official published route length. Do not force a long site visit or claim that both NParks distances describe the same exact polyline.
An urban change and accessibility atlas
Use URA and JTC to mark documented public amenities and planned district links. Add LTA’s Punggol Coast station as a confirmed operating rail node, and include NLB’s historical map as a separate dated interpretive layer. Test one fictional wheelchair access case using a graph whose link status may be unknown. Keep proposed features and unverified accessible paths clearly labelled instead of treating every line as ready to use.
Ten geospatial mistakes worth correcting before publication
- Map a building centroid as though it is a verified public entrance.
- Confuse WGS84 degrees with SVY21 or Web Mercator projected coordinates.
- Use extra decimal places as a substitute for locating the correct feature.
- Treat a schematic train map as a geographic scale drawing.
- Confuse 4.2km park nature walk and 8.4km park connector as one route.
- Use a straight-line buffer as proof of walking or step-free accessibility.
- Georeference an old historical map with fabricated exact control points.
- Present the whole planned Heritage Trail as open because it appears on a masterplan.
- Compare planning-area proportions without total population or time reference.
- Publish private household positions, sensitive wildlife locations or API secrets.
Frequently asked questions
What is geospatial science?
The study and use of data about location, spatial relationships, coordinates, maps and geographically distributed processes.
Is GIS the same as reading a normal map?
GIS can store and analyse structured spatial data, sources and geometry, beyond viewing a basemap.
What is OneMap?
SLA’s authoritative Singapore mapping platform with public map tools and documented APIs.
Can OneMap find Punggol addresses?
It provides search and geocoding services for supported roads, addresses and public places, subject to current data and terms.
What is a CRS?
A coordinate reference system that defines how location coordinates relate to Earth or a projected map.
What is WGS84?
A geographic reference system commonly used for latitude and longitude, represented as EPSG:4326.
What is SVY21?
Singapore’s local projected coordinate system, represented as EPSG:3414.
Why can I not interchange latitude with SVY21 X?
They use different definitions and units; valid transformation is required.
What is map scale?
The ratio between a distance shown on a map and the represented ground distance, under the map’s stated projection and conventions.
Is Punggol Waterway Park Connector 8.4km?
NParks lists the named park connector as 8.4km, while a separate nature walk is listed as 4.2km.
Is Punggol Coast MRT the same as Punggol Point LRT?
No. They are separate stations on different operating rail services.
What is graph topology?
The structure of connections among nodes, independently from exact visual distances.
What is a network service area?
The area reachable along an identified transport or pedestrian network under defined travel rules or costs.
Can a circular 500m buffer prove a five-minute walk?
No. Route geometry, crossings, speed, access and conditions matter.
Can I plot an exact historic village home from an old Punggol story map?
Not without evidence sufficient for that precision. Historical maps can be approximate and may predate later land changes.
Does a Punggol Digital District map prove every walkway is open?
No. Planned alignments and current operational access must be checked separately.
Which official source contains Punggol planning-area demographics?
SingStat publishes geographic-distribution datasets, and OneMap documents population-related API services with specific supported years.
Is a population proportion the same as an absolute count?
No. A proportion requires a denominator, and absolute numbers also depend on population size.
Can I make a step-free walking map from ordinary line geometry alone?
Not reliably. You need appropriate verified accessibility attributes and current operational conditions.
Can a student publish an online geospatial atlas?
Yes, using appropriately licensed public data, safe general locations, verified metadata and clear uncertainty labels.
Authoritative mapping sources and related Punggol learning
- Use SLA OneMap to locate a real public destination without guessing coordinates
- Distinguish WGS84 latitude-longitude from Singapore’s SVY21 grid
- Solve a scale and distance problem using the actual Punggol Waterway connector label
- Compare the topology of Punggol MRT and its two LRT loops
- Map a library visitor’s access network rather than drawing a misleading circle
- Test historical georeferencing with NLB’s Punggol Story Map
- Read Punggol Digital District’s planned footprint without assuming every path is open
- Use SingStat planning-area population data without turning polygons into personal profiles
- Evaluate a safe routing map for step-free public access
- Build an ethical geospatial atlas of ten Punggol public facts
- SLA OneMap coordinate conversions
- SLA OneMap population-query coverage and supported years
- JTC open district amenities and trail stages
- Punggol Geography field observations
- Punggol urban planning context
- Graph algorithms and careful data modelling
- Demographic inference and ethics
- eduKateSG step-by-step error repair learning model
The best map identifies both place and uncertainty
Punggol offers a compact introduction to geospatial science because public transport, waterway paths, older names, integrated services and phased new development overlap. Build a small accurate dataset before designing a large map. Check the feature geometry, coordinate reference system, source date and actual access, then repair the first mismatch. Spatial information becomes valuable when it helps a reader act correctly without exposing people or inventing precise locations.


