
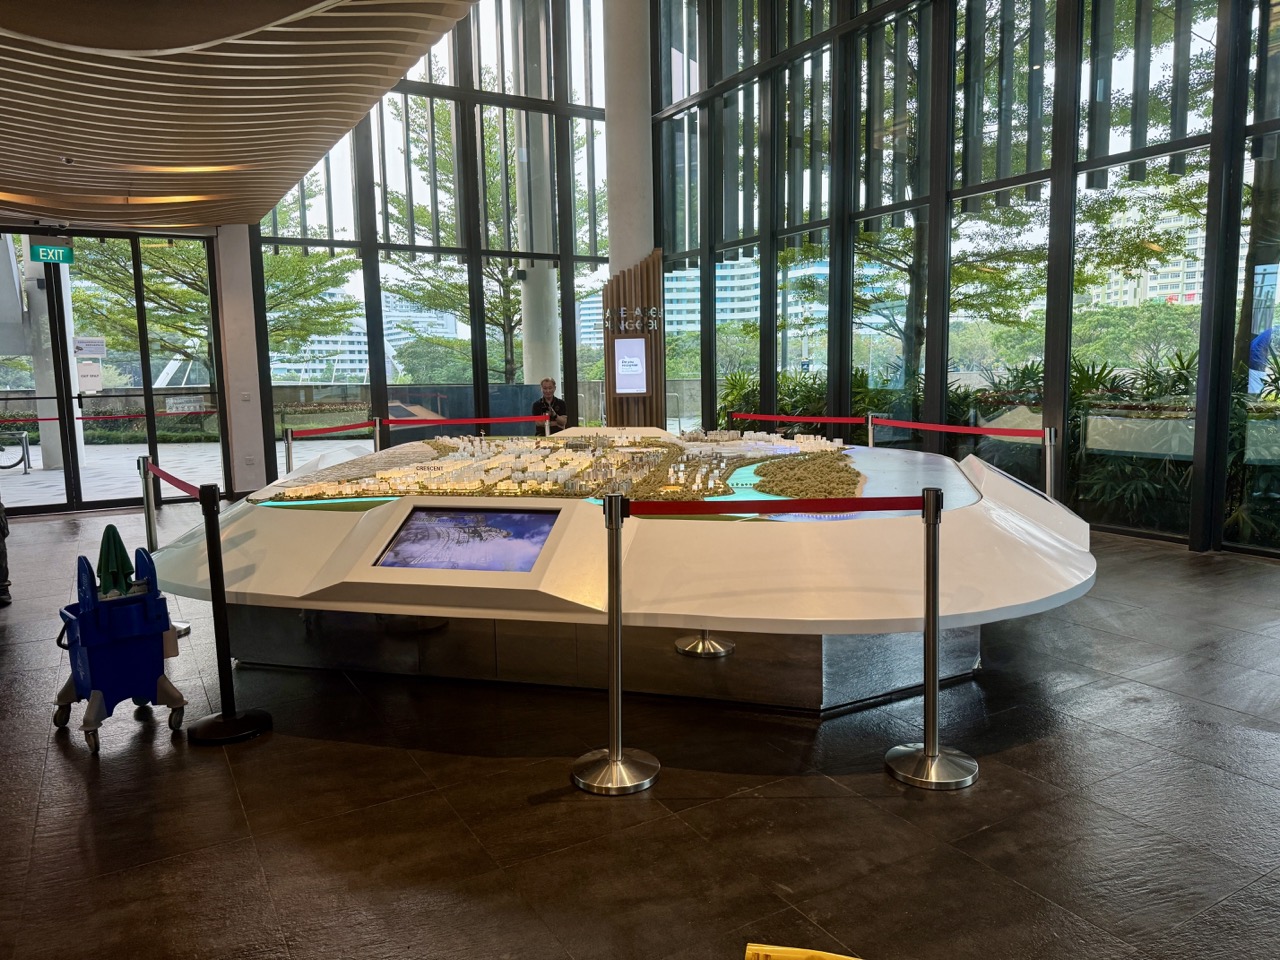
A scale model makes a large place small without making its mathematical relationships arbitrary. The Punggol Discovery Cube’s miniature town model, shown in eduKatePunggol’s new October 2026 photographs, is a useful starting point for ratio, scale factors, units, perimeter, area and three-dimensional thinking. The key rule is simple: if a model is uniformly built at scale 1:n, one unit on the model represents n of the same units in reality. But you must know the model’s real stated scale before calculating any actual distance.
Important: the scale of the photographed Punggol Discovery Cube model has not been independently verified in this guide. Every numerical scale below—such as 1:500 or 1:1,000—is an explicitly fictional worked example. We are using Punggol’s genuine town-model photographs to teach correct Mathematics, not manufacturing a survey map or claiming a particular road is exactly so many metres long. The Cube opened with Punggol Town Square on 15 January 2017, according to the Prime Minister’s Office’s official opening speech.

Scale models: quick answers
- Scale 1:1,000: 1 cm on the model means 1,000 cm in reality, or 10 m. This is an example scale, not the verified Cube scale.
- Length factor: multiplying or dividing lengths requires careful unit conversion.
- Area factor: a length factor of n corresponds to an area factor of n², assuming a uniformly scaled two-dimensional surface.
- Volume factor: a length factor of n corresponds to a volume factor of n³ for similar three-dimensional solids.
- Photographic warning: perspective and camera angle prevent reliable physical measurements from uncalibrated pictures.
- Town-planning warning: a model may show a proposed development rather than a completed public facility.
- Practice target: explain the method, show units, check the answer and recognise when the information is insufficient.
A tiny town can represent a much larger town
When children first look at a miniature town, they notice the small buildings and roads. Mathematics begins when we ask whether the relative sizes are being reduced consistently. A scale model uses a relationship between represented dimensions and real dimensions. A ratio such as 1:1,000 indicates uniform reduction of lengths by the same factor. It is not simply a statement that the object is ‘a thousand times smaller’ in every sense.
This distinction matters because lengths, areas and volumes behave differently. A long road becomes a short model strip, a real football court becomes a tiny rectangle and a building becomes a small solid. We need different operations for each kind of quantity. The model photograph starts the curiosity, but the calculation begins only after the relevant scale and measurements are known.
Why the actual displayed scale matters
Suppose a child points to a tiny bridge and says it looks five centimetres long. That impression cannot be turned into a real-world distance without the model’s stated scale. The camera could also have introduced perspective distortion, and the photographed object might be a proposed design. Guessing a denominator such as 500 or 1,000 because it gives a pleasing answer would be mathematically indefensible.
A careful learner would ask for the scale legend on the actual display, confirm that the model is uniform and measure the appropriate straight-line dimension from a suitable position if permitted. If that information is unavailable, the correct conclusion is ‘not enough data’. Mathematics sometimes rewards restraint more than calculation. This article uses invented scales precisely to preserve that distinction.
Write the scale as a relationship before touching a calculator
The ratio 1:1,000 means model length : actual length = 1:1,000 when both lengths use the same unit. One model centimetre represents 1,000 real centimetres. Converting 1,000 cm to metres gives 10 m. Two model centimetres represent 20 m, and ten model centimetres represent 100 m. The arithmetic is multiplication by 1,000 followed by conversion of units.
Students often remember the multiplication but forget the units. Write ‘2 cm × 1,000 = 2,000 cm = 20 m’ rather than ‘2 × 1,000 = 2,000’ with no explanation. The first line can be checked against reality. The second is an unexplained number. At every level, good working connects the unit and mathematical operation to the original question.
Converting centimetres, metres and kilometres correctly
The important facts are 100 centimetres = 1 metre and 1,000 metres = 1 kilometre. Therefore 100,000 centimetres = 1 kilometre. On a hypothetical 1:1,000 model, a represented 15 cm corresponds to 15,000 cm, which equals 150 m, or 0.15 km. The same result should be obtained whether conversion occurs before or after the scale multiplication.
If a student obtains 15 km from a 15 cm strip on that hypothetical model, the result is too large by a factor of 100. Checking the units can expose the mistake before any teacher does. A rough plausibility check—would that tiny feature really represent a distance across an entire region?—is useful but must follow the actual scale, not replace it.
Primary worked example: find an actual modelled path length
Assume a fictional display uses scale 1:500. A straight miniature path measures 8 cm. The represented real path length is 8 × 500 = 4,000 cm. Divide by 100 to convert centimetres to metres: 40 m. The answer is 40 metres in this invented scale problem. Nothing in the photograph establishes a particular Punggol path as 40 metres.
The operation is simple, but the wording matters. We are calculating a length represented by a model, not a verified journey time or public pedestrian route. A scaled straight line might omit real turns, detours or access restrictions. Even if the scale were known, a useful traveller would still check the real route and actual crossings.
Primary worked example: find the model length from a real distance
Now reverse the direction. Suppose an imagined walkway is 120 metres long, and the model scale is 1:1,000. Convert 120 metres to 12,000 centimetres. Then divide by 1,000: 12 cm on the model. This is the inverse of the earlier operation. In a proportional relationship, multiplying and dividing need to be chosen according to what is known and what is being found.
One of the most common errors is multiplying 120 by 1,000 without first thinking about the direction. A quick question repairs the thinking: ‘Should the representation be shorter than the real walkway?’ Yes, because the model is a reduction. Twelve centimetres is plausible within the invented scenario; 120,000 metres of model length is not.
Primary worked example: compare two features
At the same fictional scale, one modelled path measures 9 cm and another 6 cm. Because both are represented using the same scale, the lengths have ratio 9:6, which simplifies to 3:2. Their real straight-line lengths would share that ratio. The scale factor cancels when both lengths are multiplied by the same number.
This can be solved without knowing the exact real distances. But it depends on the features being measured consistently and at the same scale. If one number was measured from an angled photograph and another directly on the model, distortion could invalidate the ratio. A careful student knows when a ratio is reliable and when the measurement method changes the result.
Primary worked example: difference in represented lengths
Suppose two fictional paths at scale 1:500 measure 14 cm and 9 cm on the model. Their model-length difference is 5 cm. Multiply by 500 to obtain 2,500 cm, or 25 metres. We could also calculate the represented real lengths separately—70 m and 45 m—and subtract to obtain the same 25 m. These two methods agree because scaling is linear for length.
Checking with a second method is a useful habit. It can catch arithmetic mistakes before the child moves on to a harder problem. But do not turn the simple subtraction into a claim that two real Punggol routes differ by 25 metres. The numbers belong to the exercise, not to the photograph’s geography.
Primary worked example: perimeter of a rectangle
An imagined rectangular court on a uniform 1:200 scale model measures 12 cm by 7 cm. The model perimeter is 2(12 + 7) = 38 cm. The corresponding real dimensions are 24 m and 14 m, giving a real perimeter of 2(24 + 14) = 76 m. Alternatively, multiply 38 cm by 200 to get 7,600 cm, or 76 m.
Perimeter is a length measurement around an edge, so its scale factor behaves like other lengths. This is a useful precursor to area, where the same multiplication would be wrong. Encourage the child to sketch the rectangle, write what every side represents and specify the final unit. A neat picture does not replace the reasoning.
The first big trap: area is not scaled like length
Imagine doubling both the width and length of a square. Each side is twice as long, but the area becomes four times as large. The number of square units increases in two directions. This is why a scale factor of 1:500 for length produces an area factor of 1:250,000, because 500 × 500 = 250,000.
A student who multiplies an area by only 500 has applied a one-dimensional rule to a two-dimensional quantity. Repair the mistake by drawing a 1 × 1 square and a 2 × 2 square. Count the smaller squares in the larger one: four, not two. This first-principles picture makes n² feel natural rather than an arbitrary formula to memorise.
Secondary worked example: model court area
Use an invented scale 1:200. A rectangular model feature measures 12 cm by 7 cm. Its model area is 84 cm². The corresponding real lengths are 24 m and 14 m. The real area is 24 × 14 = 336 m². We can independently verify by multiplying 84 cm² by 200² = 40,000, giving 3,360,000 cm², or 336 m².
Both methods agree because the scale was applied consistently. The conversion from square centimetres to square metres is 10,000, not 100: one square metre contains 100 × 100 square centimetres. That unit conversion is as important as the similarity theorem. Again, these are fictional dimensions, not the measured area of an actual Punggol recreation facility.
Why square units behave differently from ordinary units
One metre equals 100 centimetres, but one square metre equals 10,000 square centimetres. The word ‘square’ means we are measuring two dimensions. If a pupil converts 3,360,000 cm² to m² by dividing by 100, the answer is inflated one hundredfold. This is a structural error rather than a slip in arithmetic.
A useful repair is to sketch a square measuring 100 cm on each side. Its area is 100 × 100 = 10,000 cm². That same square measures 1 m by 1 m, or 1 m². Repeat the picture before moving to abstract conversion rules. Once the child sees the geometry, the 10,000 denominator is much harder to forget.
Secondary worked example: a triangular space
Suppose a fictional triangular park representation uses scale 1:250. The miniature triangle has a base of 10 cm and perpendicular height of 8 cm. Its model area is ½ × 10 × 8 = 40 cm². The represented real base is 25 m and real perpendicular height 20 m, so the actual triangle’s area under this model is ½ × 25 × 20 = 250 m².
The word ‘perpendicular’ matters. A sloping side of a triangle cannot automatically be substituted for the height. In a photograph of a town model, perspective can make a line appear perpendicular when it is not. If accurate dimensions or a right angle have not been established, do not force a numerical answer. Correct geometry starts with the conditions of the formula.
Volume introduces a third dimension
A building model is not only a drawing of width and length; it also has height. If every dimension is enlarged by a factor of n, the volume is enlarged by n³. Doubling a cube’s side makes its volume eight times greater, because 2 × 2 × 2 = 8. This is a stronger change than for perimeter or area.
Students can build the concept with unit cubes. One unit cube has volume 1 cubic unit. A 2-by-2-by-2 cube contains eight. A 3-by-3-by-3 cube contains twenty-seven. The rule follows from counting three-dimensional blocks; it is not a mysterious extra power added for advanced Mathematics.
Secondary worked example: a miniature building
Imagine a rectangular building model at 1:100 scale, with model length 12 cm, width 8 cm and height 6 cm. The represented actual dimensions would be 12 m, 8 m and 6 m, respectively. The model volume is 12 × 8 × 6 = 576 cm³. The actual volume of the corresponding rectangular prism is 12 × 8 × 6 = 576 m³.
The numerical coincidence is created by choosing 1:100 and converting centimetres to metres; it does not mean the units are interchangeable. A second check multiplies 576 cm³ by 100³ = 1,000,000, giving 576,000,000 cm³. Divide by 1,000,000 to convert cubic centimetres to cubic metres: 576 m³. This is a hypothetical solid, not a dimension claim about the Cube’s real buildings.
Similarity versus exact architectural accuracy
A mathematical model may be geometrically similar to the object it represents, but a public planning model may simplify small details, textures or landscaping. Some displays use stylised vegetation or emphasise particular features. Even if a legend gives a general scale, it is worth asking whether every decorative feature was built with exact proportional fidelity.
Do not take the height of a model tree and calculate the height of a real tree without verifying that the model uses accurate scaling for trees. The same applies to exaggerated street widths used for visibility or structures included as proposals. Mathematics is precise about its assumptions; the physical display may have design purposes beyond survey accuracy.
A model’s date is another form of missing data
The Discovery Cube opened in 2017, but a photograph uploaded in 2026 does not prove the miniature town was updated in 2026. A display can preserve earlier plans or remain unchanged after developments on the ground. The model can still be valuable for understanding a planning idea while requiring a separate current check for whether a depicted feature exists.
Distinguish at least three dates: the original opening date of the visitor centre, the creation or revision date of the particular model, and the photograph’s capture or upload date. They answer different historical questions. A student who treats them as interchangeable could make incorrect claims about new roads, facilities or community spaces.
Why a photo cannot be used as a ruler
Our two images of the miniature town were taken from a camera viewpoint. Objects nearer the lens appear larger on the image plane, while farther objects appear smaller. Perspective makes the conversion from image pixels to actual centimetres dependent on camera position, focal properties and surface orientation. Without calibration, one pixel does not consistently represent one real-model millimetre.
A student might be tempted to measure a bridge in pixels and infer its actual length from another pictured object. Unless the reference and target lie in the correct geometric relationship and the camera is calibrated, that calculation can be wrong even with perfect division. Photographs support visual interpretation. They are not automatically orthographic engineering drawings.
How camera tilt changes the apparent rectangle
Imagine a rectangular board viewed directly from above: its edges can be compared reasonably if the lens and surface are appropriate. Tilt the camera and the far edge appears shorter; a rectangle may look like a trapezium. The physical board did not change. The camera introduced a perspective projection that altered its appearance.
This is why two photographs of the same Punggol model may create different impressions of distances. The images are useful as complementary views, not as a calibrated measurement pair. For accurate scale work, use a verified plan, the exhibit’s own measurements or properly calibrated images. Children can observe the distortion by photographing a notebook flat on a table at different angles.
Worked example: estimate and then verify
Suppose a student has a hypothetical model at 1:500 and measures a feature as approximately 7.2 cm with a ruler, accurate to the nearest millimetre. The represented length would be about 36 m. But if the measurement itself might be off by 0.1 cm, that corresponds to about 0.5 m under the model scale. Report ‘approximately 36 m’ rather than pretending certainty to the nearest millimetre.
The calculation teaches how measurement uncertainty expands with scale. A tiny model measurement error may represent a substantial real-world difference. The exact uncertainty depends on instruments, method and the scale. Do not attach this estimate to a Punggol road without the verified model scale and a reliable measurement.
Uncertainty belongs in the answer, not the footnote
Students sometimes think a mathematical answer must have many decimal places to look rigorous. Yet a model measurement made with a classroom ruler may support only modest precision. Reporting 36.0000 metres from a 7.2 cm reading creates false confidence. Rounding should reflect the quality of the information, not the capabilities of a calculator.
A good response distinguishes exact statements such as ‘scale 1:500 implies a factor of 500 for length’ from approximate statements such as ‘the measured strip was about 7.2 cm’. Mixing exact and approximate quantities without acknowledging their difference is a common source of misleading precision.
Worked example: the scale factor between two models
Suppose two entirely fictional models of the same building use scales 1:100 and 1:250. A 5 cm length on the 1:100 model corresponds to 5 m in reality. On the 1:250 model, the same real 5 m would appear as 2 cm. The smaller-denominator model produces a larger representation, assuming uniform scale and the same real object.
Students can solve this without memorising which model is ‘bigger’. Calculate the represented actual length from the first model, then divide by the second model’s factor. A common mistake is to assume that 1:250 produces a larger object because 250 is greater than 100. Thinking about division corrects that misconception.
Worked example: converting map scale to a statement scale
A hypothetical map with scale 1:50,000 means 1 cm on paper equals 50,000 cm in reality, or 500 m, which is 0.5 km. A statement scale could therefore read ‘one centimetre represents half a kilometre’. This is often more intuitive for families who want to understand the size of a neighbourhood on a printed map.
The same scale still requires care with actual travel. A winding route between two points may be longer than the straight-line distance measured on paper. A map can establish a distance relationship without deciding which public crossing or legal path is available. That difference is especially important when reading a town’s transport network.
Primary-to-secondary progression should be deliberate
At the primary level, a child can begin with centimetres and metres, basic ratios, perimeter and a simple scale such as 1:100. They should explain which direction to multiply or divide and why the representation is smaller. Complex area and volume scaling can be introduced gradually once units and geometric meaning are stable.
At the secondary level, students can connect similarity to area and volume ratios and move between several representations. They should be able to derive n² and n³ rather than simply recite them. A learner who still confuses cm² and m² benefits from repairing that foundation before attempting longer modelling tasks.
Common mistake: switching units halfway through
A student may write ‘8 cm × 500 = 4,000 m’. The multiplication yields 4,000 centimetres, not metres, if the model length was in centimetres. The scale ratio is dimensionless only when corresponding lengths are measured in matching units. To obtain metres, divide 4,000 cm by 100 to get 40 m.
The repair is to write a unit after each intermediate number, even when the calculation looks trivial. If a student cannot explain the unit of 4,000, the problem is not finished. This habit transfers to density, speed, rate, scientific measurement and everyday budgeting.
Common mistake: treating scale 1:500 as 500 centimetres
The notation 1:500 is a ratio, not a complete distance statement unless units are supplied. It means one unit in the model corresponds to five hundred of that same unit in the represented object. If we choose millimetres, 1 mm represents 500 mm; if we choose centimetres, 1 cm represents 500 cm.
The repair is to start with ‘model : actual = 1 : 500’ and apply the same unit to both sides. Then convert to a more convenient distance unit at the end. This makes the concept general enough to use on architectural models, maps and engineering drawings.
Common mistake: using square scale for perimeter
Perimeter follows the length factor, not the area factor. On a 1:100 scale drawing, a model perimeter of 20 cm represents a real perimeter of 2,000 cm, or 20 m. Multiplying by 100² would produce a perimeter far too large because the quantity is one-dimensional.
The student should underline the requested quantity before choosing a factor. If asked for a length or perimeter, use n. If asked for area, use n². If asked for volume, use n³, under the similarity assumptions. Naming the physical dimension is more reliable than memorising a list of unrelated examples.
Common mistake: treating photographs as exact geometric evidence
A perspective photo of a miniature building can make the top appear wider or the base look shortened. Measuring that view with an ordinary ruler and applying the model scale compounds two sources of error: photographic projection and possibly uncertain model scale. Even a high-resolution picture cannot automatically solve the geometry.
Repair the method rather than merely round the number. Choose a correctly scaled drawing, a calibrated orthogonal view or a verified physical measurement. If none is available, keep the conclusion qualitative. This is an important lesson for learners who expect digital images to contain perfect quantities.
How to check whether an answer makes sense
A model is a reduction. If a 1:1,000 model shows a 2 cm path, a calculated actual path length should be much larger than 2 cm and should equal 20 m. If a student produces a real length of 0.002 cm, the direction has probably been reversed. If they obtain 2,000 km, the unit conversion is suspect.
Use a second route where possible. Multiply from the model to real length, then divide the result by the scale factor to return to the original 2 cm. That inverse check tests both arithmetic and reasoning. For area and volume, make sure the inverse uses the squared or cubed factor rather than the length factor.
A small five-question family practice
Try these fictional problems without referring to the actual Cube scale. At 1:100, what does 4 cm represent? At 1:500, what does 3 cm represent? At 1:200, what is the model length of 50 m? If two model paths are 6 cm and 9 cm at the same scale, what is their ratio? If a model square’s side doubles, by what factor does its area change?
The answers are 4 m, 15 m, 25 cm, 2:3 and 4. Work through why each answer is correct, particularly the conversion in the third: 50 m is 5,000 cm, divided by 200 gives 25 cm. The fifth answer follows from 2². None of the fictional measurements comes from the photographs.
A harder three-dimensional challenge
Suppose a fictional cuboid feature uses model scale 1:50 and measures 4 cm by 3 cm by 2 cm. Represented actual dimensions are 2 m by 1.5 m by 1 m. The real volume is 3 m³. The model volume is 24 cm³; multiply by 50³ = 125,000 to obtain 3,000,000 cm³, or 3 m³.
Notice that both ways give the same result. This cross-check is stronger than a single formula because it demonstrates the meaning of each transformation. Students can then explain why multiplying 24 by only 50 would be incorrect for volume, even though 50 is the length factor.
Scale models and town planning require different kinds of evidence
The mathematics of scaling answers a question about relative dimensions under stated assumptions. Town planning asks additional questions: what was proposed, what has been approved, which development has opened and what route members of the public may use. A model can illustrate a plan without proving all the later administrative and construction steps were completed.
That is why Punggol’s Discovery Cube is best approached as both a historical visitor centre and an opportunity to learn representation. The mathematical process can be precise while the current operational status of a modelled facility remains uncertain. Consult HDB, URA or the relevant facility operator for the latter.
A parent can turn a real object into a better mathematical question
Rather than ask a child to invent an exact distance from a photograph, say: ‘If this model were at 1:500, what would 6 cm represent?’ Then let the child solve the conditional problem and identify its assumption. Afterwards ask why the answer cannot be claimed as the real length of the photographed road.
This simple change in wording teaches mathematical conditional reasoning. It keeps imagination and numbers useful while respecting evidence. A learner who can say ‘under the given scale’ is already thinking more carefully than one who treats every attractive diagram as an exact survey.
A secondary student can critique the model itself
Ask whether the scale appears uniform across length, width and height; whether landscape elements are stylised; whether the camera introduces distortion; and whether the exhibit labels are dated. These are questions a student can investigate with official information and an appropriate visit, not accusations that the model is defective.
Then distinguish error types: measurement error, representation simplification, wrong units, arithmetic error and outdated planning information. Each requires a different correction. Adding another decimal place does nothing to repair an outdated plan; checking a current government record does nothing to correct a forgotten square unit. Recognising the right problem saves effort.
The useful conclusion about Punggol’s miniature town
The photographed Discovery Cube model helps a reader picture relationships among built spaces. But numbers belong only where the relevant measurements and scale have been established. The strongest Mathematics comes from identifying what is given, deriving the correct conversion and checking whether the conclusion answers the requested quantity.
That approach travels beyond Punggol: maps, architectural drawings, toy models, prototypes and scientific diagrams all require the same discipline. The town-model photograph starts the conversation; correct units, ratios, geometry and evidence finish it.

What is the actual scale of Punggol Discovery Cube’s town model?
This guide does not independently verify it. Ask the venue for its current scale legend. Every numeric denominator in this article is an invented practice value.
What does 1:1,000 mean?
One unit on the model represents one thousand matching units in the corresponding full-sized object, assuming uniform scale.
How far is one model centimetre at 1:1,000?
1,000 cm, equal to 10 m. This is a calculation for the stated hypothetical scale.
How do I calculate real length?
Multiply the model length by the scale denominator, then convert units if necessary.
How do I calculate model length?
Put the real length in matching units, then divide by the denominator.
Why does area use a squared scale?
Both the length and width are scaled, so the factors multiply to n².
Why does volume use a cubed scale?
Three independent dimensions are scaled, producing n × n × n, or n³.
Can I measure distances from a screenshot?
Not reliably without scale calibration and geometric information about perspective.
What is a common error when converting m² to cm²?
Using a factor of 100 instead of 10,000.
Is a model’s apparent road route the real public walking route?
Not necessarily. Current crossings, access permissions and detours require separate verification.
Can a model show a proposed building?
Yes. Presence in a model does not by itself establish public opening or completion.
Why does the photo upload date not establish the model’s age?
The photograph date and the creation or revision date of the physical exhibit are different facts.
Can primary pupils practise this topic?
Yes, beginning with ratios, equivalent units and scale-length problems before moving to area and volume.
What should secondary students add?
Similarity, area and volume ratios, inverses, uncertainty and critical evaluation of assumptions.
How many significant figures should be reported?
Precision should match the quality of the given measurement and context, not the calculator’s displayed digits.
How can I check my calculation?
Reverse the scale transformation and confirm it gives the original length or geometric quantity.
Does a scale of 1:250 show more detail than 1:1,000 for the same object?
Generally, a 1:250 representation is physically larger for the same object, under comparable conditions.
What if the scale legend is missing?
Describe the features qualitatively or obtain reliable measurements; do not invent the scale.
Who should confirm present-day Punggol project status?
The appropriate public agency or facility operator, rather than the model photograph.
Where is the visitor and history guide?
The dedicated Punggol Discovery Cube family guide linked at the beginning covers that separate purpose.
Official references and connected Mathematics reading
- Prime Minister’s Office — Opening of Punggol Town Square and Discovery Cube, 15 January 2017.
- HDB — Town and Community Plazas.
- Punggol Discovery Cube — visitor history and family use.
- Punggol Mathematics — Geometry, Measurement, Area and Volume.
- Punggol Mathematics — Coordinate Geometry and Distance.
- Punggol in Pictures — original October 2026 photo collection
Editorial and evidence note, 23 October 2026: images are original eduKatePunggol October 2026 media records. The Cube’s actual scale, any building dimensions and current displayed project statuses are not established by the pictures. Every numerical worked example uses explicitly hypothetical, classroom-ready measurements. The original model should not be touched or measured against venue rules.


