
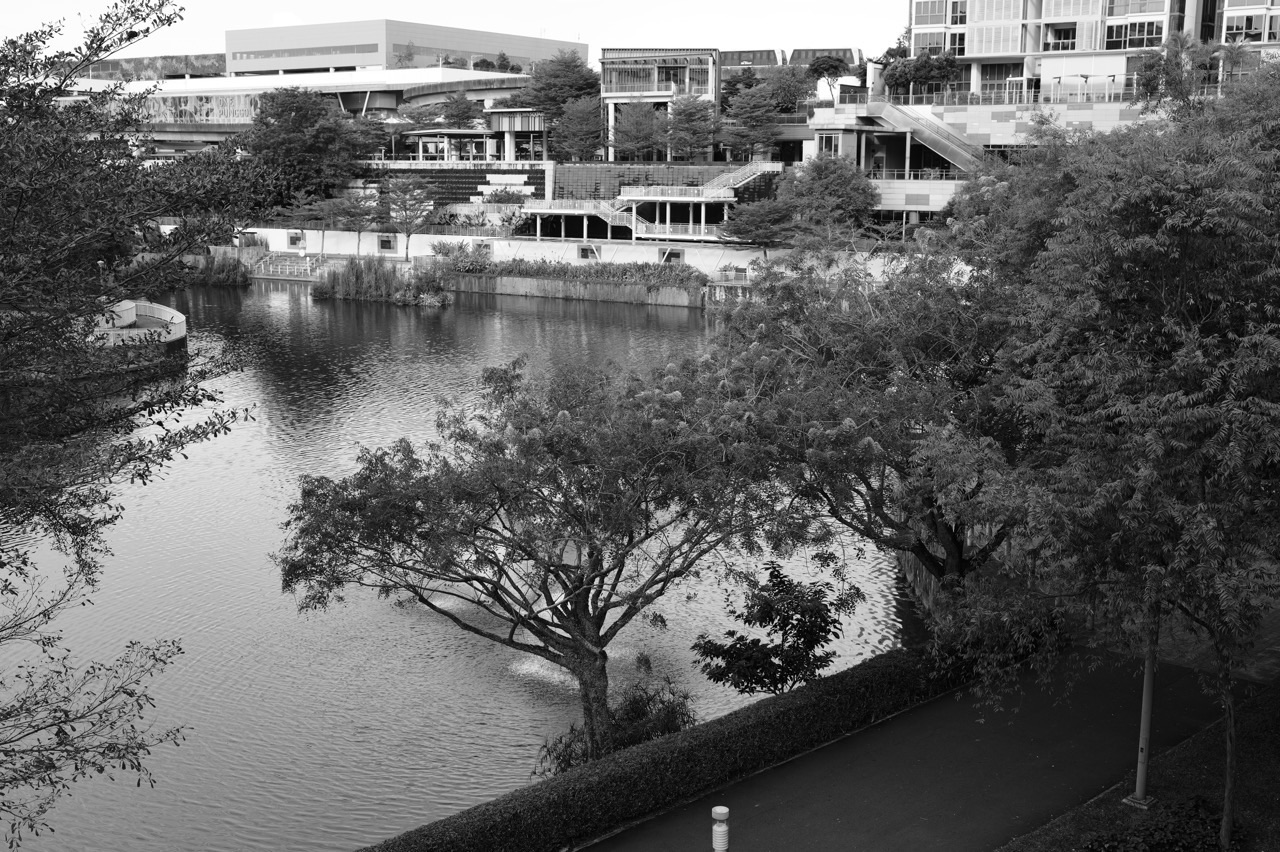
The top 10 things to do in Punggol for Environmental Science students are to analyse Lorong Halus Wetland’s engineered treatment, study Treelodge@Punggol’s rainwater design, compare Coney Island habitats with managed Waterway Park, observe planted blue-green infrastructure, interpret NEA’s air-quality data, investigate shade and microclimate, read Punggol Digital District’s solar and smart-grid plans, learn Singapore’s Return Right beverage-container deposits, carry out NEA-recommended mosquito prevention and plan an authorised litter audit. Each activity provides a practical question and a reliable source.
Best starting activity: read PUB’s Lorong Halus Wetland learning trail and make a diagram showing the former landfill, engineered treatment and receiving reservoir. For a short outdoor visit, choose a safe, signed public viewpoint in Punggol Waterway Park. For an indoor project, examine NEA’s environmental data with its reporting time, region and units. Do not collect water, access electrical equipment or invent pollution-removal percentages.
This October 2026 guide combines Earth systems, environmental chemistry, ecology, engineering and civic behaviour. The first two paragraphs answer what to investigate and how to begin; the remaining sections supply safe methods, worked examples and evidence limits. Where a number is hypothetical it is called hypothetical, and where JTC, PUB, HDB or NEA makes a published claim it is attributed to that organisation.
Environmental Science asks four questions
- What system are we studying? Water, air, habitat, energy, materials or human behaviour.
- What can be directly observed? Public vegetation, a correctly timestamped data value, a marked container or a genuine design feature.
- What measurement would prove the claim? Appropriate concentrations, flow, temperature, biodiversity survey effort or energy-meter data.
- Who is responsible for the site and safety? PUB, NParks, HDB, JTC, NEA, the local managing authority or an authorised programme organiser.
Do not confuse an attractive landscape with a measured environmental outcome
A wetland may look clean while still containing dissolved or microscopic substances a visitor cannot detect. A shaded walkway may feel cooler, but individual sensation is not a calibrated temperature survey. A solar panel may be visible without revealing annual electricity production. Environmental Science starts when students separate a system’s documented purpose from the measurements that would demonstrate its actual performance.
Use a six-column notebook: specific question, source and date, directly observed feature, measured or reported variable, interpretation, and limitation. Map a short public location accurately without publishing any sensitive wildlife coordinates or residents’ private information. Where a source is a planned development or estimated design benefit, mark that status rather than presenting it as a live outcome.
Ten Punggol environmental investigations
1. Analyse Lorong Halus Wetland as engineered pollution prevention
Where: Lorong Halus Wetland, public routes along the eastern bank of Serangoon Reservoir.
What makes this a local environmental case study
PUB describes Lorong Halus Wetland as an engineered system collecting and treating water passing through the former landfill before it enters Serangoon Reservoir. This is a local environmental science case in which a former land use creates a continuing water-management obligation. Studying it means connecting site history, hydrology, chemical treatment objectives and the habitat that has developed around the facility. A scenic view cannot establish how many milligrams of a substance were removed.
How to investigate it
Begin with PUB’s official overview and its ABC Waters Learning Trail resource. Make a three-part systems diagram showing the historic landfill catchment, treatment wetland and protected reservoir. Distinguish water flowing through the designed system from rainfall running over public paths. Write a separate question for each proposed measurement: which analyte, in what units, at which point and time? If a school wishes to do hands-on water-quality testing, arrange it under PUB’s conditions and an appropriately qualified educator; a casual public visit does not authorise collecting samples.
Worked example and the first reasoning error
An illustrative study sets a completely hypothetical inlet concentration at 10mg/L and outlet concentration at 4mg/L. It calculates a 60% reduction in concentration, assuming suitable comparable samples. That number is not PUB performance data and says nothing about treatment mass without flow volume. Another student records clear water from the public footbridge and calls it clean. The corrected conclusion reads: ‘PUB describes engineered treatment; I did not measure water quality.’
The stronger next question
Build an evidence table with columns for site purpose, published process, measurement needed, possible confounding variable and uncertainty. Consider how heavy rainfall could affect flow and sampling, even if contaminant treatment were unchanged. Explain why a single before-and-after reading may be insufficient to establish long-term performance. Finish by identifying the kinds of published monitoring results that would justify a quantitative claim.
Safety, permissions and evidence limits
Stay on signed paths, keep away from treatment ponds and do not touch water, plants or landfill material. PUB’s educational guides are not a blanket permit for sampling. Suspend outdoor visits in lightning, high heat or other unsafe weather.
Primary source: Analyse Lorong Halus Wetland as engineered pollution prevention. Check current access and programme conditions before travelling.
2. Trace urban rainwater and resource design along HDB’s Eco-Town trail
Where: Publicly accessible Treelodge@Punggol vicinity and HDB’s official Explorer Trail.
What makes this a local environmental case study
HDB identifies Treelodge@Punggol as an eco-precinct with an Eco-Deck, Green Spine and rainwater-harvesting system used for washing common corridors and watering plants. It also describes My Waterway@Punggol as a 4.2km man-made waterway. This allows a concrete discussion of water conservation and green building design without inventing a household’s actual water bill or guessing the volume collected by tanks that are not publicly accessible.
How to investigate it
Read HDB’s Explorer Trail and decide whether to complete a desktop analysis or a lawful short public visit. Draw a diagram separating rainfall, roof or other collection surface, storage and non-potable use. Label that as a conceptual representation of the described system, not an as-built plumbing plan. Identify which features can be observed from open ground and which require operator data. Discuss how water conservation might reduce demand for treated potable water, while recognising that quantity and effectiveness would need measured figures.
Worked example and the first reasoning error
A fictional calculation assumes an ideal 10-square-metre collection surface receives 20mm of rain. Converting 20mm to 0.02m gives 10 × 0.02 = 0.2 cubic metres, or 200 litres before losses. It does not mean Treelodge harvested 200 litres from any particular roof. A realistic engineering estimate would need runoff efficiency, usable catchment area, rainfall records and tank capacity.
The stronger next question
Ask what happens when a collection tank is already full or rainfall is insufficient. Design a process diagram with overflow, storage and alternate supply as conditional cases. A student can propose a water-demand calculation for a fictional landscaped area, checking litres and days. The key lesson is that an environmental benefit has system boundaries, not just an attractive green label.
Safety, permissions and evidence limits
Do not enter plant rooms, resident-only eco-decks or private flats to locate pipes or sensors. HDB’s descriptions establish design intent, not real-time measured conservation. Stay within publicly permitted routes.
Primary source: Trace urban rainwater and resource design along HDB’s Eco-Town trail. Check current access and programme conditions before travelling.
3. Compare managed waterway planting with the habitats of Coney Island
Where: Punggol Waterway Park and Coney Island Park, on safely planned separate visits.
What makes this a local environmental case study
NParks lists waterway planted zones and describes Coney Island Park as an 81-hectare rustic habitat containing coastal forest and mangroves. Both provide environmental value, but their design, maintenance and visitor access differ. Environmental science should examine ecosystem processes and human management rather than declaring that landscaped greenery is ecologically worthless or that a rustic park is untouched wilderness.
How to investigate it
Create a standard observation card with habitat type, vegetation structure, visible fauna, time, conditions and human activity. Use current NParks maps to choose one legal viewpoint at each site, or conduct a desktop comparison when access or weather is unsuitable. Spend equal observation periods if comparing findings. Record unknown species as unknown and do not convert bird calls into counts of confirmed individuals without a suitable method. Discuss the limitations of a single ten-minute visit.
Worked example and the first reasoning error
An illustrative comparison yields three confidently identified plant forms at one short Waterway Park section and five at a Coney Island viewpoint. This does not prove Coney Island has greater total biodiversity; the sites, identification method, habitat visibility and survey effort were not controlled. The defensible result is a limited observation summary with a proposal for a fairer comparative survey.
The stronger next question
Propose how repeated sampling in equivalent time windows might help, while explaining detectability. Consider the effect of accessibility: some habitats may contain organisms the learner cannot legally approach. An excellent report treats the inability to enter a sensitive area as an ethical and methodological limit, not a problem to bypass.
Safety, permissions and evidence limits
Coney Island opens 7am–7pm; keep a sufficient exit buffer. Do not enter closed areas, mangroves or seawater. Respect wildlife, do not feed animals and never harvest plants for specimens.
Primary source: Compare managed waterway planting with the habitats of Coney Island. Check current access and programme conditions before travelling.
4. Examine planted waterway edges as a form of green infrastructure
Where: Signed Punggol Waterway Park public paths and viewpoints.
What makes this a local environmental case study
NParks describes the ecological role of aquatic planting around the waterway, naming plants such as Red Thalia, Bulrush and Swamp Cabbage. These are not decorative afterthoughts alone: planted edges can be components of a managed water environment. Students can distinguish the physical structure of an urban blue-green corridor from the ecological services claimed for it, and then ask what evidence would quantify those services.
How to investigate it
Read NParks’ park interpretation, then observe planted banks from a safe path. Record broad growth forms, shaded versus exposed surfaces and interactions between paths and vegetation. Do not assign exact species from a blurred photograph or claim a contaminant has been removed because the water looks attractive. Draw a systems diagram distinguishing runoff, planting, sediment, water and public access. State which processes are conceptual and which site features were observed.
Worked example and the first reasoning error
A learner photographs a dense stand of waterside plants and writes that the plants filter 90% of all pollution. Neither the figure nor the word ‘all’ is supported. A corrected version says NParks identifies aquatic planting as contributing to environmental management; no pollutant concentration or flow was measured during the visit. The revised description remains informative without invented precision.
The stronger next question
Create a comparison between two hypothetical bank designs—one bare hard edge and one planted edge. Identify potential trade-offs such as maintenance, habitat provision, sightlines, drainage and walking access. These are hypotheses to investigate, not performance claims about actual Punggol infrastructure. Describe what a professional monitoring programme would measure.
Safety, permissions and evidence limits
Do not pick, taste or disturb aquatic planting; Swamp Cabbage is a common name, not a food safety guarantee. Avoid water edges and keep public shared paths clear.
Primary source: Examine planted waterway edges as a form of green infrastructure. Check current access and programme conditions before travelling.
5. Interpret haze and air-quality information from NEA myENV
Where: An indoor study session before any optional Punggol park outing.
What makes this a local environmental case study
NEA presents one-hour PM2.5 and 24-hour PSI as distinct environmental metrics. PM2.5 is a size-defined category of fine particulate matter; a concentration in micrograms per cubic metre should not be treated as a dimensionless PSI value or a chemically identified pollutant mixture. The location information also matters: an official regional reading is not a personal exposure monitor at a particular HDB block.
How to investigate it
Open myENV or NEA’s official guide and make a source card with reporting region, value, unit, timestamp and metric. Compare the separate displayed time windows and read the relevant current health advisory for an intended activity. For data practice, create a clearly fictional three-hour series rather than publishing today’s value in an evergreen article. Ask what variables—including wind, microenvironment, indoor conditions and exposure duration—would be necessary for a personal exposure assessment.
Worked example and the first reasoning error
Fictional North-East regional PM2.5 values of 15, 20 and 25µg/m³ give a simple arithmetic mean of 20µg/m³. The result does not represent a real 2026 day, does not supply the 24-hour PSI and cannot determine an individual child’s exposure. A student who labels it ‘Punggol homes average’ has enlarged the geographic claim beyond the underlying information.
The stronger next question
Discuss why data visualisations need axis units and timestamps, and why a missing value should be shown as missing. Build a decision tree using real advisories: continue safe indoor learning, reconsider an exposed walk, or follow the official specific recommendation. No individual health diagnosis should be inferred from the dataset.
Safety, permissions and evidence limits
Never make children exercise outdoors during hazardous haze to collect a reading. Refer to current official advice, and use appropriate medical guidance for personal health concerns.
Primary source: Interpret haze and air-quality information from NEA myENV. Check current access and programme conditions before travelling.
6. Investigate shade and microclimate near Punggol’s public walkways
Where: A short suitable public Punggol Waterway Park section, or a controlled safe desk model.
What makes this a local environmental case study
A shaded path can feel more comfortable than exposed paving, but thermal comfort includes radiation, air movement, humidity, surface materials, clothing and activity. JTC’s Punggol Digital District design also emphasises passive shading and airflow. Students should resist the common shortcut of converting a personal impression into a measured urban heat reduction. Environmental fieldwork is about identifying variables that could explain a pattern.
How to investigate it
If weather is suitable, compare a shaded and sunlit viewpoint from safe ordinary public access without deliberately lingering in heat. Record time, shade condition, wind impression and surface type, making no exact temperature claim without suitable calibrated instruments. Alternatively, build a small indoor cardboard shade model with a cool light to illustrate geometry. Write down how the model differs from outdoor heat transfer and keep the relevant physics limited to what was tested.
Worked example and the first reasoning error
A student’s fictional laboratory thermometer readings are 31.8°C and 30.2°C on two model surfaces. The difference is 1.6°C under those example conditions. This does not show that every shaded Punggol pathway is 1.6°C cooler. If surfaces or measurement times differ, the result may reflect several confounding factors rather than shade alone.
The stronger next question
Plan a fair comparison using repeated measurements at the same times and appropriate controls. Distinguish air temperature from a pavement’s surface temperature. Explain why a heat-exposure study involving people needs an ethical plan and should not rely on forcing anyone into uncomfortable conditions.
Safety, permissions and evidence limits
Follow NEA UV and weather guidance, especially during strong midday sun. Never direct children to stand exposed to high heat merely to produce data. Stay off private rooftops and technical areas.
Primary source: Investigate shade and microclimate near Punggol’s public walkways. Check current access and programme conditions before travelling.
7. Study the energy model of Punggol Digital District without accessing a grid
Where: JTC’s public Punggol Digital District sustainability information and open public spaces.
What makes this a local environmental case study
JTC describes a district-level smart grid integrating solar generation, battery storage and connected control systems. It estimates rooftop solar will produce 3,000MWh annually and describes a carbon reduction estimate. These are attributable project expectations, not a meter reading observed by a visitor. Environmental science students can learn about energy balance and the importance of distinguishing expected output from independently verified performance.
How to investigate it
Read JTC’s page and list the system boundaries: solar source, battery, electrical grid, building demand and management platform. Draw separate arrow types for energy and control information. Convert the published annual energy estimate from MWh to kWh with correct units. Then propose a hypothetical demand pattern and what additional measurements would be required to establish actual emissions reductions. Do not claim access to operational sensors, algorithms or private facilities.
Worked example and the first reasoning error
The published expectation of 3,000MWh in one year is equivalent to 3,000,000kWh. Dividing that number by 365 yields about 8,219kWh per day as an arithmetic average, not a promise of constant daily solar production. Rain, clouds, operations and actual equipment performance can change output. Carbon claims also require assumptions about displaced generation.
The stronger next question
Compare energy, power and carbon emissions as different quantities. The student can show that 1kW operated for 2 hours corresponds to 2kWh in a simplified model. Then ask what emissions factor, timing and counterfactual energy supply would be needed for an environmental impact claim.
Safety, permissions and evidence limits
Public district access does not include rooftops, battery rooms, IT systems or private SIT workspaces. Use the project description as the source and label every personal calculation.
Primary source: Study the energy model of Punggol Digital District without accessing a grid. Check current access and programme conditions before travelling.
8. Check Singapore’s 10-cent beverage-container deposit as a circular-economy case
Where: Official Return Right information and an operating authorised return point relevant to the family.
What makes this a local environmental case study
The Beverage Container Return Scheme was implemented in April 2026, and Singapore’s regulations specify a 10-cent deposit for prescribed marked metal and plastic drink containers of 150ml to 3 litres, with the deposit-mark date tied to October 2026 requirements. It aims to support collection of a cleaner material stream. The relevant environmental learning is material recovery and behavioural incentives—not an invitation to buy unnecessary beverages to collect rewards.
How to investigate it
Read the official Return Right eligibility and deposit-mark information. Examine an eligible empty container you already possess and check the symbol and barcode before returning it. Use the operator’s live return-point locator and follow the specific machine rules. Record the material type, quantity and refundable deposit without copying payment account details. For a desk-only comparison, calculate deposits on clearly hypothetical counts and consider the possibility of damaged or unmarked containers being ineligible.
Worked example and the first reasoning error
Five eligible marked containers at a 10-cent deposit yield a refund of 50 cents, provided the scheme accepts the containers and the deposit has been paid as specified. It is a refund, not 50 cents of profit from buying drinks. A glass bottle or ordinary cup does not become eligible because it is beverage packaging. A student should distinguish system eligibility from general recyclability.
The stronger next question
Compare a deposit-return scheme with household blue-bin collection: each uses different acceptance rules and collection design. Think about contamination, transport to collection points and the quality of recovered material. An environmental life-cycle analysis would need more evidence than a simple count of returned containers.
Safety, permissions and evidence limits
Do not leave rejected containers beside machines, damage containers to test scanner behaviour or invent a return-point location. Deposit-mark eligibility and current operation must be checked with the scheme operator.
Primary source: Check Singapore’s 10-cent beverage-container deposit as a circular-economy case. Check current access and programme conditions before travelling.
9. Connect NEA’s weekly Mozzie Wipeout with environmental public health
Where: The household’s own authorised Punggol indoor and outdoor water-holding areas.
What makes this a local environmental case study
NEA warns that Aedes mosquitoes can breed in very small amounts of standing water and recommends a weekly Mozzie Wipeout. Environmental science includes understanding how built environments create or reduce breeding habitats for disease vectors. Students should not confuse dengue transmission with simply seeing any mosquito: public health risks require appropriate surveillance and epidemiological evidence.
How to investigate it
Read NEA’s prevention guidance and inspect only containers in your own household or areas you are authorised to maintain. Empty and properly store stagnant-water containers, inspect plant saucers and follow safe drainage practices. Use an observation checklist recording potential breeding sites removed, without collecting larvae or breeding mosquitoes for a classroom experiment. Discuss why regular repetition matters after rainfall and how one household action fits within larger vector-control work.
Worked example and the first reasoning error
A household finds water retained in a small unused plant saucer and empties it. The student can truthfully state that one potential standing-water source was removed. They cannot conclude that a dengue outbreak was prevented or that mosquito eggs were present without evidence. This difference separates a sensible prevention action from an untestable causal claim.
The stronger next question
Draw a simple causal pathway of suitable breeding water, mosquito development and potential disease transmission, labelling biological conditions separately from reported dengue case numbers. For advanced learners, compare the ethical issues in environmental surveillance with personal medical privacy.
Safety, permissions and evidence limits
Never breed, capture or release mosquitoes or use unapproved chemicals. Do not enter neighbours’ homes or restricted drains. Anyone with concerning symptoms should follow professional medical advice rather than a school worksheet.
Primary source: Connect NEA’s weekly Mozzie Wipeout with environmental public health. Check current access and programme conditions before travelling.
10. Plan an authorised, safe Punggol litter audit rather than a spontaneous cleanup
Where: Approved public park or beach areas, with organiser registration where required.
What makes this a local environmental case study
NEA provides a formal e-Portal for self-facilitated beach and park cleanups; its instructions specify a registration window and separate Public Hygiene Council CleanPod arrangements. The exercise can teach waste characterisation, sampling and responsible community management, but sorting hazardous litter or entering sensitive habitat for a photo can cause harm. A careful field investigation begins with rules, safety and an accurately defined observation scope.
How to investigate it
For an official group clean-up, follow the NEA portal’s current requirements and obtain confirmation in advance. Check the presently displayed 21–90-day registration window and operator-specific site instructions rather than guessing a date. For a non-collection learning activity, study public litter categories from an existing authorised dataset or use fictional example records at home. If accepted for a cleanup, follow the organiser’s safety briefing, wear suitable equipment, avoid hazardous material and record only permitted categories and accurate totals.
Worked example and the first reasoning error
A group records 12 safe handled pieces of plastic packaging and 8 pieces of ordinary paper litter in a hypothetical authorised 20-item sample. The proportions are 60% and 40% by item count, not by mass, toxicity or all Punggol litter. A student’s title saying ‘Punggol waste is 60% plastic’ is unjustified. The correct caption describes only the sampled items, date and method.
The stronger next question
Consider sources of bias: a path near food outlets may differ from a quiet park stretch, and counts from a one-hour cleanup cannot represent annual waste. A long-term monitoring plan would require comparable areas and repeat methods. Explain why recycling an item and preventing its initial use are different interventions.
Safety, permissions and evidence limits
Do not touch needles, unidentified chemicals, sharp broken glass or batteries. NEA and PHC do not automatically supply facilitators or participation certificates. Postpone during lightning or unsafe weather, and check current registration terms before committing a group.
Primary source: Plan an authorised, safe Punggol litter audit rather than a spontaneous cleanup. Check current access and programme conditions before travelling.
Three Environmental Science projects you can complete safely
A one-hour waterway observation
Select one current publicly accessible Waterway Park viewpoint. Read the NParks park information first and use a short route suitable for the participants. Sketch water, planted banks, paths and nearby built space. Describe one design purpose from the official source and one visible feature from your own dated observation. End by stating which environmental outcome you cannot measure. The project is complete without walking the full connector or disturbing the water.
A desktop air-quality and energy project
Use NEA’s myENV guide to understand the difference between one-hour PM2.5 and 24-hour PSI, then read JTC’s smart-grid and solar-energy description. Build separate information cards for each metric, its unit and time horizon. An hourly concentration, a dimensionless index and an annual energy estimate cannot be merged into one environmental score. You can use invented numbers for conversion practice, provided they are conspicuously labelled as fictional.
A household waste-and-prevention diary
Examine one correctly eligible Return Right container that has already been purchased, check the scheme rules and plan a lawful return. Carry out a NEA-recommended water-collection check in your own household without breeding insects. Record actual actions without claiming an unmeasured carbon or health outcome. A class can compare the incentives of the deposit system with the repeated maintenance habit of dengue prevention.
How to write an honest environmental conclusion
Start with the precise claim your observations support. ‘I saw planted banks along one stretch of Punggol Waterway Park’ is an observation. ‘NParks says aquatic planting helps remove pollutants’ is an attributed institutional statement. ‘The plants removed 90% of pollution on my visit’ would be an unsupported quantitative claim. Good environmental writing keeps these apart and names what was not measured.
A valid hypothesis may still be worth investigating even when the answer is unknown. For instance, the question ‘Does a shady part of a public path feel more comfortable to users?’ is potentially useful, but collecting data ethically requires a clear definition of comfort, appropriate participants, weather information and consent. Students should not force people into uncomfortable conditions merely to produce a number. A carefully designed proposal is itself meaningful learning.
Mistakes worth catching before publication
- Treating a visually clear body of water as laboratory-confirmed safe.
- Calling a park planting description proof of a specific pollutant removal percentage.
- Presenting JTC’s expected annual solar generation as today’s energy-meter output.
- Confusing one-hour PM2.5 with 24-hour PSI.
- Turning a short wildlife observation into a full park biodiversity ranking.
- Claiming a hypothetical shade temperature is a measured Punggol value.
- Buying extra drinks merely to accumulate refundable container deposits.
- Leaving rejected recycling material at a return machine.
- Entering a closed habitat or water-treatment facility for a sample.
- Publishing waste composition claims from a small biased sample as if they represent the whole town.
Frequently asked questions
What is the best Environmental Science site in Punggol?
Lorong Halus Wetland is a particularly clear officially documented case of engineered treatment, while Waterway Park, Coney Island and Punggol Digital District support other environmental questions.
What does Lorong Halus Wetland treat?
PUB says it collects and treats water passing through the former landfill before that water reaches Serangoon Reservoir.
Can I collect samples from the wetland?
An ordinary visit does not authorise water or soil sampling; follow PUB’s actual educational arrangements and safety requirements.
Why is Treelodge@Punggol relevant?
HDB documents its Eco-Deck, Green Spine, cross-ventilation design and harvested-rainwater uses.
Is the Punggol waterway natural?
HDB describes My Waterway@Punggol as a planned 4.2km man-made waterway.
How is Coney Island different from Waterway Park?
Coney Island contains rustic coastal forest and mangrove habitats, while Waterway Park is a highly planned blue-green recreational corridor.
When does Coney Island close?
NParks lists 7am to 7pm daily.
What is PM2.5?
It is fine particulate matter in a defined aerodynamic size range, reported in concentration units, not one named chemical compound.
Can regional air data determine exposure at my block?
Not precisely. Regional readings are not an individual’s indoor or street-level measurement.
Does shading always lower air temperature?
Thermal comfort depends on radiation, air temperature, wind, humidity and other conditions; a visually shaded path is not proof of a specific numerical reduction.
How much energy does JTC expect from Punggol Digital District’s solar panels?
JTC publishes an expectation of about 3,000MWh annually, not a guaranteed uniform daily output.
When was Singapore’s Beverage Container Return Scheme implemented?
IRAS records implementation from 1 April 2026; deposit-mark supply requirements and transition details must be checked against the applicable current rules.
How much is the Return Right deposit?
Ten Singapore cents for eligible prescribed marked prepackaged beverage containers, refundable under the scheme rules.
Should I crush a Return Right container?
Check the operator’s instructions, including barcode and deposit-mark readability; do not damage containers before using a machine.
How often should households prevent mosquito breeding?
NEA recommends a weekly Mozzie Wipeout to remove stagnant-water breeding opportunities.
Can children breed mosquitoes for a school project?
No. Use safe life-cycle diagrams and prevention activities without creating a public-health risk.
Can anyone organise a park cleanup tomorrow?
Organised beach and park cleanups can require NEA registration and site-specific permission. Check its live e-Portal rules before fixing a date.
Does registering a cleanup provide free facilitators?
NEA describes its process as self-facilitated, with separate tool arrangements. Follow the organiser’s safety requirements.
How do I report an observation without exaggerating?
State the site, method, date, units, actual result, authority source and one important limitation.
Can I do an Environmental Science project entirely indoors?
Yes. Official documented systems, open data, hypothetical calculations and safe household prevention can support meaningful desktop inquiry.
Official references and further Punggol reading
- Analyse Lorong Halus Wetland as engineered pollution prevention
- Trace urban rainwater and resource design along HDB’s Eco-Town trail
- Compare managed waterway planting with the habitats of Coney Island
- Examine planted waterway edges as a form of green infrastructure
- Interpret haze and air-quality information from NEA myENV
- Investigate shade and microclimate near Punggol’s public walkways
- Study the energy model of Punggol Digital District without accessing a grid
- Check Singapore’s 10-cent beverage-container deposit as a circular-economy case
- Connect NEA’s weekly Mozzie Wipeout with environmental public health
- Plan an authorised, safe Punggol litter audit rather than a spontaneous cleanup
- IRAS official BCRS implementation and refundable-deposit facts
- JTC current public access and community amenities
- Punggol Geography fieldwork
- Punggol Chemistry experiments and evidence
- Punggol Biology and ethical habitats
- Punggol Engineering systems
- eduKateSG model for precise working and explanation
Environmental understanding comes from evidence, not the appearance of certainty
Punggol’s wetlands, urban greenery, housing designs and modern energy systems provide more than enough questions for one learning journey. Choose a narrow investigation, use the proper agency source, take only safe authorised observations and label every assumption. A well-qualified small result is more valuable to a reader than an impressive unsupported environmental claim.


