
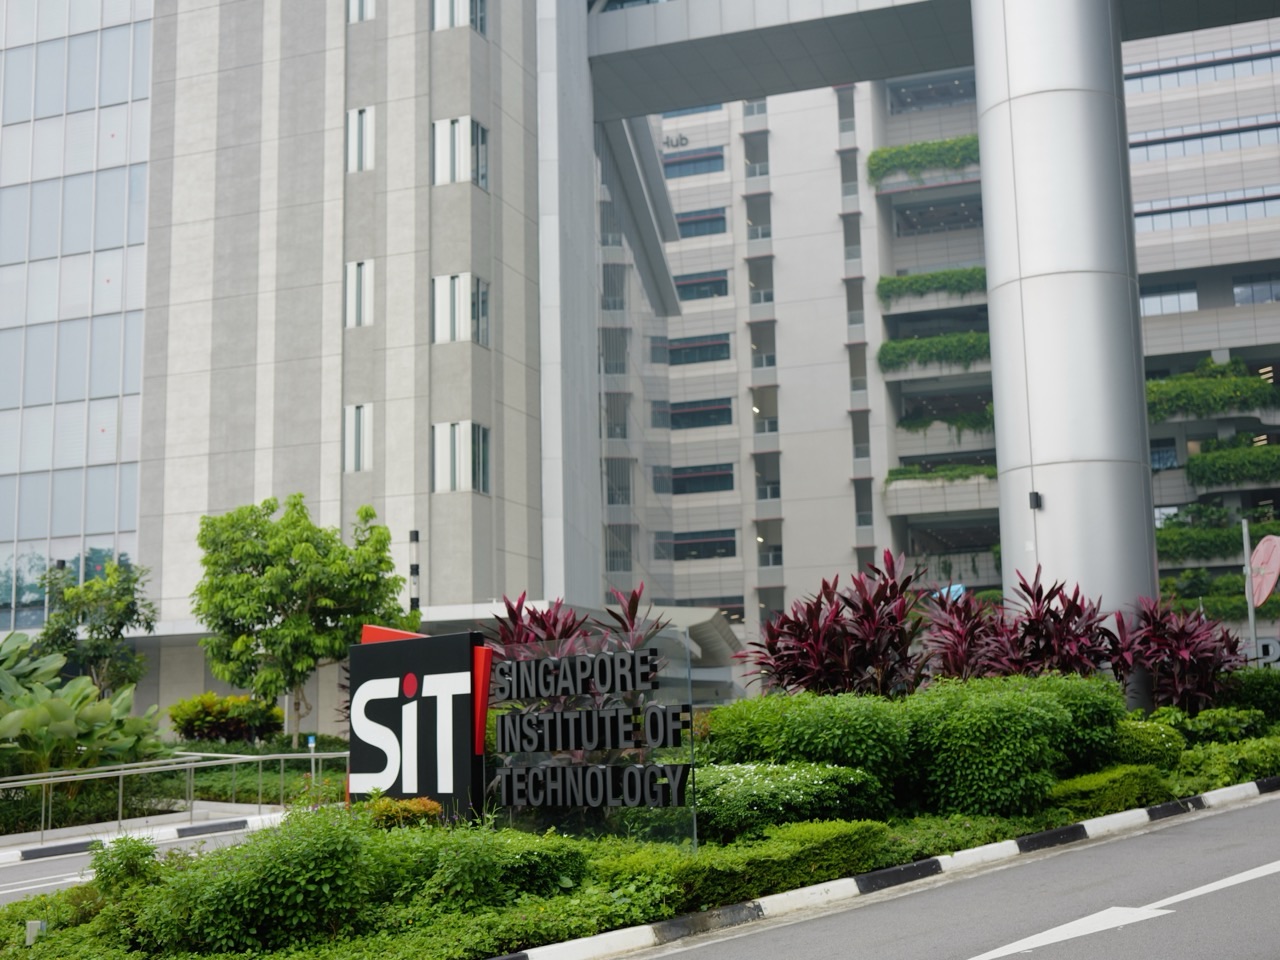
How does Punggol connect Primary Science to renewable-energy engineering? A child begins with light, heat, electrical circuits and fair tests. Secondary Science adds energy conversion, generators and electrical systems. JC, polytechnic and university courses extend that understanding into photovoltaic devices, batteries, grid operations, thermal systems, data analytics and engineering design. Punggol’s real applied-learning example is the Singapore Institute of Technology’s campus microgrid and living-lab infrastructure, but viewing the buildings does not grant uncontrolled access to electrical equipment or operational data.
What changed in Singapore’s current targets? The Energy Market Authority announced on 2 March 2026 that Singapore’s national installed-solar target is now 3 gigawatt-peak (GWp) by 2030, increased from the earlier 2 GWp target. EMA reports Singapore reached 2 GWp in 2025 and published 2,339 MWp grid-connected capacity at end-Q2 2026. These are system-wide capacity figures, not measured solar production at any individual Punggol building and not predictions of an individual household bill.
What SIT actually provides: SIT’s official Punggol Campus page describes a multi-energy microgrid, approximately 10,000 m² of rooftop solar panels, district cooling and an Integrated Building Management System using more than 20,000 IoT sensors. Its Campus as a Living Lab programme describes secure infrastructure and approved data access for teaching, research and industry. The campus provides a rich example of real systems but is not an open public laboratory where pupils may adjust batteries, controls or grid connections.
Renewable Energy Education in Punggol: the fast answer
| Learning stage | Core Science | Next evidence-based step |
|---|---|---|
| Primary 3–4 | Materials, light and heat, observation and safety. | Describe what was observed; do not invent an electrical measurement. |
| Primary 5–6 | Simple circuits, energy, photosynthesis and environmental interactions. | Separate source, transfer, useful output and limitations. |
| Secondary Science | Current, voltage, generators, fields, heat and control. | Read units and circuit paths accurately. |
| JC H2 / Diploma | Electrical energy, electromagnetic induction, semiconductors and quantitative lab work. | Compute correct power/energy and evaluate a fair comparison. |
| NUS/NTU engineering | Energy conversion, batteries, power systems and optimisation. | Validate models, safety and operational constraints. |
| SIT Punggol projects | Approved microgrid/district-cooling living-lab context. | Use authorised data with clear provenance and supervision. |
Current 2026 facts and what they mean
| Verified fact | Date and source | Scientific caution |
|---|---|---|
| National solar target: 3 GWp by 2030 | EMA, 2 March 2026 | Capacity target, not guaranteed generated electricity. |
| Installed solar capacity passed 2 GWp | EMA, 2025 milestone reported 2026 | Cumulative installed peak capacity, not a single day’s power. |
| End-Q2 2026 grid-connected capacity: 2,339 MWp | EMA statistics | Different date from earlier reports. |
| SIT Punggol has an MEMG and rooftop PV | SIT official campus description | Operational details and data access are permission-controlled. |
| NUS Engineering Science has Energy Science and Technology options | NUS 2025-cohort specialisation page | Major/specialisation rules and course availability are cohort-specific. |
| NTU publishes 2026 sustainability-linked power courses | NTU BS + Sustainability AY2026 curriculum | The published option is not equivalent to a universal energy degree. |
For a family’s education decision, the key is distinguishing Science content from marketing claims. A solar panel converts some incident light energy to electrical energy; an electric battery stores energy electrochemically; a microgrid coordinates distributed sources and loads; and district cooling transfers heat through an engineered system. None of these claims allows a child to infer a campus’s exact efficiency or savings without measured data and appropriate system boundaries.
Forty concepts that bridge classroom energy to real engineering
1. Energy is a quantity, power is a rate
Energy is measured in joules or kilowatt-hours, while power is measured in watts or kilowatts. A device rated 2 kW does not necessarily use 2 kWh unless it operates at that power for one hour.
Learning example. An ideal device draws 2 kW for three hours: energy is 6 kWh. If it is switched off for an hour, the simple calculation changes. Real devices can have variable loads.
Independent diagnostic. Ask a pupil to identify which instrument or dataset reports power and which reports accumulated energy. Incorrect units expose the missing concept.
2. Light intensity and solar energy are different measurements
Light intensity or irradiance refers to incoming power per area, while energy is accumulated over time. A momentarily bright noon does not prove more total daily electricity than another day.
Learning example. A sensor measuring 600 W/m² at one moment does not establish a full-day energy total. Integrating irradiance over time requires a suitable series of observations.
Independent diagnostic. Ask which measurements and panel properties would be needed to estimate a real day’s energy production.
3. A solar module’s rated capacity is not daily output
Peak capacity in Wp or kWp is a standardised rating used to describe PV modules. Actual output depends on irradiance, temperature, angle, shading, system losses and operating conditions.
Learning example. Two panels have identical Wp ratings but different shaded periods. One may generate less energy over a day despite the same peak rating.
Independent diagnostic. Distinguish peak installed capacity from generation in kWh; a national GWp target is not a stated daily electricity yield.
4. The photovoltaic effect is not a hot-water heater
Photovoltaic solar cells generate electrical output through semiconductor processes when they absorb suitable light. Solar thermal collectors instead aim primarily to capture heat. Both involve sunlight but different conversions.
Learning example. A PV array can generate electricity even on a cool bright day. Its output is not determined solely by the surrounding air’s temperature.
Independent diagnostic. Ask which physical effect and device component turn the incident light into the intended useful output.
5. Semiconductor band structure explains solar conversion
PV cells depend on electronic structure and charge separation. An explanation that panels simply soak up heat misses their physical mechanism and cannot predict voltage behaviour.
Learning example. In a suitable silicon solar cell, light can create charge carriers which are separated and collected by the device’s structure. Real performance also depends on recombination and contacts.
Independent diagnostic. At the student’s level, explain source, semiconductor effect and electrical circuit rather than unsupported numerical quantum claims.
6. Inverter output is not panel DC output
Solar arrays typically generate DC power, whereas many grid connections require appropriate AC conversion through inverters and control systems. Electrical safety and grid connection are professionally regulated tasks.
Learning example. A hypothetical PV panel reports 800 W DC while an inverter provides 740 W AC under its stated test. The difference alone cannot identify every cause of conversion loss.
Independent diagnostic. Use pre-supplied diagrams and data; never open, modify or connect live PV wiring as a school project.
7. Panel orientation and shading affect actual generation
Panel tilt, orientation and nearby shadows influence light received and electrical output. A comparison should avoid changing several geometry and weather variables without recording them.
Learning example. An imaginary panel generates less after a building casts a shadow. That is consistent with shading but the time, irradiance and electrical measurement still matter.
Independent diagnostic. A photograph of a panel cannot establish the percentage energy loss. Ask what paired measurements would verify it.
8. A fair solar test holds meaningful conditions constant
A good educational experiment compares one intended change while controlling panel area, source conditions and measurement method as far as possible. Counted brightness impressions are not calibrated irradiance.
Learning example. Two panels are compared under lamps of different positions and intensities while their angles also differ. A causal conclusion about tilt alone is unsupported.
Independent diagnostic. Ask the student to describe one revised test that isolates the intended factor, without creating electrical hazards.
9. Series and parallel electrical connections have consequences
Series components and parallel branches produce different current-voltage behaviour. In PV engineering, the actual design must consider module ratings, safety, shading, equipment limits and protection.
Learning example. Two illustrative resistors each 10 Ω yield 20 Ω in series and 5 Ω in parallel. The calculation is a circuit learning model, not a real solar string design.
Independent diagnostic. Read circuit nodes rather than relying on visual placement; never apply textbook examples directly to a rooftop array.
10. DC current and voltage are different quantities
Voltage concerns potential difference; current concerns charge flow. A high voltage number alone is not a complete indication of power, energy or system safety.
Learning example. In an ideal simple device P=VI. At 12 V and 2 A, electrical power is 24 W. Without the duration, energy use is unknown.
Independent diagnostic. Require volts, amperes and watts with each numerical answer and state which points and components values refer to.
11. A battery stores energy but does not manufacture it
Electrochemical storage can take electrical energy during charging and deliver electrical energy later, with losses and performance limits. A battery’s existence does not mean sunlight is available at night.
Learning example. A hypothetical battery starts at 4 kWh stored and later delivers 3.5 kWh. The values suggest transfer and losses under the stated boundary, not perpetual energy creation.
Independent diagnostic. Ask the student to distinguish stored energy, power rating and state of charge.
12. Battery capacity and battery power are different specifications
Energy capacity in kWh concerns how much can be stored or delivered under specified conditions, while power in kW concerns rate. Battery discharge duration depends on the operating load and usable capacity.
Learning example. A fictional 10 kWh battery supplying a constant 2 kW ideal load would last five hours under a no-loss assumption. Real systems impose limits.
Independent diagnostic. Ask how the same battery’s duration changes when power demand doubles. The simple model halves the ideal duration.
13. Round-trip storage efficiency requires both energy directions
Charging and discharging involve energy transfers and losses. Round-trip efficiency compares retrieved output with relevant charging input over a defined cycle, not merely the battery’s nameplate energy.
Learning example. If a simulated battery takes 12 kWh to charge and later returns 10 kWh under specified conditions, simple round-trip efficiency is 83.3%.
Independent diagnostic. This example does not certify a real commercial battery or isolate inverter losses without a defined system boundary.
14. Energy storage helps match variable supply to demand
Solar output varies through daylight and weather; demand varies independently. Storage can help handle mismatches and grid stability, but cannot create net energy over time.
Learning example. At noon a fictional array produces more power than a facility needs; excess may charge storage under suitable controls. At night storage can discharge within limits.
Independent diagnostic. Ask what happens when storage is full or empty and why grid management needs more than a simple battery illustration.
15. State of charge is an estimate needing context
A displayed battery percentage is an estimate related to usable energy under a particular battery-management model. It is not a universal claim about battery health or guaranteed running time.
Learning example. Two batteries both display 50% but have different usable capacities. Their stored energy amounts need not be equal.
Independent diagnostic. Ask which model, reference capacity and operating conditions the percentage represents.
16. Battery degradation matters beyond one charging cycle
Battery performance can evolve with cycling, temperature, depth of discharge and design. A high first-cycle value does not establish long-term reliability or safety.
Learning example. Two hypothetical batteries have equal first-day output; one degrades faster over repeated cycles. A meaningful comparison needs controlled cycling data.
Independent diagnostic. Ask for the number of cycles, temperature and usable-capacity definition before claiming one technology lasts longer.
17. Grid frequency and system reliability are operational issues
An electrical grid must balance supply and demand with appropriate frequency and voltage controls. Microgrids add complexity when distributed generation, batteries and conventional networks interact.
Learning example. A child’s model of an isolated lamp is simpler than a real campus system containing multiple sources, inverters, demand and protection.
Independent diagnostic. Teach the concept with an approved block diagram; do not provide operational set points or instructions to modify real grid systems.
18. A microgrid is not a completely separate city grid
A microgrid coordinates distributed energy resources and loads within a defined system. Its relationship with the broader grid and possible operating modes must be specified, not assumed from its name.
Learning example. SIT’s MEMG is a real campus learning resource, but the public announcement does not mean every room operates independently of Singapore’s grid.
Independent diagnostic. Ask what system boundary the simplified microgrid drawing uses and which network connection is shown.
19. Solar intermittency makes forecasting useful
Short-term cloud and irradiance changes can affect PV output. Forecasting may support scheduling and operational decisions, but predictions need uncertainty and cannot guarantee future weather.
Learning example. A fictional solar forecast predicts 30 kWh tomorrow, but actual output is 24. That difference should be recorded, not hidden as a failed experiment.
Independent diagnostic. Ask how forecast error is measured and what operational consequences follow under approved engineering practice.
20. A microgrid sensor is not the whole power system
Smart campuses can measure electricity, occupancy and environmental conditions, but one sensor’s reading cannot represent every generator, load or building.
Learning example. SIT’s published 20,000+ IoT-sensor context is an infrastructure scale, not a claim that all sensors directly measure electrical energy.
Independent diagnostic. Define the sensor type, unit and location before relating it to a building-wide energy number.
21. Data provenance protects living-lab conclusions
Operational research data may require access permissions and documentation. A smooth model curve is not necessarily a measured result from an actual campus.
Learning example. An invented heat-pump energy trace should be labelled simulated when used for teaching. Publishing it as real SIT data would be fabrication.
Independent diagnostic. Ask which sensors produced the results, when they operated and which assumptions were applied in analysis.
22. A digital twin is a model with known gaps
Digital twins can represent selected physical and operational aspects of a system. They need calibration and validation against authorised observations, particularly when new conditions arise.
Learning example. A twin trained on weekday occupancy may perform poorly during holidays. This does not justify silently changing measured data to improve agreement.
Independent diagnostic. Teach model boundaries, error metrics and independent checks before accepting a prediction.
23. Building cooling uses thermal transfer, not ‘cold energy’ as a substance
District cooling circulates chilled water or another medium under engineered conditions to remove heat from buildings. Performance depends on flow, temperature difference and equipment.
Learning example. A hypothetical system supplies chilled water at 7°C and receives it back at 12°C. The five-degree difference alone does not determine cooling energy without flow and other properties.
Independent diagnostic. Ask which quantities are needed for a proper thermal energy balance.
24. Air-conditioning efficiency requires a defined metric
Efficiency in cooling may be represented by energy efficiency ratio, coefficient of performance or other project-specific measures. A headline percentage reduction needs a comparable baseline.
Learning example. A fictional building uses 100 kWh during one cooling period and 85 during a later one. The 15% measured reduction does not automatically prove the chiller caused it if weather changed.
Independent diagnostic. Identify occupancy, temperature and operating conditions before attributing cause.
25. SIT is a university learning site, not a public test facility
The Punggol Campus can inspire students and support authorised projects, but access to operational electrical equipment and restricted data remains controlled.
Learning example. A Punggol parent cannot open a campus battery cabinet or tap sensors merely because the system is described as a living lab.
Independent diagnostic. Use public information, official tours where available, or supplied safe datasets to develop school-level understanding.
26. Singapore’s solar target has a date and unit
EMA’s March 2026 announcement raised the installed-solar target to 3 GWp by 2030. Earlier government pages may still describe the previous 2 GWp target.
Learning example. A student who cites an old target as current makes a dated-source error. The authority and date are part of the factual claim.
Independent diagnostic. Teach checking government announcements against older background pages before publication.
27. Installed capacity is not identical to peak simultaneous generation
Cumulative solar capacity includes equipment ratings across installations. Actual real-time output can differ because sunlight and operations vary.
Learning example. EMA reported 2,339 MWp connected capacity at end-Q2 2026; it does not mean all those systems generated exactly 2,339 MW at every moment.
Independent diagnostic. Ask whether a value is installed capacity, generated energy or instantaneous measured power.
28. Solar contributes within a wider national energy strategy
Singapore’s energy transition uses multiple pathways alongside solar, including power-system resilience and imported low-carbon electricity. Describing solar as the only future supply is inconsistent with official policy.
Learning example. EMA’s 2026 statement notes that land-limited Singapore still expects other low-carbon pathways to be necessary as demand changes.
Independent diagnostic. Explain one benefit and one physical constraint of rooftop PV without treating it as an exhaustive national power plan.
29. Renewable is not synonymous with zero lifecycle impact
Solar electricity generation does not involve combustion at the panel, but manufacturing, land, materials, maintenance and end-of-life treatment can have environmental effects. Claims of overall impact need defined boundaries.
Learning example. Two solar technologies may differ in material composition and supply chain. A label such as green cannot decide which is preferable without a life-cycle comparison.
Independent diagnostic. Ask which stages and measurements were included before accepting an environmental performance claim.
30. A carbon calculation needs a defensible emissions factor
Estimated avoided emissions depend on how electricity is produced in the relevant baseline system and on the calculation’s boundary. A kWh saved cannot be turned into an exact CO₂ number without a suitable factor.
Learning example. An invented assignment provides 100 kWh avoided and a hypothetical factor of 0.4 kg CO₂/kWh, giving 40 kg under that scenario. The factor must not be presented as current Singapore grid data.
Independent diagnostic. Label assumptions and use official current conversion factors when making real-world claims.
31. NUS Engineering Science has relevant energy specialisation
NUS’s Engineering Science Programme includes Energy Science and Technology pathways for specified cohorts, with modules such as Electrical Energy Systems and Renewable Generation and Smart Grid.
Learning example. A student interested in energy modelling should check the actual cohort-specific curriculum, Mathematics requirements and project options.
Independent diagnostic. Do not treat one specialisation listing as a separate full degree available without its home programme conditions.
32. NUS Mechanical Engineering also teaches energy systems
NUS Mechanical Engineering publishes an Energy and Sustainability specialisation including thermal systems, Solar Energy Systems and emerging conversion/storage-related courses.
Learning example. This may appeal to a student who enjoys thermofluids and system design, whereas a Physics major may pursue different energy-related mechanisms.
Independent diagnostic. Compare real modules and entrance requirements, not only the broad word renewable.
33. NTU programmes integrate sustainability with engineering and science
NTU’s AY2026 Biological Sciences with Second Major in Sustainability curriculum includes options such as Power Systems & Conversion, Design of Clean Energy Systems and Power Engineering Design.
Learning example. A listed elective in one programme is not necessarily open or compulsory for every student and not proof that all biological students must learn high-voltage systems.
Independent diagnostic. Ask which requirements and prerequisites apply to the actual matriculation year.
34. Energy industry careers require more than a solar hobby
Energy engineering includes grid design, electrical safety, monitoring, controls, data, project operations and relevant professional requirements. A small school solar kit can reveal principles without certifying workplace competence.
Learning example. A student with interest in batteries should explore electronics and chemistry, while one interested in air-conditioning systems may need thermodynamics and controls.
Independent diagnostic. Choose a degree based on actual disciplinary demands and opportunities rather than presumed employment or guaranteed salary.
35. School experiments should not touch mains or grid connections
Electrical power systems and rooftop PV can be dangerous. Safe school learning should use approved low-voltage educational kits, simulations or instructor-supplied data under appropriate supervision.
Learning example. A child asks to connect a household extension socket to an improvised inverter to test energy flow. That is not an acceptable home Science practical.
Independent diagnostic. Teach using a block diagram of safe simplified components rather than operational wiring instructions.
36. Good conclusions need a stated limitation
An engineering model predicts a result under particular conditions, and measurements can include sensor bias or uncontrolled variables. A true statement about one example may not apply at every scale.
Learning example. A hypothetical panel yields 20% more energy in one week than another. Without normalising for sunlight, the finding does not prove a panel-efficiency improvement.
Independent diagnostic. Ask the learner to separate measured energy change from an efficiency or causal claim.
37. Students can build critical data skills without private access
Many energy concepts can be taught with original hypothetical data or public aggregate statistics. A student does not need a live campus operations account to practise energy arithmetic or graph reasoning.
Learning example. Give time, power and energy columns and ask for a justified total with units and any missing interval values flagged.
Independent diagnostic. A correct result names the source and limitations, not invented precision.
38. Renewable-energy research requires independent validation
A simulated controller may improve performance on historical data but fail when occupancy or solar supply changes. Independent evaluation is needed before deploying it on an operational system.
Learning example. An AI model predicts peak loads correctly during a familiar period but makes errors on a holiday period. The result should motivate validation, not selective omission.
Independent diagnostic. Ask whether training and test periods were genuinely separate and whether the model’s failure cases were documented.
39. The Punggol context should be truthful and specific
The SIT microgrid and district cooling are documented assets. Other photographs of Punggol rooftops or nearby buildings cannot establish their precise electricity production without verified source data.
Learning example. A student labels an invented chart ‘SIT Punggol solar generation today’. If the values are simulated, the graph must say so explicitly.
Independent diagnostic. Treat local relevance as an educational bridge, not permission to fabricate measurements.
40. The transferable lesson is source → conversion → measurement → limits
From Primary light lessons to university microgrid projects, learners should trace where energy originates, how it changes form, what instrument measures it and which conclusions the data support.
Learning example. A child learns solar conversion, a Secondary student calculates circuits, and a university student evaluates system controls. Their vocabularies differ but the need for justified evidence remains.
Independent diagnostic. After feedback, give a different system—battery, chiller or panel—and ask for an independent diagram and a correctly bounded conclusion.
Six original worked energy and measurement problems
A: Power is not energy
A fictional equipment room draws an average of 4.0 kW for 3.5 hours. Electrical energy = 4.0 × 3.5 = 14 kWh. If power varies significantly during the period, a sequence of readings or integration is needed instead of treating one instantaneous number as the average. This is not a claim about any SIT Punggol building.
B: Nominal PV rating and sunlight assumptions
An idealised array of ten panels rated at 400 Wp each has 4.0 kWp of combined nameplate capacity. Multiplying capacity by five hypothetical equivalent full-sun hours suggests an ideal 20 kWh energy figure before losses. The five-hour assumption is supplied for the exercise; it is not a local daily forecast or an actual generation reading.
C: Battery round-trip efficiency
A simulated battery receives 15.0 kWh over charging and later delivers 12.0 kWh under a defined cycle. The measured output-to-input energy ratio is 12/15 = 80%. The system boundary must be stated before comparing with another battery whose inverter or cooling energy may be included differently.
D: Solar capacity versus measured power
An invented site has a PV nameplate of 8 kWp but a measured instantaneous output of 3 kW at a particular time. Its output relative to nameplate is 3/8 = 37.5% for that moment. The number should not be called daily conversion efficiency or annual capacity factor without the appropriate time and irradiance data.
E: Electricity reduction and causal limits
A fictional facility reports 240 kWh in Week A and 204 kWh in Week B. The observed reduction is 36 kWh, or 15% relative to Week A. Without controlling for weather, occupancy and operating conditions, the result cannot establish that a newly installed control system caused all of the reduction.
F: Cooling-energy inference
In a hypothetical district-cooling dataset, a fluid enters at 7°C and leaves at 12°C. Its temperature rise is 5°C. The energy transferred cannot be calculated from temperature difference alone: flow rate, fluid amount and relevant heat capacity must also be known. The example is not measured SIT infrastructure data.
A five-week renewable-energy Science learning map
| Week | Work | Independent result |
|---|---|---|
| 1 | Read the latest EMA 2026 solar target and distinguish Wp, W and kWh. | Source-dated facts and correct unit interpretation. |
| 2 | Repair light, circuits, power and energy conversions. | Correct numerical answers and stated assumptions. |
| 3 | Compare PV modules, batteries and a simple microgrid schematic. | Source–conversion–storage–load diagram. |
| 4 | Interpret fictional sensors, cooling and load data honestly. | Observation, model, uncertainty and limitation separated. |
| 5 | Compare SIT, NUS and NTU programme requirements and project pathways. | Current-year sourced options without assumed campus data access. |
Frequently asked questions
What is Singapore’s latest 2030 solar target in October 2026?
EMA announced 3 GWp by 2030 on 2 March 2026, increasing the previous 2 GWp target.
How much connected solar capacity did EMA report by Q2 2026?
EMA’s published figure was 2,339 MWp at the end of Q2 2026.
Does SIT Punggol have a multi-energy microgrid?
Yes. SIT’s official campus and living-lab pages describe its multi-energy microgrid and associated research/teaching infrastructure.
Can Punggol residents access the microgrid’s controls?
No unrestricted access should be assumed. Operational equipment and data are governed by SIT’s access, safety and project rules.
Is GWp a measure of generated energy?
No. GWp represents installed peak-rated PV power capacity under defined rating conditions, not a day’s kWh.
Can a battery create electricity without prior energy input?
It can deliver stored electrochemical energy after charging or other chemical energy inputs, not create energy from nothing.
Does solar produce the same output on every bright day?
No. Irradiance, shading, temperature, panel geometry and systems affect output.
Is district cooling a kind of solar panel?
No. It is a thermal energy transfer system, although it can be integrated with broader energy planning.
Does NUS teach renewable-energy engineering?
NUS publishes Energy Science and Technology in Engineering Science and energy-related Mechanical Engineering courses, subject to cohort rules.
Does NTU have sustainability-linked energy courses?
NTU’s AY2026 programme pages include energy and power-system related electives; actual availability depends on the student’s degree.
Can children connect a solar array to household mains for an experiment?
No. Use supervised low-voltage education kits or supplied data; electrical grid connections require qualified professionals.
Do solar panels mean Singapore will need no other power source?
No. EMA’s official transition strategy accounts for solar limits and diversified low-carbon pathways.
What is the single best problem to assess energy reasoning?
Ask the student to identify source, power, time, energy, a relevant control and one limitation in an unfamiliar system.
Why the updated 2026 solar target matters to Science education
A school article that quotes Singapore’s earlier 2 GWp-by-2030 target without the publication date risks teaching out-of-date information. EMA announced on 2 March 2026 that the national target is 3 GWp by 2030, after the country reached the earlier 2 GWp level in 2025. That change supplies a valuable exercise in scientific source evaluation. A target is a planned capacity outcome, not a realised energy yield. Installed peak capacity is also not the same as measured instantaneous generation because real sunlight and the electrical system vary through time.
Give the learner two dated government statements and ask which is newer, which unit each uses and what each actually claims. Then ask why a solar installation with a given nameplate rating does not necessarily supply that power at every moment. This exercise combines source checking, units and physical reasoning. It prevents a polished-looking historical statistic from being repeated as a current fact, while preserving the value of the older announcement for understanding how policy evolved.
How to teach an energy balance without industrial equipment
An energy balance begins by defining the system, the sources and the destination of transferred energy. At a very simple level, a battery receives electrical input while charging and delivers electrical output while discharging. At a larger level, a building uses power for cooling, lights and other loads while also potentially receiving distributed solar energy. These situations share a conservation principle but require different variables, measurements and control strategies. A good educational model should not pretend that all losses can be calculated from a photograph of a rooftop.
Create a hypothetical hourly table with solar production, facility load, charging and grid exchange in kilowatt-hours. Ask the pupil to state whether the chosen hour has a deficit or surplus under explicit simplified assumptions. Then provide a new interval with different numbers and ask why the result changes. If a column lacks data, do not invent it silently. The purpose is to reason about a system boundary, not to reproduce or modify a live operational grid.
A controlled comparison of solar efficiency and useful energy
Efficiency compares a defined useful output with a relevant measured input. For photovoltaics, incident solar power on the active panel area matters when calculating a conversion ratio. A panel’s peak-rated capacity and the sunlight recorded at a different time are not enough for a credible real-world efficiency calculation. Temperature, spectral conditions, shading, inverter boundaries and measurement uncertainty can affect the result. A student should first know whether the question concerns module conversion, inverter conversion, battery cycle performance or the whole energy system.
Suppose an idealised teaching panel receives 500 W of incident optical power under defined conditions and delivers 90 W of electrical power at its measured terminals. Simple conversion ratio is 90/500 = 18%. This is an illustrative exercise, not a manufacturer’s rating or a campus test. If the reading instead measured inverter AC output, the system boundary would differ. A well-designed answer names the actual input and output points before calculating, and it does not treat that value as guaranteed daily performance.
Distinguishing a smart-grid model from a renewable-energy guarantee
Sensors, forecasting algorithms and smart controls can help energy systems operate efficiently, but they do not remove the physical variability of solar input or storage limits. A model that predicts strong performance on normal weekdays may fail during unusual occupancy, equipment maintenance or changing weather. Testing only the same conditions used to tune a model can overstate its reliability. An ethical energy-data project distinguishes training and validation records, identifies the actual sensor sources and communicates forecast error rather than hiding disappointing periods.
The SIT Punggol microgrid and living-lab descriptions offer a real institutional context for these concepts without requiring the public to access restricted readings. A student may analyse fictional load curves and practise the same logic, clearly labelling simulated data. The final question should be: What did the model predict, what was observed, which conditions changed and what would strengthen the next test? This makes the study rigorous instead of using technology or sustainability labels as substitutes for evidence.
A parent-facing decision map from Secondary Science to energy degrees
A student who likes energy problems can explore different academic routes. Physics may deepen electronic, thermal and mathematical models; Electrical Engineering can focus on circuits, power systems and control; Mechanical Engineering may emphasise thermal processes and machines; Materials Science can focus on PV or battery components; and sustainable engineering programmes may integrate environmental impacts. These are overlapping but not identical qualifications. The practical decision should begin with actual modules and prerequisites for the student’s intake rather than a claim that any ‘green degree’ guarantees a job.
Families can make a two-page record: which current school concept the learner explains accurately, which university module would extend it and what mathematics or laboratory ability needs strengthening. Ask the child to complete one independent electricity-energy calculation and one fair-test reasoning question. Then compare NUS, NTU and SIT’s actual courses and workload. The result is not a final career verdict; it is a current, evidence-based next step that can evolve as interests and results change.
Official government and university evidence
- EMA — March 2026 announcement raising 2030 solar target to 3 GWp
- EMA — Q2 2026 installed grid-connected PV capacity
- EMA — Solar energy and intermittency
- SIT Punggol Campus — MEMG, PV and district cooling
- SIT Campus as a Living Lab — approved energy-data learning
- SIT — 2026 sustainability and microgrid applied learning
- NUS Engineering Science — Energy Science and Technology
- NUS Mechanical Engineering energy/sustainability courses
- NTU AY2026 sustainability curriculum and energy electives
- eduKatePunggol Materials Science and Nanotechnology
- eduKatePunggol comparison of energy resources
- eduKatePunggol solar conversion worked Science
- eduKatePunggol SIT applied Science and IWSP
- eduKatePunggol Digital District cooling and smart grid
- eduKatePunggol Primary 4 Heat and Light
- eduKatePunggol JC H2 Physics 9478
- eduKatePunggol university Science programmes
Fact-check date: 21 October 2026. The national solar target and installed capacity come from updated EMA 2026 statements; older 2-GWp-target pages are not treated as current. SIT and university references are provider specific. Every numerical example is fictional unless explicitly attributed, and no operational microgrid access, safety certification or admission result is promised.
Clementi-level learning check: independence rather than worksheet volume
A parent can tell whether the student really understands energy by changing the context. If a child correctly multiplies solar power by time, ask them to do the same with an appliance, then explain why a storage device’s capacity is different. If the child confuses a temperature change with an energy transfer, return to fluid flow and heat capacity rather than adding arbitrary arithmetic. The first mistaken model must be repaired before faster calculations are useful.
Good explanations are short when the evidence is simple and longer when the system is complex. A small teaching group may allow the tutor to inspect each child’s error, but the useful standard is that the pupil can explain the conversion, use the proper units and state a defensible limitation in a new question without hints.


