
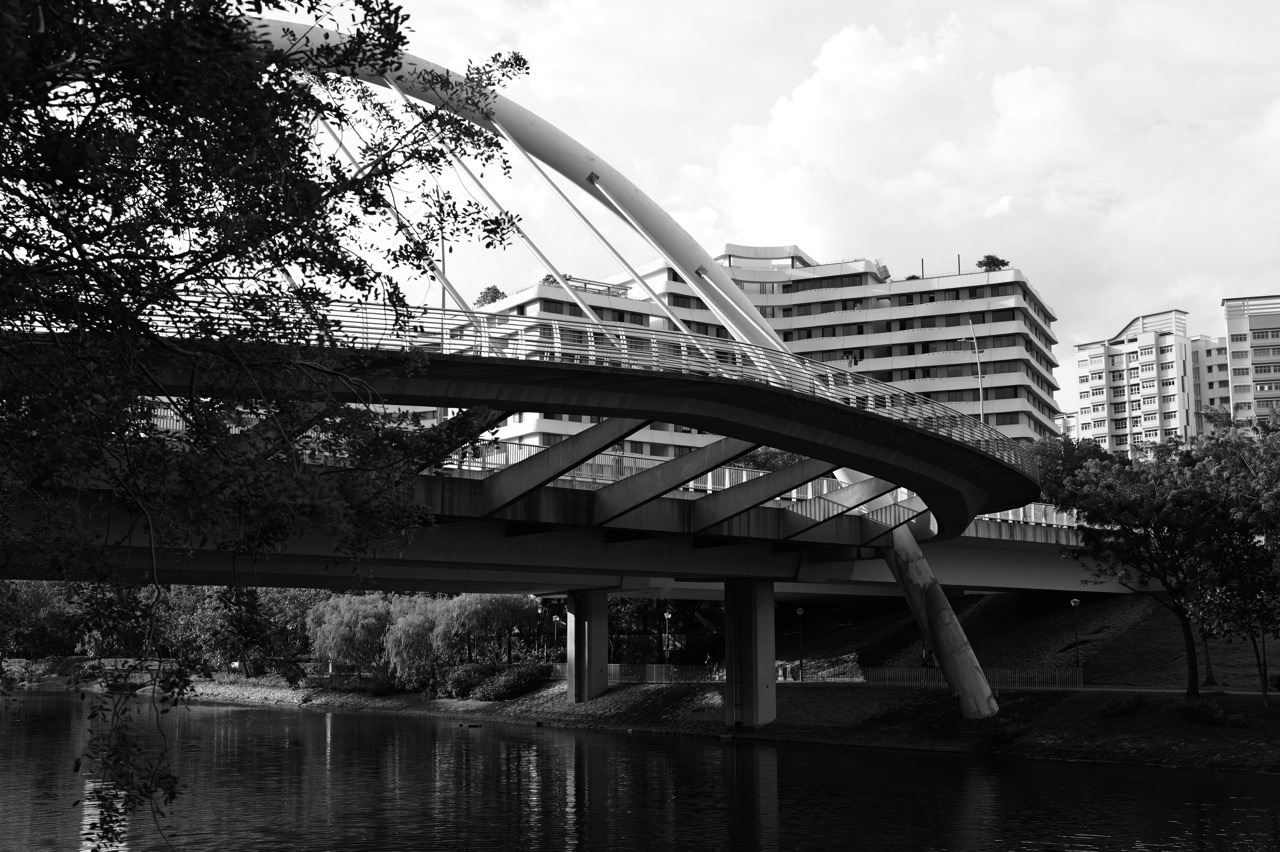
The top 10 things to do in Punggol for Physics students are to study reflections beneath Waterway Park bridges, observe naturally occurring water ripples, test folded paper bridge beams, explore average speed and displacement on a short connector walk, model train acceleration using the Punggol–Punggol Coast rail context, investigate shadow geometry, compare shading and thermal comfort, test rolling resistance with a toy at home, explore acoustic design differences and interpret JTC’s Punggol Digital District solar-energy expectations.
Best starting activity: choose one safe public view of a Punggol Waterway Park bridge. Sketch its reflection and discuss what the eye can actually see. If a model is more useful, return home and compare a flat and folded paper beam under small identical loads. A Physics trail does not require instruments placed in public paths, electrical experiments, a real train timing study or access to infrastructure.
This October 2026 guide separates official site facts from controlled school models and personal observations. Every calculated number is identified as hypothetical unless it comes from an attributable official publication. Punggol’s rail, waterway, buildings and public spaces are excellent contexts for force, energy, motion and light, but interesting surroundings do not permit unsafe or unsupported measurement.
Choose the Physics topic that fits your level
- Primary learners: shadows, reflections, sound, motion and simple fair tests with adult supervision.
- Secondary 1–2: speed, distance, displacement, forces, density concepts and wave properties using defined variables.
- Upper Secondary: velocity-time graphs, acceleration, energy units, light-ray diagrams, reflection and meaningful uncertainty.
- Advanced students: static beam models, heat transfer, solar-energy estimates and the difference between model assumptions and measured performance.
- Outdoor-only observation: a short public waterway viewpoint is enough; do not treat a nature walk as an engineering survey.
- Indoor-only option: paper bridge, toy rolling, artificial-light shadow model or rail motion graph.
A Physics model is useful when its assumptions are visible
Many Physics errors begin before any equation is used. A learner chooses speed when the question asks for velocity, uses centimetres in an equation requiring metres, or quotes an energy estimate as instantaneous power. The repair is to name the physical quantity, specify units, identify what was observed and write down assumptions. A reliable worked example begins with a diagram or verbal model rather than immediately substituting numbers.
Physics is also a discipline of controlled comparisons. If one paper beam is wider, uses stronger paper and has a different span, comparing its maximum load with another cannot isolate the effect of the fold. If two outdoor surfaces are measured hours apart, the difference cannot be credited solely to shade. If a student’s train profile uses constant acceleration, that is a modelling assumption, not a secret observation of the real transport operator’s motors.
Punggol offers varied real settings, but the safest work often happens on paper or at home after observation. Park paths are shared infrastructure, waterways are not open laboratories and building electrical systems are not public learning stations. Good students know when to stop at a clearly labelled model and what additional data a professional would need.
Ten Punggol Physics activities with worked explanations
1. Compare light reflections beneath a Punggol Waterway bridge
Where: Public viewpoints along Punggol Waterway Park, including bridge reflections where visible.
The Physics principle
Light reflected from water makes the familiar world of Punggol useful for introductory optics. A calm surface may produce a relatively recognisable mirror-like image, while a rippled surface scatters the apparent reflection in different directions. A learner can explore the idea that the angle of incidence equals the angle of reflection for ideal specular reflection at an individual smooth surface. The visible shape of a whole bridge in water is not itself a calibrated experiment proving the microscopic law.
How to investigate safely
Choose a safe public viewpoint with a bridge and any visible reflection. Describe where the reflected bridge appears relative to the actual structure. If ripples change, note the change without entering the water or throwing objects. Later draw a flat horizontal reflecting surface and a single light ray, measuring incidence and reflection angles from a normal line in your paper diagram. Keep real observation and classroom optics construction labelled separately.
Original worked example
Illustrative ray diagram: a ray meets a horizontal mirror at an incidence angle of 35° from the normal. For specular reflection, the reflected ray also makes 35° with that normal, so the angle between incident and outgoing rays is 70°. These figures describe the hypothetical diagram, not an actual measured ray at Punggol Waterway Park. The student’s common mistake is to measure 35° from the mirror surface rather than the normal.
The next question
Compare two original photos taken from the same safe point when the surface is relatively calm and more rippled, if conditions naturally allow. Explain how local surface orientations change which rays reach the eye. Discuss why a photograph also depends on camera position and exposure, so differences cannot be attributed solely to the water unless other factors are controlled.
Safety and accuracy boundaries
Never use a laser pointer toward people, transport, windows or public spaces. Do not lean over rails, touch water or attempt a staged splash. Children should remain safely on public paths.
Official reference: Compare light reflections beneath a Punggol Waterway bridge. Verify the current status of any site you plan to visit.
2. Read ripples as wave motion without confusing them with water transport
Where: Safe Waterway Park or Punggol Point public viewpoints.
The Physics principle
A water wave is a useful classroom model for energy transfer and oscillation. Surface patterns move, but that does not mean every parcel of water travels the full path with the visible crest. Wind, boats or other disturbances can produce ripples, yet a casual visitor cannot prove the cause from a few waves alone. The important physics is distinguishing an observed crest pattern from a statement about the motion of the medium.
How to investigate safely
At an authorised public viewpoint, watch an existing ripple pattern rather than creating one. Record its apparent direction, spacing and whether its pattern changes near a bank or solid boundary. Then return to a safe desk demonstration using a slinky or a paper series of crest positions to discuss wavelength and frequency. If a school uses a ripple tank, the experiment belongs under trained laboratory supervision, not at the reservoir.
Original worked example
Fictional wave worksheet: a model has a wavelength of 0.25m and frequency 2Hz. Using speed = frequency × wavelength, the model speed is 0.50m/s. It does not establish the speed of observed Punggol water ripples, which were not measured. A learner who multiplies 2 by 25 and reports 50m/s has mixed metres and centimetres; the correct first step is converting the length.
The next question
Consider reflection of waves at a boundary and how a wavefront may change in shallow water. Ask what information would be required for a meaningful measured value: calibrated distance, time or frequency, viewpoint and uncertainty. A rough observation may be enough to pose a question without producing a numerical result.
Safety and accuracy boundaries
Do not drop stones or objects into public waters, use boats without authorised supervision or attempt to create waves near other users. Punggol’s waterfronts have separate access and safety rules.
Official reference: Read ripples as wave motion without confusing them with water transport. Verify the current status of any site you plan to visit.
3. Investigate bridge shapes with a small paper-load experiment
Where: NParks-described Jewel, Wave, Sunrise and Kelong bridges as inspiration; model built at home.
The Physics principle
Punggol Waterway Park has several named bridges with different appearances. Public infrastructure illustrates the need to manage load and bending, but a bridge’s engineering cannot be reverse-engineered reliably from a photograph. A safe paper experiment can help students see how folding changes structural behaviour under a small test load. Its result applies to the model under stated conditions, not to the actual bridge’s carrying capacity.
How to investigate safely
Observe or read about one bridge using NParks’ current guidance. At home, place two identical sturdy books a fixed distance apart. Make one flat paper strip and one folded strip from the same paper type and size, spanning the gap. Place identical small counters near the centre one at a time while an adult supervises. Record the point at which significant visible bending begins, and repeat where practical. Keep the load tiny and far from electrical equipment, glass or anything fragile.
Original worked example
Illustrative test: a flat paper beam bends noticeably at two small counters, while a folded channel shape remains usable up to five in the same setup. The narrow conclusion is that the folded version resisted bending better with these supports and loads. It does not show that every folded structure is stronger in every orientation, or that a real Punggol bridge could be designed without professional calculations.
The next question
Draw a free-body diagram for an idealised simply supported beam and identify the load and support reactions qualitatively. For a symmetric central load W on ideal supports, each support carries W/2 in the simple static model. Real-world structures may be far more complex, and a student should not treat the simplified diagram as a design certificate.
Safety and accuracy boundaries
Do not attach weights to public rails, measure bridges while blocking paths or climb for a closer inspection. The demonstration is strictly a safe small desk model, with a clear statement of limitations.
Official reference: Investigate bridge shapes with a small paper-load experiment. Verify the current status of any site you plan to visit.
4. Time a short comfortable walk to understand average speed
Where: A suitable out-and-back part of Punggol Waterway Park Connector.
The Physics principle
NParks lists the Punggol Waterway Park Connector as 8.4km, while the park nature-walk guide describes a separate 4.2km route. Physics students should start by naming the exact route rather than combining published distances. A self-selected short path segment permits speed and displacement discussions without turning a public park into a racecourse.
How to investigate safely
Choose a familiar public part of the connector where travel is appropriate for the whole family. Use a map-estimated distance or another safe accepted measure and label its precision. Note elapsed time at a comfortable walking pace, including any stops if calculating trip-average speed. Use the same route for a return if conditions suit. Write both distance travelled and displacement: a return to the exact starting point can produce zero net displacement even though total path length is not zero.
Original worked example
Fictional trip: a walker moves 300m outward and 300m back to the start in ten minutes, including a rest. Total distance is 600m, which over 600 seconds gives average speed of 1m/s. Net displacement is zero, so the magnitude of average velocity across the full trip is zero in the simplified position model. Speed and velocity are not the same quantity.
The next question
Draw a displacement–time sketch for the outward and return legs, showing the moment of pause. Then ask whether the average speed would change if the total distance remained 600m but the elapsed time increased. This reveals the role of the denominator without pressuring students to walk faster.
Safety and accuracy boundaries
Keep the activity untimed when timing would make a learner anxious or interfere with safety. Never sprint on shared pedestrian and cycling paths or obstruct other users for a demonstration.
Official reference: Time a short comfortable walk to understand average speed. Verify the current status of any site you plan to visit.
5. Use the Punggol MRT–Punggol Coast journey to model acceleration
Where: Punggol MRT (NE17), Punggol Coast MRT (NE18) and official North East Line information.
The Physics principle
LTA confirms Punggol Coast opened on 10 December 2024 as the North East Line terminal beyond Punggol. Rail is a familiar setting for motion physics, particularly the distinction among displacement, speed, acceleration and braking. However, actual acceleration profiles depend on train and operational conditions; passengers cannot accurately infer the motor’s output or acceleration graph just from a timetable.
How to investigate safely
Use LTA’s current rail map to identify the genuine stations. Build a fictitious motion graph for a train that starts from rest, accelerates uniformly, travels at a steady speed and then slows to a stop. Label axes and assumed values. If travelling, obey transport rules and simply notice the sensation of starting and stopping, without conducting equipment or platform experiments. Keep real service facts separate from the invented physics motion profile.
Original worked example
Illustrative first segment: a fictional train changes velocity from 0 to 8m/s in 10 seconds under assumed uniform acceleration. Acceleration = (8 − 0)/10 = 0.8m/s². Its displacement over that assumed accelerating interval would be average velocity 4m/s × 10s = 40m. Neither figure is an observation about the real North East Line service.
The next question
Ask why a train might not accelerate uniformly for the entire trip and why a single average across a station-to-station journey cannot reveal peak acceleration. Students may sketch velocity–time area for displacement, identifying what is directly specified and what must be assumed.
Safety and accuracy boundaries
Do not time acceleration by moving around a carriage, leaning near doors or filming people without permission. Public transport is a real service; use fictional numbers for classroom physics calculations.
Official reference: Use the Punggol MRT–Punggol Coast journey to model acceleration. Verify the current status of any site you plan to visit.
6. Test shadow geometry inspired by Punggol Digital District’s passive design
Where: Public views of Punggol Digital District; a small model indoors at home.
The Physics principle
JTC describes passive design used to shape buildings for natural light, solar heat reduction and airflow. A shaded public walkway gives students a real reason to think about how light travels, but a visible shadow is not evidence of a numerical reduction in air-conditioning energy. Shadow length depends on light angle, object height and geometry. A small safe model isolates those ideas without accessing a private building or rooftop.
How to investigate safely
Observe a permitted shaded space near Punggol Coast MRT when weather allows. Draw the overhang and shadow qualitatively; do not climb to measure it. At home use a cardboard wall, a cardboard awning and a cool low-power battery light, holding the light position steady while changing only the awning depth. Trace the shadow position on a marked paper surface and record dimensions in centimetres. Never aim bright light into eyes.
Original worked example
Illustrative right-triangle model: a vertical stick is 0.5m tall and casts a 0.5m horizontal shadow. In the simplified situation, tangent of the elevation angle equals 0.5/0.5 = 1, corresponding to 45°. This does not prove the Sun had elevation 45° at a specific Punggol location or that a real roof overhang follows the toy model.
The next question
Discuss why an actual energy analysis would need facade orientation, materials, sun position over time, ventilation and measured electricity consumption. Compare the same model at two controlled artificial-light angles. Older students can calculate idealised triangles while clearly separating them from building simulation.
Safety and accuracy boundaries
NEA advises sun protection, particularly around 11am–3pm when UV exposure tends to be high. Do not stare at the sun, use magnifying glasses to concentrate sunlight, climb buildings or encourage exposure for measurements.
Official reference: Test shadow geometry inspired by Punggol Digital District’s passive design. Verify the current status of any site you plan to visit.
7. Compare shade and thermal comfort without inventing an urban heat result
Where: A shaded public park bench and a sun-exposed public viewpoint, observed safely and briefly.
The Physics principle
Thermal sensation depends on air temperature, radiation, humidity, wind, clothing and activity. A person reporting that one bench ‘feels cooler’ has given a personal observation, not a calibrated measurement of a town’s urban heat island. The lesson is to distinguish temperature from heat transfer and to recognise the roles of shading and moving air. JTC’s passive design descriptions offer a useful local link, while NEA’s weather and UV guidance informs safe timing.
How to investigate safely
During a normal suitable outing, note that shade may feel more comfortable. Do not remain in strong heat to create an experiment. At home compare two identical model surfaces under a safe cool light, with one shaded by cardboard and the other exposed, if appropriate for your equipment and age. Use a suitable measuring instrument only if it can be placed safely and results are recorded with uncertainty. If no instrument is available, discuss qualitative radiation and conduction rather than presenting invented temperatures.
Original worked example
Fictional laboratory readings: Surface A is measured at 32.0°C and Surface B at 30.5°C under assumed comparable conditions. The difference is 1.5°C. This says nothing about the actual temperatures at Waterway Park because those values were never observed there. It also does not by itself quantify energy savings or a person’s heat-stress risk.
The next question
Ask which variables could produce a misleading comparison: changing wind, cloud cover, surface colour and measurement time. A careful experimental plan should measure those or acknowledge them. Differentiate solar radiation from ambient air temperature and from surface temperature on a bench.
Safety and accuracy boundaries
Do not ask people, especially children or vulnerable individuals, to stand in uncomfortable heat for science. Follow current NEA UV and heat advisories and choose indoor study during unsuitable conditions.
Official reference: Compare shade and thermal comfort without inventing an urban heat result. Verify the current status of any site you plan to visit.
8. Model rolling resistance and friction with a toy, not a shared cycling path
Where: At home after observing lawful cycling routes around Punggol Waterway Park.
The Physics principle
Public park connectors carry pedestrians and cyclists and make it clear that wheels, road surfaces and movement must coexist safely. Physics students can explore how a toy moves on different surfaces without interfering with real cycling. Rolling resistance, sliding friction and air resistance are distinct processes. A casual slow roll does not identify a material’s exact coefficient of friction or certify a route’s safety for cyclists.
How to investigate safely
Use a small non-motorised toy car and a sturdy shallow ramp at home on a stable floor. Test on two safe flat surfaces such as a sheet of paper and a piece of felt, using the same ramp height and release position. Record approximate travel distance over the horizontal test surface. Keep the surface clear, and use a stop block to prevent the toy falling or hitting anyone. Repeat several times and compute an average if measurements are consistent.
Original worked example
Hypothetical measurements: the toy travels 60, 58 and 62cm on one surface, giving a mean of 60cm. On felt it travels 41, 43 and 42cm, giving a mean of 42cm. The observations suggest different resistance under that setup, but do not yield a coefficient of friction without a more sophisticated model. A child who reports ‘felt coefficient = 0.42’ from the distance alone has made an unsupported inference.
The next question
Explore how varying only the ramp height changes entry speed and why a toy wheel’s bearing resistance can affect a test. Distinguish a controlled desk model from road safety rules for actual bicycles and active mobility devices. Explain why a more repeatable test is often more informative than a dramatic fast roll.
Safety and accuracy boundaries
Never set up ramps, markers or timing gates on a real public cycling path. Do not race bikes or obstruct other park users for a school project.
Official reference: Model rolling resistance and friction with a toy, not a shared cycling path. Verify the current status of any site you plan to visit.
9. Investigate sound, reverberation and measurement limits in public spaces
Where: Publicly open parts of One Punggol and Waterway Point, without disturbing visitors.
The Physics principle
A library, food centre and public walkway can sound very different even when they are within the same neighbourhood. Acoustics studies reflection, absorption and propagation of sound. A quiet reading area has different design goals from a lively communal dining space. A visitor can describe the qualitative difference but should not claim a precise decibel reading or a safe hearing exposure limit from a phone app that has not been calibrated.
How to investigate safely
During ordinary permitted visits, listen without creating any sound of your own. Make a short note of whether voices sound muffled, echoing, distant or readily intelligible, and record the type of space. If using an uncalibrated phone recording app for classroom interest, label its output as approximate or non-authoritative, and avoid recording identifiable conversations. A paper exercise can illustrate how echoes occur when sound travels to a reflecting surface and returns.
Original worked example
Fictional echo calculation: a sound travels to a flat reflecting wall 17m away and returns, covering about 34m. Using an assumed sound speed of 340m/s, the round trip would take 0.10s. This is a simplified model and not a measurement of any actual One Punggol wall or room. The calculation requires twice the wall distance, a step learners often miss.
The next question
Ask why a carpeted small room and a hard-surfaced corridor might differ in reverberation and why human perception depends on background noise. Avoid promising the same acoustic experience for someone with hearing impairment. A formal acoustic survey would require calibrated instruments and consent when recording.
Safety and accuracy boundaries
Do not shout, play loud tones, test alarms, record private conversations or obstruct a library. Respect current venue rules and hearing safety.
Official reference: Investigate sound, reverberation and measurement limits in public spaces. Verify the current status of any site you plan to visit.
10. Read JTC’s solar and smart-grid figures as energy data, not an observed electricity bill
Where: Public Punggol Digital District surroundings and JTC’s published sustainability information.
The Physics principle
JTC states that Punggol Digital District’s rooftop solar is expected to produce about 3,000MWh annually and describes a district-level smart grid integrating solar and battery storage. These are official descriptions and expectations, not a live meter visible to a passer-by. Physics students can use the energy unit, time scale and relationship between power and energy to understand the system without entering any technical or private space.
How to investigate safely
Read JTC’s sustainability page and write the unit MWh alongside its full meaning, megawatt-hour. Convert 3,000MWh to 3,000,000kWh in an arithmetic exercise. Then distinguish that annual energy estimate from power measured in kW at an instant. Sketch an idealised system showing solar generation, battery storage, building demand and the grid; label which functions JTC documents and which elements you have drawn conceptually.
Original worked example
Illustrative allocation: if an expected 3,000,000kWh of annual energy were divided evenly across 365 days, the mathematical daily average would be about 8,219kWh/day. Actual daily solar production will vary with weather and system operation. This average is not a statement that the district delivers 8,219kWh every day or that the amount is available to a particular household.
The next question
Use a fictional 1kW device running for 2 hours to show energy = 1kW × 2h = 2kWh. Ask why stored battery energy, solar generation and instantaneous electrical power are related but not interchangeable. Discuss why a carbon-emission estimate requires additional assumptions and why reported expected annual generation is not proof of measured real-year performance.
Safety and accuracy boundaries
No unauthorised access to rooftop solar panels, battery rooms, campus laboratories or electrical infrastructure. Electrical experiments involving mains or batteries should be supervised by qualified personnel; this activity is source analysis and paper modelling.
Official reference: Read JTC’s solar and smart-grid figures as energy data, not an observed electricity bill. Verify the current status of any site you plan to visit.
Three good learning sessions for a Punggol Physics notebook
Session one: observe a waterway and draw a correct diagram
Choose one bridge or water surface at a safe public Punggol Waterway Park viewpoint. Sketch a ray diagram or outline visible waves in an observational notebook. Spend more time labelling axes, a surface normal or a wavefront than trying to collect many photographs. At home, add one controlled numerical example with explicitly invented measurements. Explain why the calculation is not a measured result from the park.
Session two: run one desk experiment
Set up a harmless paper beam or toy-car roll, choose a single variable and keep the rest as stable as practical. Write expected behaviour before testing, repeat trials and use units. If results disagree, record the disagreement and investigate the first likely source of uncertainty. A failed or unexpected trial is still useful when its conditions and limitations are described accurately. Do not increase loads or speeds to dangerous levels for dramatic evidence.
Session three: interpret a real engineering publication
Read JTC’s Punggol Digital District sustainability page and LTA’s Punggol Coast opening notice. Separate official opening or expected generation facts from your own paper calculations. Convert MWh to kWh, discuss why solar generation varies and sketch a hypothetical velocity–time graph. This is valuable applied Physics even when no instrumentation or campus access is available.
Correct three common mathematical errors
Speed versus average velocity: a person returning to the original position has nonzero distance but zero net displacement. The ratio of path length to time can therefore be nonzero even when displacement divided by elapsed time is zero. Students should not treat velocity and speed as synonyms simply because both involve distance-like quantities.
Watts versus watt-hours: a watt is a power unit. Energy is measured in joules or watt-hours, among other units. If a fictional 500W device operates for 3 hours, its energy consumption is 1,500Wh or 1.5kWh. It does not have a ‘power of 1.5kWh’. JTC’s annual solar-generation projection uses an energy unit, which must not be presented as instantaneous power.
Actual place versus idealised geometry: a 45° angle in a student’s drawing can teach trigonometry even if no real roof or shadow has that angle. A model is useful because it isolates a relationship; it becomes misleading when its assumed dimensions are silently assigned to real public infrastructure.
Ten ways to keep a Punggol Physics project honest
- Name the official source for a route, station or district feature before using it as context.
- Label all invented measurement values as illustrative or hypothetical.
- Use the correct unit and show conversions before substitution.
- Keep a physical observation separate from an explanation of its cause.
- Do not conduct timed races or experiments on busy public paths.
- Never use lasers, concentrated sunlight or exposed electrical equipment in an outing.
- Keep water wave observations on land; do not enter or disturb a reservoir.
- Do not infer structural safety from the strength of a paper model.
- Record uncertainty, repeat trials when safe and identify one confounding variable.
- End with a conclusion limited to the evidence the learner actually gathered.
Frequently asked questions
What are good Physics activities in Punggol?
Bridge reflections, small wave observations, shadow models, average-speed problems, safe paper-beam tests and analysis of JTC solar-energy information.
Can I measure the angle of a real Punggol bridge from a photograph?
Not reliably without a suitable geometric survey and perspective correction. Use a labelled hypothetical diagram to teach angles.
What is the law of reflection?
For specular reflection, the angle of incidence equals the angle of reflection, both measured from the normal to the reflecting surface.
Can I make waves by throwing stones into the waterway?
Do not disturb public water or create hazards. Observe naturally occurring patterns and use classroom models instead.
What formula links wave speed, frequency and wavelength?
For a suitable wave model, speed equals frequency multiplied by wavelength: v = fλ.
Can I test the strength of a public bridge?
No. Build a small harmless model and state that its behaviour does not certify a real structure.
What is the difference between distance and displacement?
Distance is total path length; displacement is the change in position with direction between start and finish.
Is Punggol Waterway Park Connector 4.2km?
NParks lists the named connector as 8.4km, and separately describes a 4.2km nature walk at the park.
Can I use the Punggol Coast train to measure acceleration?
Use a fictional motion model for calculations. Do not interfere with passengers or assume a train’s true acceleration profile from timing alone.
When did Punggol Coast MRT open?
LTA opened the station for passenger service in December 2024.
What is acceleration?
Rate of change of velocity over time; it can describe speeding up, slowing down or changing direction.
Why do two outdoor spots feel different in heat?
Sunlight, wind, humidity, clothing and surfaces all affect thermal comfort, not just a single air-temperature number.
Is a shadow enough to prove building energy savings?
No. Performance requires suitable environmental and energy measurements and a defined comparison.
Should children look directly at the sun for a shadow task?
No. Use safe indirect observation or a low-power artificial-light model, and follow sun-protection advice.
Can a mobile phone make laboratory-grade sound measurements?
Not necessarily. Without calibration, app readings should not be presented as authoritative decibel surveys.
What solar output does JTC expect in Punggol Digital District?
JTC estimates rooftop solar generation of about 3,000MWh annually, a projection rather than a visitor-measured result.
What is the difference between kW and kWh?
kW measures power, while kWh measures energy transferred or used over time.
Do Physics models have to give perfect results?
No. Clearly documented deviations, uncertainty and repeatable comparisons can improve understanding.
How long should a local Physics outing be?
One short public viewpoint followed by a safe indoor model can be enough; no full route must be completed.
Can this guide replace professional electrical or structural advice?
No. It is educational and does not authorise work on real infrastructure.
Official sources and related Punggol learning
- Compare light reflections beneath a Punggol Waterway bridge
- Read ripples as wave motion without confusing them with water transport
- Investigate bridge shapes with a small paper-load experiment
- Time a short comfortable walk to understand average speed
- Use the Punggol MRT–Punggol Coast journey to model acceleration
- Test shadow geometry inspired by Punggol Digital District’s passive design
- Compare shade and thermal comfort without inventing an urban heat result
- Model rolling resistance and friction with a toy, not a shared cycling path
- Investigate sound, reverberation and measurement limits in public spaces
- Read JTC’s solar and smart-grid figures as energy data, not an observed electricity bill
- NEA UV and sun-safety guidance
- Punggol mathematics trail and worked unit checks
- Punggol making and safe prototype experiments
- Punggol Chemistry and environmental evidence
- eduKateSG learning and worked-example reference
One careful model creates more understanding than ten guesses
Begin with a real question about light, motion, waves, heat or energy. Observe from a safe Punggol location or read the official information, then construct a model whose assumptions you can state. Calculate carefully, test what can safely be tested and say what remains unknown. Physics becomes useful when it improves how you interpret the world rather than encouraging you to claim measurements you never made.


