
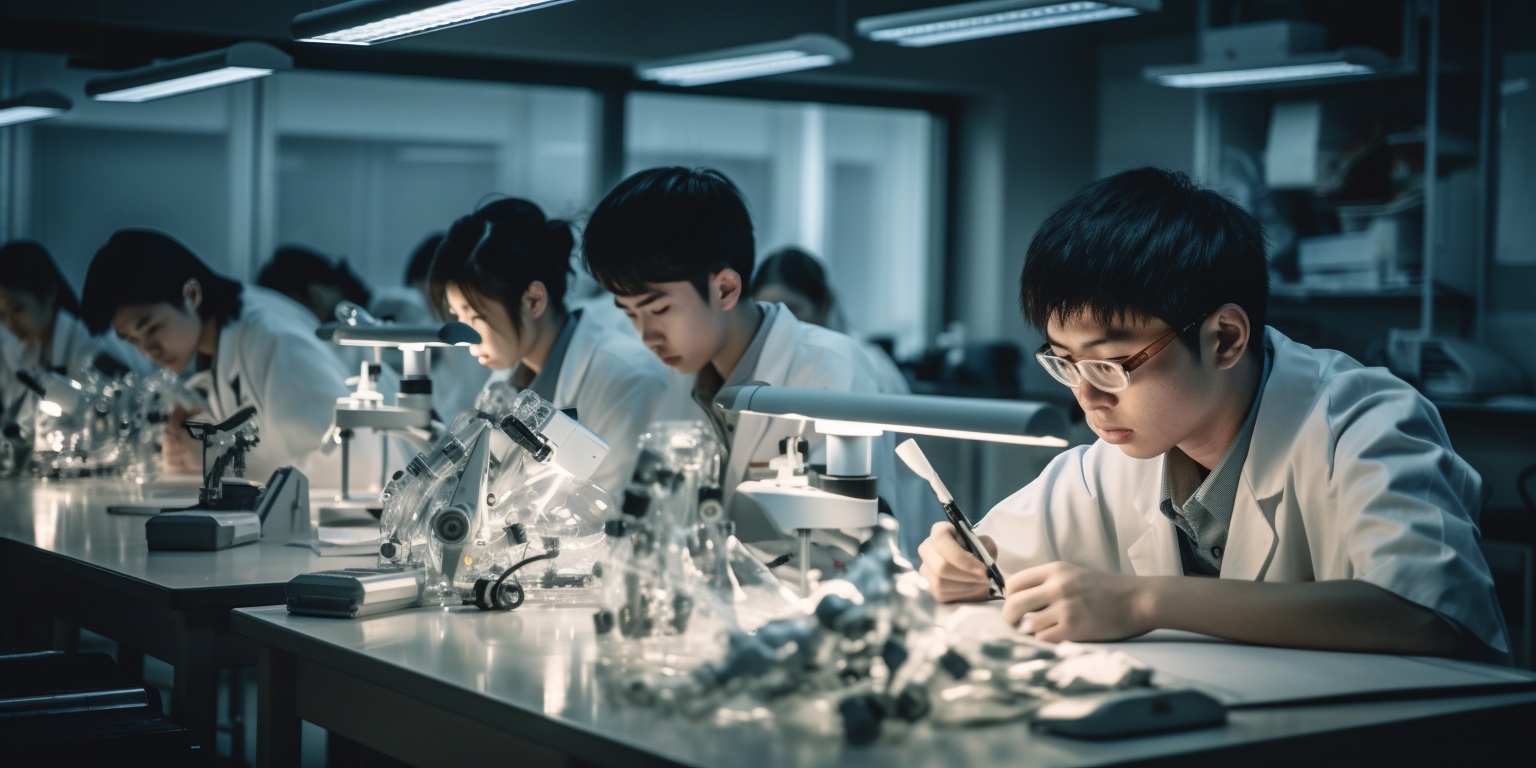
What should Secondary 1–4 students in Punggol actually learn in the Science laboratory? They should learn to perform safe, controlled observations; select and read instruments; record units; build and interpret tables and graphs; distinguish an experimental result from an explanation; and evaluate whether evidence supports a claim. The laboratory is not a room where a teacher performs spectacular demonstrations while students memorise outcomes. It is a training environment for trustworthy practical reasoning.
Important 2027 SEC rule: Under Full Subject-Based Banding, students take individual subjects at G1, G2 or G3 where offered and eligible. The Singapore–Cambridge Secondary Education Certificate (SEC) replaces the previous N- and O-Level awards from 2027. Science syllabuses are specific to subject levels and combinations. Do not assume every secondary laboratory activity has the same national practical component, marking scheme or weighting; check the exact G1, G2 or G3 syllabus for the student’s graduating year.
A Punggol Secondary 1 child whose thermometer readings have no units needs a different intervention from a Secondary 4 learner whose chemical conclusion is not justified by the observations. This guide gives parents, teachers and students a route through sixteen practical competencies, worked examples, a four-week improvement plan and boundaries on what must remain supervised in school. It continues the Secondary 1–2 Science and Full SBB overview and Secondary 3–4 Biology, Chemistry, Physics and SEC guide without repeating their subject-by-subject maps.
The quick laboratory skills check
| Skill | What competence looks like | Evidence to ask for |
|---|---|---|
| Understand the method | States the test question, changed factor and outcome. | An annotated experimental plan. |
| Use apparatus | Selects safe, appropriate measuring equipment. | A measurement with correct unit and sensible precision. |
| Record observations | Preserves actual results, even when unexpected. | A table of dated, labelled raw data. |
| Analyse results | Calculates changes and describes relationships accurately. | A justified graph or arithmetic comparison. |
| Evaluate evidence | Names a concrete source of error and a specific repair. | A revised method and a careful conclusion. |
Before the apparatus: the separate functions of school, home and tuition
Secondary schools provide laboratory access, equipment, trained supervision and school-specific practical procedures. Homes can provide reading practice, diagrams, safe models and discussion, but they cannot automatically reproduce laboratory safety systems. A tuition teacher can use low-risk demonstrations and data-based tasks, yet any chemical handling, heating or electrical experiment must be matched to appropriate premises, equipment and supervision.
The greatest educational gain often comes from an inexpensive change: after seeing a practical, students write a sentence explaining what the instrument measured and what that measurement does not prove. This converts activity into inquiry. A child who says ‘the experiment worked because the lamp lit’ has reported an outcome; a child who explains the complete pathway, battery and control factors has begun to reason scientifically.
Sixteen laboratory competencies: measurement, evidence, safety and transfer
1. Read the task before touching the equipment
A practical question defines what the learner is trying to find out. Rushing to connect apparatus can produce a dramatic outcome without answering the actual question. Before starting, the student should identify the changed factor, measured response, comparison conditions and any hazard mentioned in the instructions. The plan may require a simple observation, a measurement or a controlled comparison; these are not interchangeable designs.
Practical scenario. Imagine a Punggol Secondary 1 class asked whether two materials differ in their ability to reduce heat transfer. A student who begins by touching containers filled with very hot water without reading the safety instructions has already failed a crucial part of the task. The correct first move is to understand the permitted materials and method, identify the quantity being compared and follow the teacher’s apparatus guidance.
Teaching procedure. Teach a thirty-second annotation routine: box the measured quantity, underline the deliberate variation, circle any fixed condition, and highlight words that signal a safety instruction. The same reading discipline helps in written practical questions. Students must read ‘record the temperature every two minutes’ differently from ‘calculate the average temperature’ or ‘suggest an improvement’.
Wrong turn to repair. Misconception: doing something quickly demonstrates confidence. In laboratory work, speed without control creates unsafe and uninterpretable results. A calm reading of the procedure is not hesitation; it is a requirement for reproducible evidence.
Diagnostic question. Diagnostic: present a short method that asks for volume change but records only whether a beaker feels warm. Ask what is missing. The student should name the actual response measure, not simply say the experiment needs ‘more accuracy’.
New-context check. Transfer: switch from a heat-transfer practical to a microscope investigation. The learner should again identify what will be observed and what will be recorded before handling an instrument. This shows the routine belongs to scientific work rather than one school topic.
2. Laboratory safety is a judgement, not a list of slogans
Safety begins with knowing what can go wrong in a particular method. Goggles and clear benches are useful where the activity calls for them, but they do not make every procedure safe. The hazards of a low-voltage circuit differ from those of heated glassware, sharp slides, chemicals or biological samples. Appropriate supervision and school standard operating procedures take precedence over any generic online experiment description.
Practical scenario. A Secondary 2 student may see a video using household cleaning products for an apparent chemical reaction. Mixing cleaners can create dangerous exposures and is not a suitable home substitute for a school practical. A student who declines such a proposal and instead analyses the supplied data has made a correct scientific and safety decision.
Teaching procedure. Teach three response categories: proceed within approved instructions, stop and ask the supervising teacher, or replace the activity with a model or data analysis. The student should be able to explain the reason for stopping. Laboratories train not only manual technique but also the judgement to recognise when a test is outside one’s authority or competence.
Wrong turn to repair. Misconception: ‘If my friend already tried it, the test is safe.’ An anecdote is not a risk assessment. The equipment, setting, substances and user training all affect whether a method is permitted.
Diagnostic question. Diagnostic: ask whether the student should touch an unknown substance, smell a reaction directly or taste a sample to identify it. The answer is no; follow the laboratory’s approved identification and handling procedures instead.
New-context check. Transfer: apply the same rule to a student using a power supply. Properly designed school equipment and low-voltage models may be permitted under supervision; household mains sockets are not acceptable experimentation points.
3. Measurement requires a clearly defined quantity
A measured value is a quantity with a number and an appropriate unit, obtained by an identifiable method. ‘The beaker has 30’ leaves out whether the student means millilitres, grams or degrees Celsius. In later Science, units become part of dimensional reasoning, but the habit begins with identifying the instrument and recording the correct unit every time.
Practical scenario. Suppose a pupil measures the length of a metal rod and writes 0.12. The answer is unusable without units. If the instrument shows 12 centimetres, that may be written 12 cm or 0.12 m, but the conversion must be consistent and should not imply additional instrument precision.
Teaching procedure. Teach students to scan results for three details before doing any calculation: the column heading, its unit and the number of significant digits justified by the apparatus. Data should not become more precise through presentation alone. A rough school ruler reading is not transformed into a laboratory-grade measurement by adding trailing zeros.
Wrong turn to repair. Misconception: all numerical mistakes are arithmetic. A value with an incorrect unit can produce a plausible calculation and a scientifically wrong conclusion. Diagnose unit selection separately from operations.
Diagnostic question. Diagnostic: provide a temperature table marked only ’35, 33, 30′. Ask what critical information is missing. Students should specify the temperature unit and the relevant time labels before interpreting the pattern.
New-context check. Transfer: ask the student to compare a 20 cm reading with 0.25 m. They must convert to consistent units before concluding that one object is longer, demonstrating that measurement literacy applies across instruments.
4. Reading a ruler is different from copying the final mark
A ruler indicates positions along a scale. If an object does not start at zero, its length is the final reading minus the starting reading. Similar logic appears in other instruments where a baseline or zero offset matters. At school, students should also recognise that parallax can alter a reading and that the eye must be positioned appropriately.
Practical scenario. Consider a strip placed from the 2.3 cm mark to the 9.1 cm mark. Its measured length is 9.1 − 2.3 = 6.8 cm, not 9.1 cm. The example is deliberately simple because the skill is about recognising what the two positions represent, not memorising a subtraction procedure blindly.
Teaching procedure. Ask the learner to draw the scale, the object endpoints and the measurement span. When the units are clear, the drawing makes the mistake visible. Then change the starting position and confirm that the student can still obtain the same object length.
Wrong turn to repair. Misconception: the number nearest the right end is always the object’s length. This may work for objects aligned at zero but breaks instantly when apparatus placement changes.
Diagnostic question. Diagnostic: show two identical objects placed at different ruler positions. If the child reports different lengths, repair the baseline concept before assigning a longer worksheet.
New-context check. Transfer: use a graph of a quantity increasing from a nonzero value. The student should again compute final minus initial and distinguish an absolute reading from a change.
5. Liquid-volume readings require method and units
Measuring cylinders and other graduated apparatus have scales that must be read according to the school method and the nature of the liquid. Students may need to account for a meniscus, keep the apparatus level and avoid reading from an angle. The lesson is not simply ‘look at the line’; it is to record the result in a reproducible way.
Practical scenario. Suppose a graduated cylinder initially shows 42 mL and later shows 57 mL after a suitable object is submerged under supervision. The displacement is 57 − 42 = 15 mL, which corresponds to 15 cm³. This conclusion applies to a suitable displacement set-up; trapped air or overflowing water could invalidate the reading.
Teaching procedure. Teach students to identify initial and final values separately before subtraction. If the student cannot tell whether the numbers represent positions or quantities, the calculation may be arithmetically correct but physically meaningless.
Wrong turn to repair. Misconception: a narrow container and a wide container containing the same volume of water must display the same water height. Height also depends on shape and cross-section; graduations are designed for their own apparatus.
Diagnostic question. Diagnostic: give an intentionally flawed reading with the cylinder tilted. Ask what procedural issue needs correcting and why simply writing another decimal place does not solve it.
New-context check. Transfer: move from displacement to evaporation. Here the difference in volume represents water lost during the observation period, not an object occupying space; the subtraction structure survives but its physical interpretation changes.
6. Temperature and time need a consistent observation interval
A cooling or heating investigation frequently records temperature against time. The independent reference is often elapsed time, while temperature is measured at defined intervals. If intervals vary without explanation, a student can misread apparent changes in rate. Temperature is not the same thing as heat transfer, although temperature differences can help discuss heat flow.
Practical scenario. In an invented classroom table, a warm sample is 58°C at 0 minutes, 50°C at 4 minutes, 45°C at 8 minutes and 41°C at 12 minutes. The largest measured four-minute decrease is 8°C in the first interval. These are hypothetical safe data for analysis, not a recommendation that pupils heat liquids at home.
Teaching procedure. Teach the sequence: record timestamp, read the same thermometer correctly, preserve each value, then compare equal intervals. An accurate graph should reflect measured coordinates, not be drawn to match a guessed ‘smooth’ story if the data differ.
Wrong turn to repair. Misconception: a temperature decline in a diagram proves heat has been destroyed. Thermal energy transfers between the object and its surroundings; the observed temperature pattern requires an explanation consistent with physical processes.
Diagnostic question. Diagnostic: ask why the change from 58°C to 50°C over four minutes cannot be compared directly with a change from 50°C to 45°C over an unknown interval. The child should request the missing time data.
New-context check. Transfer: apply the same approach to mass changing over time during a supervised experiment. The quantity differs, but the importance of labelled intervals and consistent measurement remains.
7. Mass, volume and density must remain distinct
Mass and volume measure different properties. Density relates mass to volume, commonly expressed as mass divided by volume. When students see ‘heavier’ or ‘bigger’, they should resist replacing those informal words with density without calculation. A change in object shape can alter appearance while leaving mass unchanged.
Practical scenario. Imagine two hypothetical solid samples, each with volume 20 cm³. Sample A has mass 54 g and Sample B 36 g. Their densities are 54 ÷ 20 = 2.7 g/cm³ and 36 ÷ 20 = 1.8 g/cm³. Comparing these measured values is more informative than simply saying one block ‘looks heavier’.
Teaching procedure. Teach pupils to write given, find, operation and unit. Then ask whether both masses and volumes were measured reliably. A density value is only as trustworthy as the measurements feeding it. A calculation cannot repair a balance that was incorrectly zeroed.
Wrong turn to repair. Misconception: a larger object always has a higher density. Size affects volume and usually mass, but density is a ratio that depends on substance and conditions, not merely dimensions.
Diagnostic question. Diagnostic: offer a block of mass 50 g and volume 25 cm³ and ask for density, then double both quantities. The density remains the same; this tests the relationship rather than one memorised numerical answer.
New-context check. Transfer: connect density calculations to buoyancy carefully. Floating and sinking depend on the object’s overall average density and the fluid, among other conditions; the example must not imply every heavy item sinks.
8. Circuits require understanding of connections, not attractive drawings
Electrical circuit diagrams encode connections and component functions. A student who can copy a battery and lamp drawing but cannot recognise an open switch has learnt the picture, not the circuit. Practical reasoning begins with a complete conducting path, an appropriate source and relevant component ratings.
Practical scenario. Use a low-voltage school battery–switch–lamp demonstration only under approved conditions. If the switch is open, the path is interrupted and the lamp will not light through that circuit. Moving a component’s symbol on the page does not change the physical connectivity if the connections remain equivalent.
Teaching procedure. Teach students to trace the loop with a finger on the diagram and identify branches or breaks. Use words such as closed circuit and potential difference in ways appropriate to the course, but do not demand advanced mathematical circuit analysis from a learner before the underlying connectivity is secure.
Wrong turn to repair. Misconception: the switch manufactures electricity when closed. The switch changes the pathway; the source supplies energy to the circuit. Calling a switch the source creates confusion that reappears in more complex situations.
Diagnostic question. Diagnostic: present two diagrams with the same components in different geometric positions. Ask which connections are equivalent and whether both lamps can light. The child must reason from topology, not appearance.
New-context check. Transfer: give a circuit with two bulbs and ask how opening a shared branch could affect the system. Do not let the student guess a rule for series and parallel without identifying the actual connections.
9. Microscope skill starts with suitable preparation and honest labels
Microscopy combines apparatus handling, observation and accurate representation. An image viewed through a microscope may show structures that a textbook diagram has exaggerated or simplified. Students need to follow school procedures for slides and focusing, and should not assume every tissue or stain can be handled outside a supervised laboratory.
Practical scenario. Under teacher guidance, a pupil observes a prepared slide and draws what is visible rather than a textbook idealisation. The drawing should be clear, accurately labelled where structures can be identified and free of invented features. A sketch may reveal an organelle only if the method actually resolves it.
Teaching procedure. Teach a distinction between the object’s true size, the size seen in a drawing and the microscope’s magnification. For example, a 10× eyepiece with a 40× objective may give nominal total magnification of 400×. That multiplication does not by itself prove that every biological structure is visible.
Wrong turn to repair. Misconception: a drawing becomes scientific by adding labels such as nucleus or chloroplast even when these structures are not observable in the specimen. Observation and inference should be separated and uncertain identifications checked.
Diagnostic question. Diagnostic: show a labelled teaching diagram and a separate microscope photograph. Ask the child to state two things definitely visible in the photograph and one feature the diagram includes but the image does not resolve.
New-context check. Transfer: shift to a field observation made with binoculars or a zoomed photo. The same habits of resolution, scale and careful labelling apply without pretending a camera image is a laboratory microscope record.
10. Physical changes and chemical changes need evidence
In Chemistry, students should distinguish changes in form or state from the formation of new substances when the available evidence supports that judgement. Colour change, gas bubbles or temperature change may be useful observations but are not infallible standalone tests of chemical identity. Evidence must be interpreted within the method and substances involved.
Practical scenario. Consider ice melting into water: the substance remains water even though its state changes. In a safe hypothetical reaction description where gas is produced, that observation can support a chemical change but does not automatically identify which gas. An approved laboratory test and the correct interpretation would be needed.
Teaching procedure. Teach a three-step note: record the observation, link it to an appropriate conceptual claim, and identify whether another test is needed. Avoid requiring learners to reproduce hazardous reaction demonstrations simply to memorise one characteristic.
Wrong turn to repair. Misconception: all bubbles prove a specific gas such as oxygen. Bubbles show a gas phase may be present; identifying it requires suitable context and testing. A common exam error is naming a gas that the question never established.
Diagnostic question. Diagnostic: compare ice melting, sugar dissolving and a described reaction with a new product. Ask which evidence supports the difference and where the problem lacks enough information to be certain.
New-context check. Transfer: ask why rusting and evaporation should not be classified simply because both can make a metal object or wet surface look different. The processes are chemically distinct and need different explanations.
11. Mixtures and separation methods follow properties
Separation is not one recipe. Filtration, evaporation, distillation and chromatography depend on material properties and the required product. The student must first ask what is mixed, which component should be recovered and what the separation method actually exploits. The safest home instruction may be simply to inspect a diagram rather than perform a heating operation.
Practical scenario. A hypothetical mixture contains insoluble sand and dissolved salt in water. Filtration can retain sand while salt remains in the filtrate. Further separation of salt from water requires a method appropriate to the stated aim, and recovering both liquid water and salt is different from obtaining only the salt residue.
Teaching procedure. Teach learners to sketch the components before and after each step. A labelled sequence makes it harder to claim that the filter paper ‘catches’ dissolved salt. The diagram should state what enters and what is collected, not just name pieces of apparatus.
Wrong turn to repair. Misconception: any solid mixed with water can be removed by filtration. A dissolved substance passes through ordinary filter paper with the liquid under simple school conditions; insoluble solid particles can be retained if the filter is appropriate.
Diagnostic question. Diagnostic: ask whether filtering sugar water produces pure water. The student should say no, and explain what state the sugar is in and which technique might suit the stated objective.
New-context check. Transfer: adapt the analysis to a different mixture with a magnetic solid and nonmagnetic material. The property exploited changes, so copying a filtration answer without examining properties would be wrong.
12. Repeat readings and sources of variation require a response
Repeat trials help distinguish a stable pattern from a result that may have been affected by measurement variation or inconsistent technique. They do not automatically correct a systematic error. Students need to learn to preserve raw observations, investigate anomalies and avoid reporting unwarranted certainty from a very small data set.
Practical scenario. Suppose a class measures the time a toy car takes to travel a fixed distance and records 3.1 s, 3.2 s and 4.8 s. The outlying result merits checking: perhaps the release differed or the timer was started late. Repeating with a consistent method helps assess whether it recurs.
Teaching procedure. Teach the student to write what changed in the repeat, what stayed the same and whether any entry was excluded. If an anomalous result is omitted from a calculation, the reason should be explicit. A neat average made from selectively chosen values is less useful than an honest record.
Wrong turn to repair. Misconception: results that contradict the theory must be deleted. Science instead uses disagreements to inspect methods and theories. The student must not adjust a measurement merely to make it look expected.
Diagnostic question. Diagnostic: present an average calculated from only two of three listed measurements with no stated reason. Ask why that summary could mislead and what information is needed before accepting it.
New-context check. Transfer: compare repeated density measurements or plant-height records. The child should carry forward the same evidence-integrity rule, even though the instruments and sources of variation differ.
13. Designing a fair test requires a causal question
A test is fair when the relevant comparison isolates the intended factor sufficiently for the question. Keeping some factors constant is essential, but ‘everything else the same’ is not a complete answer if the child cannot name what matters and why. A fair method may still need more trials or better instruments before a strong conclusion is possible.
Practical scenario. Suppose a learner wants to compare how two insulating materials affect the cooling of equal volumes of warm water. They should consider starting temperature, container shape, measured duration and exposed area. If one cup starts at a much lower temperature, a result comparing final temperatures alone is hard to interpret.
Teaching procedure. Teach a brief design table: independent factor, dependent measurement, controlled conditions, proposed recording schedule and foreseeable errors. Then ask which part directly addresses the stated research question. A plan should be simpler than a research grant, but logically complete.
Wrong turn to repair. Misconception: controlling irrelevant details is the same as identifying a confounder. A student can list ten identical characteristics and still miss the starting temperature that actually affects the comparison.
Diagnostic question. Diagnostic: show two experiments where both ‘keep all other things the same’ but one changes two substances at once. Ask why the method does not isolate either factor.
New-context check. Transfer: move to a biology task comparing seed germination under different water conditions. The student should recognise relevant controls while acknowledging that living systems introduce additional variability.
14. An accurate graph is not proof of the explanation
Graphs help communicate and inspect relationships between measured quantities. Students should label axes, use a consistent scale, represent actual observations and interpret slopes or trends carefully. A graph can display data accurately yet support only a limited conclusion, particularly if variables were not controlled or measurements were few.
Practical scenario. Imagine two cooling curves plotted from separate cups. One falls more rapidly over the recorded intervals. The graph shows a difference in recorded temperature changes, but the student should not declare that material type caused it without knowing whether the cups started at the same temperature and were exposed to equivalent conditions.
Teaching procedure. Teach a five-point inspection: axis label, unit, equal scale, plotted values and one conclusion constrained by the data. On occasion, an unusually scaled vertical axis can exaggerate how dramatic a change looks; reading the numbers avoids over-relying on visual appearance.
Wrong turn to repair. Misconception: a perfect straight line is always expected because textbook diagrams look smooth. Real measurements can vary. Students should not redraw recorded points just to force an elegant line.
Diagnostic question. Diagnostic: provide a graph where the vertical axis begins at 35°C rather than zero. Ask the learner to estimate total change using stated values, not the apparent height of the line.
New-context check. Transfer: use a speed–time or growth graph. The same graph literacy should work even when the subject topic changes, while the physical interpretation of slope and area must be taught according to the appropriate syllabus.
15. Evaluation specifies the exact flaw and the repair
‘Improve accuracy’ is not a sufficient evaluation by itself. A meaningful critique identifies a concrete source of error, explains how it affects the evidence and proposes a targeted improvement. Evaluation is not criticism for its own sake; it demonstrates that the learner understands how the method produces knowledge.
Practical scenario. A student notes that measuring the temperature of a small sample was inconsistent because the thermometer was not held in a repeatable position. A specific repair is to use the same immersion depth under appropriate supervision and wait consistently before recording. The explanation should be linked to the instrument and test.
Teaching procedure. Teach a three-part evaluation sentence: ‘The problem is…, which could influence…, so we would….’ This avoids vague suggestions such as using better tools without explaining what improvement matters. Not every limitation can be removed at school; students may need to acknowledge remaining uncertainty.
Wrong turn to repair. Misconception: saying repeat three times solves every experimental weakness. Repetition can improve evidence about random variation but may not fix a consistently miscalibrated instrument or an unfair comparison.
Diagnostic question. Diagnostic: compare two proposed improvements, ‘be careful’ and ‘use the same measured starting volume in both dishes’. Ask which fixes the identified unequal-volume problem and why.
New-context check. Transfer: inspect a paper-based Science investigation with no live equipment. The learner should still be able to identify confounding factors and recommend more reliable data collection.
16. Scientific conclusions should preserve uncertainty and meaning
A conclusion should answer the research question, cite relevant evidence and state the strength of the inference. Students often assume that Science demands absolute statements. In reality, a carefully limited conclusion is more scientifically mature than a confident unsupported one. Uncertainty does not mean refusing to answer; it means matching the claim to the method.
Practical scenario. An imagined magnet test finds that Magnet A lifted 12 paper clips while Magnet B lifted 8 in one trial, using similar clips. The immediate conclusion is that A lifted more clips in that particular test. A stronger claim about comparative lifting performance needs fair methods and repeated results.
Teaching procedure. Teach students to quote the comparison, explain the relevant scientific concept and specify the scope: ‘in the observed trials’, ‘under the stated conditions’ or ‘the data suggest’. This is much more useful than decorating an answer with difficult vocabulary.
Wrong turn to repair. Misconception: the longest conclusion is the strongest. Length without evidence and logic can hide the absence of a direct answer. Specific data and a mechanism matter more than rhetorical certainty.
Diagnostic question. Diagnostic: give a brief data table and ask for one statement definitely supported and one statement not established. The student should be able to explain why the second claim overreaches.
New-context check. Transfer: ask the learner to assess a headline making a large claim from a small experiment. Scientific literacy now matters outside school Science, where persuasive images and confident captions may obscure weak evidence.
Worked question A: density, displacement and the correct units
Original practice problem: A student uses a balance to measure a small solid sample of mass 67.5 g. An appropriate graduated cylinder reads 28.0 mL before the sample is placed in the liquid and 53.0 mL afterwards. Find the sample volume and density, stating one important condition. These data are illustrative, not results from a named Punggol school.
Step 1: volume. The water displacement is 53.0 − 28.0 = 25.0 mL, equivalent to 25.0 cm³. The method assumes the sample is completely submerged as intended and the displacement measurement is valid.
Step 2: density. Density = mass ÷ volume = 67.5 ÷ 25.0 = 2.70 g/cm³. The arithmetic and unit match. Reporting 2.7 g/m³ would be a large unit error, not a minor wording difference.
Step 3: evaluate. Trapped air bubbles could increase the displaced volume reading and make the calculated density too low. A useful improvement is to follow the approved procedure for eliminating trapped air while keeping the test safe. Do not claim this exact density identifies the sample without additional relevant information.
Worked question B: choosing a suitable graph conclusion
Original table: At 0, 3, 6 and 9 minutes, an imaginary sample has temperatures 60, 54, 49 and 45°C. Across the recorded period, the decrease is 60 − 45 = 15°C. The consecutive three-minute changes are 6°C, 5°C and 4°C.
Conclude only what is shown. The temperature fell throughout these readings, with the greatest recorded three-minute fall in the first interval. Without additional information, the student cannot establish how every small interval behaved, why the rate changed or whether a second sample would show the same pattern.
Worked question C: do two materials have different insulating effects?
Original method: Two containers each begin with 100 mL of water, but one is at 65°C and the other at 50°C. Different insulating materials are wrapped around them. The researcher measures the temperature after fifteen minutes and claims that the material on the colder sample is a better insulator because its final temperature is lower.
Diagnosis: The starting temperatures differ, and ‘lower final temperature’ is not an appropriate isolated measure of insulation. A fairer comparison would use consistent starting temperatures, volumes, container geometry, timing and surroundings; then compare temperature changes under the controlled conditions. The conclusion must be tied to measured changes and design, not superficial final readings.
Worked question D: why an unlabeled microscope drawing is insufficient
Original scenario: A student copies a perfect textbook cell diagram, adds labels that were not observable in the prepared slide and records a total magnification without noting the eyepiece or objective. Explain two reasons the work is incomplete.
Answer: A laboratory drawing should be based on what the student actually observed, with only justified identifications. The student should record the apparatus settings and follow school conventions for labels, titles and scale where applicable. A drawing can look impressive yet fail to preserve the evidence needed to interpret it.
A four-week lab skills repair programme
| Week | Focus | Independent proof of improvement |
|---|---|---|
| Week 1 | Audit marked school work for units, diagram reading, variables, practical conclusions and unsafe assumptions. | Student can identify what the task measures and where they previously went wrong. |
| Week 2 | Teach three targeted instrument or method skills with worked examples; use approved demonstrations only. | Student correctly reads measurements and states controls without hints. |
| Week 3 | Use unfamiliar experimental scenarios from different Science strands. | Student transfers fair-test and graph skills beyond one memorised experiment. |
| Week 4 | Run one timed data-interpretation exercise and one oral method evaluation. | Student describes evidence, mechanism and a specific limitation accurately. |
The student does not need to ‘perform a practical every week’ to improve experimental reasoning. Sometimes a carefully drawn diagram with a faulty method to debug is safer and more informative. Review the school syllabus and exact national examination code before adopting resources intended for another cohort or subject level.
Frequently asked laboratory questions
Does every 2027 SEC Science subject have the same practical examination?
No assumption of uniformity should be made. The G1, G2 and G3 Science routes list different subject codes and syllabuses. Read the assessment scheme in the student’s specific current-year syllabus and ask the school about internal practical assessment.
What should a Secondary 1 student know before attempting laboratory worksheets?
They need a secure habit of reading method instructions, using units, distinguishing measured and changed variables, keeping comparisons fair and interpreting observations. Advanced chemical techniques are not a prerequisite for all Secondary 1 learners.
Can a tuition centre claim to replace school laboratory classes?
A tuition centre can develop reasoning and sometimes demonstrate approved low-risk methods, but a school laboratory has equipment, supervision and curriculum responsibilities that cannot be assumed to exist elsewhere. Claims should be checked against actual facilities and teaching procedures.
Should G1, G2 and G3 learners all attempt identical practical papers?
Not as a default. They may share underlying scientific habits, but subject content, assessment demand and examination specifications differ. Start with the student’s enrolled subject level and actual course documents.
Why does a student draw excellent graphs yet struggle with conclusions?
Graph construction and inference are different skills. A graph may accurately show a pattern without demonstrating a cause. Ask what the evidence shows, what the method controlled and what alternative explanations remain.
Is it correct to discard anomalous data?
Not automatically. Verify the observation and method, record how anomalies are handled and repeat if the scientific question justifies doing so. Never change numbers simply to force the expected result.
How should a learner prepare for microscopy questions?
Use school-provided microscope procedures, understand the purpose of focus and magnification and practise clear evidence-based diagrams. Avoid overlabelling features that a specimen does not show.
Can parents use home chemicals to teach Chemistry?
Avoid mixing cleaners, unknown reagents or hazardous chemicals. Use safe models, labelled diagrams, school-approved exercises and teacher supervision for procedures requiring laboratory controls.
What is the quickest useful intervention after a weak practical test?
Classify the error precisely: equipment, measurement, units, method, calculation, concept, graph or explanation. Teach one mechanism, retest with a new example and track whether the child can self-correct.
Where should a Punggol parent check 2027 SEC Science codes?
Use the SEAB 2027 G1, G2 and G3 syllabus pages directly. G1 Science K123, G2 combined Science combinations K223–K225 and G3 combinations K326–K328 and separate Sciences K323–K325 illustrate why codes and levels cannot be mixed indiscriminately.
Official source links and route to the rest of the Punggol Science system
- SEAB — Secondary Education Certificate (SEC) overview
- SEAB — 2027 G1 syllabuses for school candidates
- SEAB — 2027 G2 syllabuses for school candidates
- SEAB — 2027 G3 syllabuses for school candidates
- MOE — 2024 Full Subject-Based Banding and SEC announcements
- eduKatePunggol — Primary Science Inquiry, Fair Tests and PSLE Evidence
- eduKatePunggol — Secondary 1–2 Science overview
- eduKatePunggol — Secondary 3–4 Science and SEC overview
- eduKatePunggol — Why the independent variable normally appears on the x-axis
Source and limitation note (18 October 2026): The national examination references are the SEAB listings. No laboratory experiment here is represented as a compulsory assessed task for every syllabus. Numerical values are original hypothetical practice data. Safety requirements are determined by the actual school, laboratory staff and applicable rules, not by this general guide.
Continue the Punggol Science Education Series
Choose the next stage or deeper skill. These eight guides share the same national MOE and SEAB evidence framework but answer different questions.


