
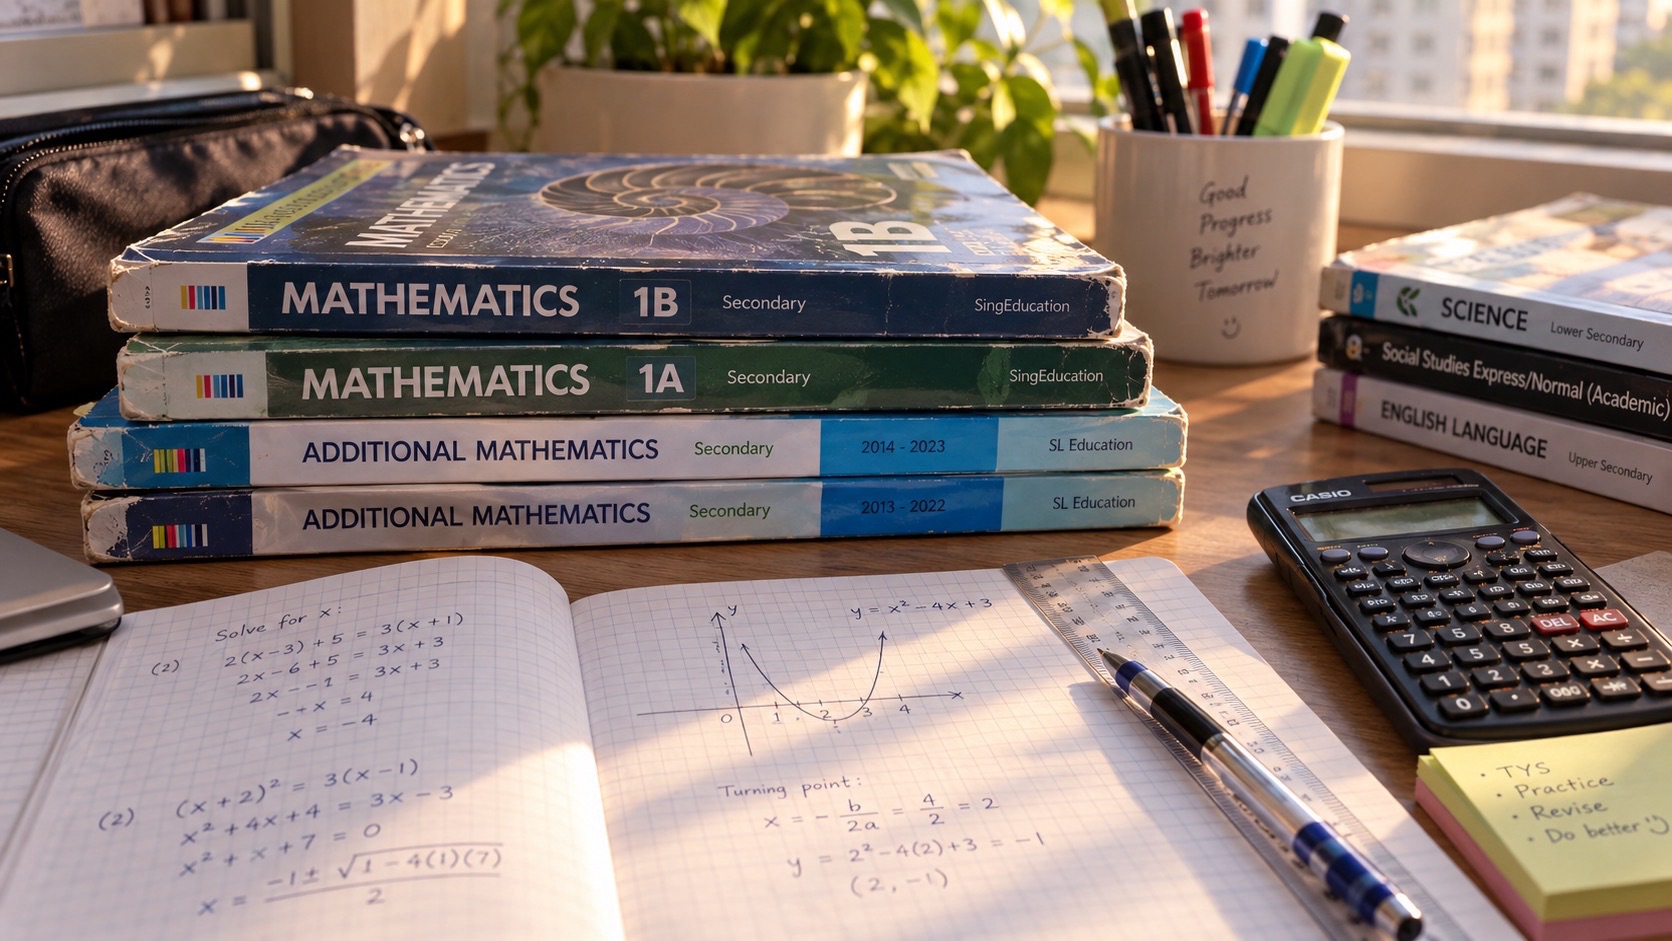
PG3 is Posting Group 3, the Secondary 1 admission route under Singapore’s Full Subject-Based Banding. It usually means starting most subjects at G3, but it does not guarantee that a student can interpret a graph or explain gradient. MOE’s G3 Secondary One Mathematics syllabus explicitly includes Cartesian coordinates, ordered pairs, linear functions of the form y = ax + b, graphs of linear functions and positive or negative gradients. For Punggol parents, the immediate priority is understanding how an input value determines an output, plotting correctly and explaining what the steepness and direction of a straight line mean.
A graph is not simply a picture that joins numbers. Its axes, units and scale define the relationship being represented. A function such as y = 2x + 3 produces one y-value for each suitable x-input, while its straight-line graph has gradient 2 and y-intercept 3. Those values should be understood, not memorised from a template. Schools decide their exact term sequence and assessment methods. All bus journeys, school-club totals and prices below are deliberately hypothetical exercises rather than current Punggol data.
- PG3 is a school posting group; G3 describes the Mathematics subject level and its learning outcomes.
- MOE includes functions and graphs, ordered pairs and gradient in Secondary One G3 Mathematics.
- An ordered pair (x,y) gives the horizontal coordinate first and vertical coordinate second.
- A function associates each permitted input with exactly one output.
- A linear function y = ax + b produces a straight-line graph with gradient a and y-intercept b.
- Gradient is vertical change divided by horizontal change, when the horizontal change is not zero.
- Positive, negative and zero gradients have different graphical meanings.
- Use a consistent axis scale, appropriate labels and accurate coordinates when plotting points.
- Distinguish a real-world linear model from actual observed data and acknowledge the model’s limits.
- Graphical methods for simultaneous equations and quadratic graph work involve later progression; follow the school programme.
Definition lock: linear graph features
| Feature | Meaning | Example |
|---|---|---|
| Ordered pair | One position (x,y) | (2,7) |
| Linear function | Rule with constant change per unit x | y = 2x + 3 |
| Gradient | Vertical change / horizontal change | 2 |
| y-intercept | Output when x=0 | (0,3) |
| x-intercept | Input when y=0 | (−1.5,0) |
| Domain | Inputs permitted by the model | Whole items n ≥ 0 |

Guide chapters
- Why the first important question is what each axis represents
- Definition lock: coordinates, relationships and functions
- Coordinates are ordered pairs, not an unordered list
- The four quadrants require correct signs
- The graph scale is part of the mathematics
- Tables of values connect algebra to a graph
- Why a linear graph forms a straight line
- Gradient is rise over run
- Positive gradient means the line rises left to right
- Negative gradient shows a decreasing linear relationship
- Zero gradient describes a horizontal line
- A vertical line has undefined gradient
- The y-intercept identifies where the line crosses the y-axis
- The gradient and intercept have different roles
- Graphing y = ax + b from two accurate points
- How to read an equation from a drawn line
- Reading the x-intercept solves a particular question
- Domain restrictions matter for real-world models
- A linear relationship is not always proportional
- Graphical lines can represent simple real-world scenarios
- Gradient can have physical units
- Changing the axis scale changes appearance, not numerical gradient
- Graphing technology needs independent checking
- Intersections connect to simultaneous equations later
- Parallel lines can have equal gradients
- Perpendicular gradients are a later useful connection
- Quadratic graphs form a different family
- A four-week linear-graph reasoning plan
- What a Punggol parent should ask the Mathematics department
Why the first important question is what each axis represents
A student may draw a beautiful straight line and still misunderstand the quantities it connects. The x-axis usually represents one chosen variable and the y-axis another, but the diagram’s title, units and conditions must establish which is which. A line can be mathematically accurate on paper yet communicate the wrong claim if its axes are reversed or labels omitted.
Suppose a fictional school project shows the number of identical notebooks bought along the horizontal axis and total cost along the vertical axis. The relationship can be plotted using ordered pairs. The same picture cannot automatically be described as the number of pupils against travel time, because those labels describe different data.
Parents can ask the teenager to explain in one sentence what moving one unit right means and what moving one unit up means. The answer reveals whether graph reading has become meaningful.
Definition lock: coordinates, relationships and functions
Cartesian coordinates give the position of a point relative to perpendicular axes using an ordered pair. A relationship describes how two variables are connected. A function is a particular relationship in which each permitted input is associated with exactly one output. A linear function has a rule that produces a straight-line graph in the ordinary school coordinate plane.
These definitions are related but not interchangeable. A set of plotted observations does not guarantee an exact linear function; the data may show scatter or other patterns. A rule written algebraically can be used to predict outputs under its assumptions, while its graph communicates the relationship visually.
Ask the child to identify the input, output and rule rather than treat the graph as a decoration at the end of a calculation.
Coordinates are ordered pairs, not an unordered list
In the point (3,2), the x-coordinate is 3 and the y-coordinate is 2. In (2,3), the x-coordinate is 2 and the y-coordinate is 3. Those are generally different positions. The brackets and comma convey an order that matters to the coordinate system.
Students often plot the first value vertically because that number looks taller on the page. A reliable method moves horizontally to the x-value and vertically to the y-value, following the scale of the axes. The method also works with negative coordinates, where the signs determine direction.
Parents can ask the child to plot (−2,3), (3,−2) and (−2,−3) on the same labelled plane. If the results differ correctly, the ordered-pair idea is beginning to settle.
The four quadrants require correct signs
The coordinate plane is divided into four quadrants by the axes. Moving from the usual first quadrant counterclockwise, the signs are (+,+), (−,+), (−,−) and (+,−). Points on an axis are not in any of the four open quadrants. Recognising sign patterns helps students find plotting errors quickly.
An original point such as (−4,−1) lies in the third quadrant because both coordinates are negative. The point (0,5) lies on the y-axis rather than in the first or second quadrant. The classification follows mathematical definitions rather than a diagram’s drawing style.
Ask the teenager to predict the quadrant before placing the point. The prediction can be checked against the graph rather than guessed afterward.
The graph scale is part of the mathematics
A horizontal step might represent one, two, five or ten units depending on the diagram. The vertical axis may use a different scale from the horizontal one. A point that looks halfway up a page does not automatically mean the y-value is half the x-value. Students must read numbers and tick intervals explicitly.
Imagine a fictional cost graph where every horizontal tick represents five items and every vertical tick represents ten dollars. A pupil who counts each tick as one will plot the wrong ordered pair even if their equation is correct. A graph can be neat and still numerically misleading.
Parents can ask for the value of one tick on each axis before allowing any point to be plotted. This is an effective early check.
Tables of values connect algebra to a graph
A value table records input-output pairs generated by a rule. For y = 2x + 3, choosing x = 0,1,2 gives y = 3,5,7. The ordered pairs (0,3), (1,5) and (2,7) all satisfy the equation. Plotting them should produce points on one straight line.
An incorrect table can cause every later step to be wrong. Students should substitute a chosen x-value carefully and retain signs and brackets where necessary. For example, x = −2 gives y = −1 in this rule, not 1 or 7.
Parents can ask the child to check one table entry independently. A graph is only as reliable as the calculation and plotting behind it.
Why a linear graph forms a straight line
In a linear function of the form y = ax + b, the output changes by a constant amount whenever x changes by one unit, provided the stated domain and rule apply. That constant rate of change is the gradient. Points generated by the same linear function lie on a straight line.
For y = 2x + 3, adding one to x adds two to y. The pattern is visible in a value table and in the graph’s repeated rise. A student who describes the line as straight merely because they used a ruler has explained the drawing method, not the mathematical property.
Ask what numerical change remains constant along the relationship. The answer connects the equation, table and graph.
Gradient is rise over run
The gradient of a nonvertical straight line is the change in its y-coordinate divided by the corresponding change in its x-coordinate. Using points (x1,y1) and (x2,y2), this is (y2−y1)/(x2−x1), where the denominator must not be zero. The ratio expresses steepness and direction.
Take (1,5) and (3,9). The vertical change is 4, and the horizontal change is 2, so the gradient is 2. Reversing the order of both coordinate differences gives the same result. Reversing only one numerator order would incorrectly change the sign.
Parents can ask the pupil to label rise and run on the graph before calculating. A meaningful diagram prevents a memorised formula from becoming a source of sign errors.
Positive gradient means the line rises left to right
A positive gradient describes a straight line whose y-values increase as x increases under the usual axis orientation. The larger the positive gradient, the more y changes for a given positive horizontal movement. This mathematical meaning should not be confused with a claim that the situation is socially or economically positive.
For y = 3x − 1, moving one unit right increases the output by three. A student can verify this using a table, not only the visual appearance. The graph rises to the right even when its y-intercept is below zero.
Ask whether the word positive refers to the gradient sign or to a judgement about the event being modelled. A line rising in a graph can describe a harmful quantity as well as a useful one.
Negative gradient shows a decreasing linear relationship
A negative gradient means the output decreases as the input increases in the standard axes orientation. The gradient is negative because the vertical change and horizontal change have opposite signs. A line descending to the right does not necessarily pass through negative coordinates; it may remain above the x-axis across the drawn region.
For y = −2x + 8, choosing x = 0,1,2 gives outputs 8,6,4. The line falls by two units for each one-unit increase in x. The fact that all three listed y-values are positive does not make the gradient positive.
Parents can ask the child to separate the sign of a point’s coordinate from the sign of the change between points. This distinction is often the missing concept.
Zero gradient describes a horizontal line
A horizontal line has constant y-value even as x changes. Its gradient is zero because the vertical change is zero while the horizontal change is nonzero. The equation y = 4 represents a horizontal line at height four, not a line through x = 4.
Students may confuse a constant output with a zero output. The value remains four in this example; only the rate of change is zero. The line y = 0 is a different horizontal line, coinciding with the x-axis.
Ask the pupil which quantity changes and which stays the same. This gives the zero-gradient concept a functional meaning.
A vertical line has undefined gradient
A vertical line such as x = 3 contains points with the same x-coordinate and different y-coordinates. The horizontal change between two distinct points on it is zero. Dividing by zero is undefined, so the gradient is not zero; it is undefined in ordinary coordinate geometry.
Such a vertical line is not the graph of a function y of x across those multiple points, because the single input x = 3 would be associated with more than one output. It can still be represented by a valid equation in two variables.
Parents can ask why the denominator is zero and what the vertical-line relationship means. Avoid equating ‘no horizontal movement’ with ‘no steepness’.
The y-intercept identifies where the line crosses the y-axis
The y-intercept of a line is the y-value when x = 0. In y = ax + b, that value is b, so the point (0,b) lies on the graph. The intercept is a point-location concept and may have a practical meaning in a model, such as an initial amount or fixed fee.
For a fictional service with C = 5n + 12, the y-intercept is 12, indicating a fixed initial cost when n = 0 under the stated model. That does not mean any real local service charges a twelve-dollar fee; the example is hypothetical.
Ask what the intercept represents in the actual question. A correct number without an interpretation may not be a complete answer.
The gradient and intercept have different roles
Changing a in y = ax + b changes the line’s gradient, while changing b shifts its intercept without changing its gradient. These two parameters allow pupils to distinguish rate of change from starting value. A student may read both as random constants to plug into a table, losing their meaning.
Compare y = 2x + 1 and y = 2x + 5. Both have gradient 2 but different intercepts. Now compare y = 2x + 1 and y = −x + 1; they share an intercept but differ in gradient. A quick sketch demonstrates the difference.
Parents can ask which feature changed and how that appears in both table and graph. This creates a stronger understanding than remembering a slogan.
Graphing y = ax + b from two accurate points
A straight line is determined by two distinct points, so a pupil can generate and plot two suitable pairs to construct its graph. Using a third point as a check helps reveal miscalculation or plotting errors. The choice of values should suit the axes and avoid awkward fractions where an elementary question allows simple numbers.
For y = −x + 4, x = 0 gives y = 4 and x = 4 gives y = 0. Plotting (0,4) and (4,0) determines the line. A third point such as (2,2) should lie on it. The straight line must follow the scale and extend only as appropriate to the stated domain.
Ask the teenager to verify a plotted point by substitution. The equation and diagram should tell the same story.
How to read an equation from a drawn line
To find a linear equation from a graph, determine the gradient from two accurate points and identify the y-intercept. These values can be substituted into the form y = ax + b. The learner should not simply guess the gradient from the line’s visual angle, because axes can have different numerical scales.
A graph passing through (0,3) and (2,7) has gradient 2 and y-intercept 3, so y = 2x + 3. Substituting a third point can check the proposed rule. A drawn line that crosses the origin instead would require b = 0.
Parents can ask for two coordinate pairs and their values. Describing a line as ‘quite steep’ is not enough for an exact equation.
Reading the x-intercept solves a particular question
The x-intercept occurs where y = 0. For y = 2x − 6, setting 0 = 2x − 6 gives x = 3, so the line crosses the horizontal axis at (3,0). The student should distinguish the x-intercept coordinate from the y-intercept and not switch their roles.
In an applied model, the x-intercept might represent when a quantity reaches zero, but that interpretation depends on the physical setting and allowed domain. A mathematical extension may have no realistic meaning if it predicts negative items or travel time.
Ask what is being set to zero and why. The answer reveals the intercept’s meaning rather than just its location.
Domain restrictions matter for real-world models
An algebraic linear function may be defined for all real x in a pure Mathematics question, but a practical model may permit only nonnegative values or whole-number counts. A ticket count cannot ordinarily be negative or fractional, even if the line extends into those regions on paper.
For a fictional cost model C = 3n + 5, the natural domain may be nonnegative integer n if n counts purchased items. The line joining plotted integer points is a convenient representation of the underlying rule but may suggest impossible fractional purchases if interpreted literally.
Parents can ask which inputs are meaningful. This is the beginning of mathematical modelling, not an optional afterthought.
A linear relationship is not always proportional
A directly proportional relationship has the form y = kx under the usual model, passing through the origin. A more general linear function y = ax + b can include a nonzero intercept. The two may share a constant rate of change but do not have identical proportional properties.
Compare fictional total costs C = 4n and C = 4n + 10. Both increase by four per item, but only the first has no fixed fee. Doubling n doubles the first total, while it does not generally double the second. The graph’s intercept reveals why.
Ask what happens when the input is zero and when it doubles. This helps the child separate gradient from proportionality.
Graphical lines can represent simple real-world scenarios
Constant-speed travel, a fixed-fee service or a regular saving contribution can sometimes be modelled using linear functions. However, actual journeys include delays, discounts may be conditional, and budgets may change. A mathematical model is useful only within the scope of its assumptions.
An original fictional Punggol journey model might state that a person walks at a constant speed for a limited interval. Plot distance against time using supplied data. The straight line represents that assumed constant speed, not a live estimate of travel from a real HDB block to a particular station.
Parents can ask which conditions would make the line stop matching the real situation. That strengthens honest modelling and protects against invented local facts.
Gradient can have physical units
Gradient is a ratio of changes in the axes’ quantities. If distance in metres is graphed against time in seconds, the gradient has units of metres per second. If total cost in dollars is graphed against items, the gradient has units of dollars per item. A mathematical number without its context may be incomplete.
Suppose a fictional chart shows a distance increase of 40 metres over 20 seconds under a constant-rate model. Its gradient is 2 metres per second. The same numerical value 2 on a cost graph could mean two dollars per item. They are not the same physical quantity.
Parents can ask for axis units before simplifying a gradient fraction. Dimensional reasoning connects graphs to everyday meaning.
Changing the axis scale changes appearance, not numerical gradient
A line may look steep or shallow depending on the horizontal and vertical plotting scales. Its numerical gradient is still determined by coordinate differences using actual units. Students who estimate gradient from the visual angle alone may be misled by a stretched or compressed chart.
Imagine a graph plotted with one centimetre representing ten horizontal units but one centimetre representing one vertical unit. The visual appearance differs from a graph with equal numerical scales. The mathematical calculation must use the stated axis values.
Ask the pupil to read two accurate points instead of judging steepness by eye. This also supports critical interpretation of public graphics.
Graphing technology needs independent checking
Digital graphing tools can plot equations quickly, but they cannot guarantee that a student entered the intended formula or interpreted the axes correctly. A missing bracket, incorrect sign or swapped variable may produce a plausible graph of a different relation. Technology supports checking when a learner understands the model.
Before viewing a graph, ask the student to predict the gradient sign and y-intercept. Then compare the output with that prediction. If the graph contradicts it, check the equation, window and scale rather than assume the software revealed a mysterious new rule.
Parents can encourage use of teacher-approved tools while insisting that the pupil can still explain one point by substitution.
Intersections connect to simultaneous equations later
Two lines intersect at a point when their coordinate values satisfy both equations. This offers a geometric interpretation of solving a pair of linear equations in two variables. MOE’s G3 syllabus develops related methods in later progression, including algebraic substitution, elimination and a graphical method.
A beginner can understand that the intersection of y = x + 1 and y = −x + 5 is at (2,3), because both expressions give 3 when x = 2. The student need not immediately master an entire formal simultaneous-equations chapter to grasp the picture.
Parents can present this as a conceptual extension and follow the teacher’s actual assessment scope.
Parallel lines can have equal gradients
In the usual coordinate plane, two distinct nonvertical straight lines with the same gradient and different intercepts are parallel. They rise or fall by the same amount per unit horizontal change. Equal gradient does not mean the same line, since the intercept may differ.
Compare y = 3x + 1 and y = 3x − 4. Their common gradient is 3, but they cross the y-axis at different positions, so they are distinct parallel lines. A pupil who uses only one coordinate or the visual gap to infer parallelism can make errors.
Ask which property remains unchanged and which distinguishes the graphs. The two parameters together tell the story.
Perpendicular gradients are a later useful connection
Under standard Euclidean coordinates with the same unit conventions on the axes, nonvertical perpendicular lines have gradients whose product is −1. This is a helpful later connection between geometric angles and algebraic slopes, not necessarily a compulsory first-term Secondary One calculation. Vertical and horizontal lines require their own interpretation.
An optional example contrasts gradient 2 with gradient −1/2. The product is −1, satisfying the perpendicular-gradient relationship in the appropriate model. The child should not apply the rule to every pair of lines merely because their visual angles appear different.
Parents can let the school decide when formal perpendicularity calculations belong in the programme.
Quadratic graphs form a different family
MOE’s G3 Secondary Two syllabus includes quadratic functions and their graphs, with features such as symmetry and maximum or minimum points. These are not straight-line graphs. A student should recognise that y = x² behaves differently from y = 2x and avoid using a constant linear gradient for a curved quadratic graph.
Values for y = x² at x = −2, −1, 0, 1 and 2 are 4,1,0,1,4, forming a symmetric parabola. The change in y per equal step of x is not constant. That is one accessible difference from a linear function.
Parents can describe quadratic work as later progression and preserve the distinction between current foundations and upcoming advanced topics.
A four-week linear-graph reasoning plan
Week one practises coordinates, axis labels and value tables. Week two focuses on y = ax + b and generating accurate straight-line graphs. Week three introduces calculating and interpreting gradient and intercepts. Week four uses new fictional contexts, checks graphs by substitution and discusses which input values are allowed.
Keep practice aligned with the child’s current class. If the pupil still reverses x and y, adding simultaneous equations will not repair the core issue. If the tables are correct but the plot is wrong, work on scale and position. Each error type needs a specific explanation.
Progress is shown when the teenager can connect an equation, table, graph and verbal interpretation without guessing from the picture.
What a Punggol parent should ask the Mathematics department
Ask which coordinate, linear-function and gradient skills appear in the current G3 Secondary One term, how graph paper and technology are used, and what constitutes enough working. The MOE 2024 syllabus defines the broader scope; schools decide their actual pacing and assessment format.
If the child repeatedly misreads graphs, identify whether the issue is axis scale, ordered-pair direction, algebraic substitution, intercepts or gradient reasoning. A focused correction and one unfamiliar diagram often help more than a full page of repeated plotting.
PG3 marks a school-entry route. Mathematical confidence grows when pupils explain how two variables relate, why a line has its gradient and whether the model is plausible in context.
Frequently asked questions
Are linear functions part of G3 Secondary One Mathematics?
Yes. MOE’s G3 Secondary One syllabus explicitly lists coordinates, y = ax + b, straight-line graphs and gradients.
Is PG3 the same thing as a mathematical function?
No. PG3 is an admission posting group, while a function is a mathematical relationship.
Which coordinate comes first in (x,y)?
The horizontal x-coordinate comes first.
What does y = ax + b mean?
A linear function with gradient a and y-intercept b.
How is gradient calculated?
Vertical change divided by horizontal change between distinct points on a nonvertical line.
What does a negative gradient show?
The output decreases as the input increases under standard axes.
What is the gradient of a horizontal line?
Zero.
What is the gradient of a vertical line?
Undefined, because horizontal change is zero.
Does a straight-line graph always describe real data exactly?
No. It may be a model based on assumptions, with real observations that differ.
Are linear and directly proportional relationships identical?
No. Direct proportion passes through the origin; a linear relation can have a nonzero intercept.
Are quadratic functions also straight lines?
No. Their graphs are parabolas and are developed in later G3 content.
What is the first useful checking step?
Read the axes, predict gradient and intercept, and verify plotted points by substitution.
Continue the What is PG3 Punggol education series: PG3 G3 Science Reproductive System and Puberty | PG3 G3 History Japanese Occupation and Punggol Beach | PG3 G3 History Self-Government, Merger and Independence
Official Mathematics syllabus and related Punggol guides
- MOE G2/G3 Mathematics syllabus (2024 edition), G3 Secondary One N6 Functions and Graphs
- MOE Full Subject-Based Banding and subject-level flexibility
- What is PG3: G3 Mathematics Linear Equations and the Balance Method
- What is PG3: G3 Mathematics Geometry and Coordinates
- What is PG3: G3 Mathematics Statistics and Data Graphs
- Clementi reference: Secondary 1 Mathematics Tutor Small Groups Tutorials
Your next step
Ask your child to create a table for y = 2x + 3 with x = −2,0,1,2. Plot the points accurately, state the gradient and intercept, and confirm one plotted point by substitution. Then compare the line with y = −x + 3 and explain what changed. Use the receiving school’s G3 Mathematics scheme for the actual assessed sequence.


