
PG3 means Posting Group 3, the Secondary 1 school-admission route under Singapore’s Full Subject-Based Banding system that normally starts most academic subjects at G3. It is not a special statistics examination or proof that every child is ready to interpret unfamiliar graphs. G3 Mathematics includes Statistics and Probability as one of its core strands. The immediate skills for Punggol Secondary 1 families are reading tables accurately, distinguishing a sample from a population, describing patterns, interpreting averages and recognising when data do not support a claim.
MOE’s G2 and G3 Mathematics syllabuses organise learning across Number and Algebra, Geometry and Measurement, and Statistics and Probability, emphasising reasoning and problem-solving beyond routine calculation. For older examination cohorts, SEAB’s 2027 SEC G3 Mathematics K310 syllabus confirms these strands. Those examination documents do not mean a pupil starting Secondary 1 in 2027 sits that year’s national papers. Parents should follow the receiving school’s actual teaching sequence and use simple, clearly hypothetical examples to develop statistical judgement.
- PG3 is the entry Posting Group; G3 is an individual subject level under Full SBB.
- Statistics summarises evidence; probability describes uncertainty under stated assumptions.
- Read title, source, units, scale, time frame and population before interpreting a graph.
- Mean, median and mode describe different aspects of a dataset; none is always the best summary.
- Range is a simple measure of spread and does not reveal every detail of variation.
- Sample size and selection method determine what can reasonably be generalised.
- An equally likely probability is favourable outcomes divided by all possible outcomes, using a clearly defined sample space.
- A correlation in a graph does not automatically establish causation.
- Use school-specific G3 tasks and official MOE and SEAB syllabuses for the correct year.
Definition lock: five statistics quantities and their uses
| Idea | What it describes | Frequent error |
|---|---|---|
| Mean | Numerical sum divided by count | Assuming a mean must be a recorded value |
| Median | Middle of ordered values | Not sorting before selecting |
| Mode | Most frequent value or category | Confusing most frequent with largest |
| Range | Maximum minus minimum | Treating range as the complete distribution |
| Probability | Likelihood under a stated model | Assuming all outcomes are equally likely without justification |

Chapters
- Why statistical thinking belongs in Secondary 1
- Definition lock: data, statistics and probability
- A graph title should answer ‘what is being shown?’
- Bar charts and their zero baseline
- Line graphs and changes over time
- Pictograms and charts with repeated symbols
- Frequency tables organise repeated observations
- Mean is a numerical balance point
- Median tells a different story from the mean
- Mode is about frequency, not size
- Range describes spread only roughly
- Outliers can change the story
- Population and sample are not the same
- Sampling method can introduce bias
- Percentage comparisons need matching denominators
- Correlation is not automatic causation
- Probability begins with a clearly defined experiment
- Probability values lie between zero and one
- Complementary events offer a quick check
- Independent and dependent events need care
- Expected values are models, not guarantees
- Data dashboards can be attractive but incomplete
- Punggol provides contexts, not invented statistics
- How Statistics connects to Science and Humanities
- A four-week Statistics and Probability practice sequence
- What Punggol parents should ask Mathematics teachers
Why statistical thinking belongs in Secondary 1
Students encounter statistics long before a formal examination question appears. A timetable reports arrival times, a weather forecast reports probabilities, and a school notice may summarise participation numbers. Numbers can improve decisions only when a reader understands what they count and how they were obtained. A pupil who copies a value accurately but misinterprets its meaning has not yet developed statistical literacy.
Imagine a fictional survey of ten classmates about preferred reading genres. Six pupils select fantasy, three choose mystery and one chooses science writing. The figures describe this small group under the survey’s conditions. They do not prove that sixty percent of all students in Punggol prefer fantasy. Learning that distinction is more useful than memorising a percentage calculation in isolation.
Parents should encourage children to ask what question the data answer. This habit can be used in Mathematics, Science, Geography and ordinary conversations about news or consumer claims.
Definition lock: data, statistics and probability
Data are recorded observations or values relating to a question. Statistics involves collecting, representing, summarising and interpreting such information. Probability concerns the likelihood of outcomes under a model or stated assumptions. These ideas overlap, but they should not be conflated. Counting bicycles at one path is data collection; summarising the counts is statistics; assigning probabilities to future outcomes requires additional reasoning and evidence.
A bar chart of student survey responses does not automatically establish the probability that a random Punggol resident prefers one activity. The first refers to observed responses in a selected group, while the second needs a clearly defined population and sampling assumptions. A numerical fraction can be calculated correctly and still answer the wrong question.
Ask the learner to say whether a task is recording what happened, describing a pattern, or predicting uncertain outcomes. The wording often tells you which mathematical move is appropriate.
A graph title should answer ‘what is being shown?’
Before interpreting a chart, read its title, source, axis labels, units and the period represented. A graph labelled ‘Daily library visitors in one hypothetical week’ differs from a chart of ‘Monthly book loans across all branches’. The first counts visits, the second counts items borrowed, and they cannot be treated as equivalent measures of reading habits.
Students sometimes jump to the tallest bar without noticing that the categories represent different populations or periods. Ask the child to explain exactly what each axis measures before comparing bars. If the graph lacks a necessary label, a careful response notes the missing information rather than inventing a convenient interpretation.
A good data reader resists dramatic conclusions until the basic description is correct. That simple order prevents many avoidable assessment errors.
Bar charts and their zero baseline
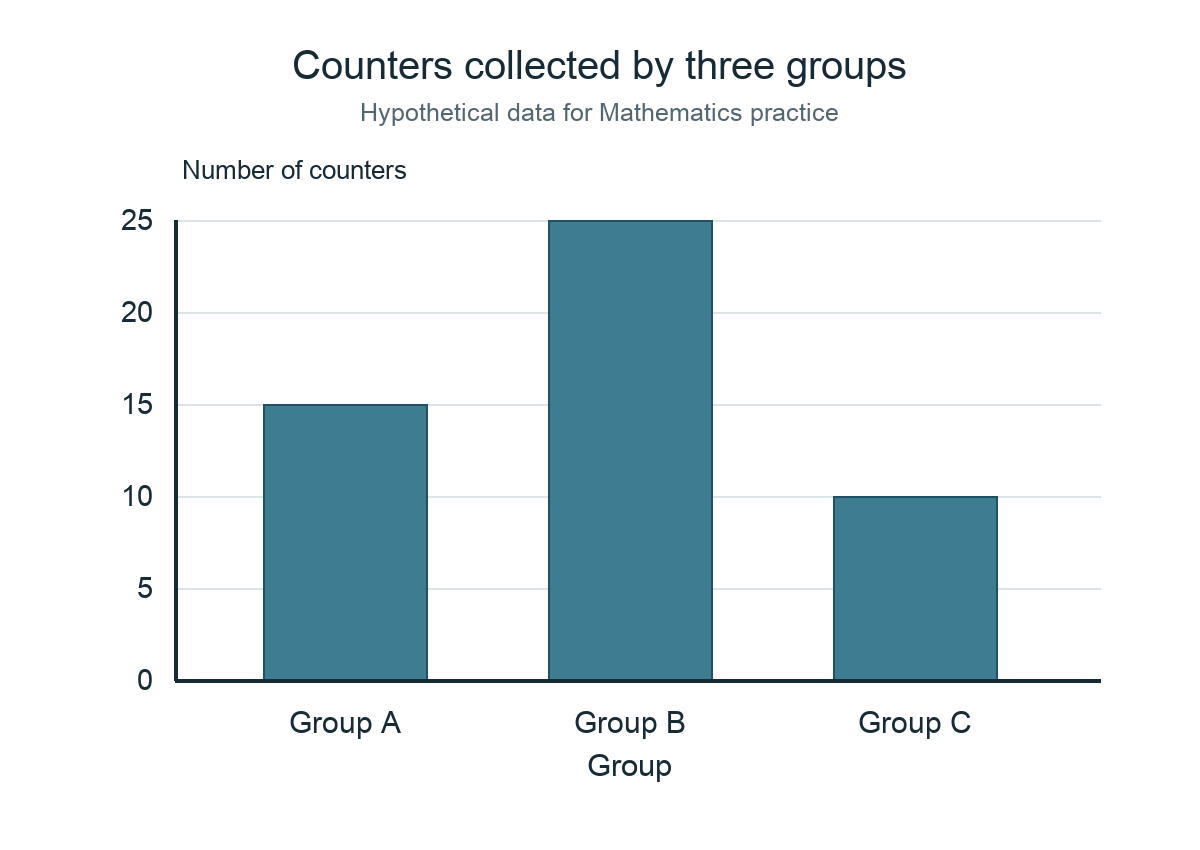
Bar charts commonly compare quantities across categories. A standard bar chart uses a numeric scale, and an appropriate baseline helps readers assess relative differences. A truncated vertical axis can exaggerate small changes. Students should inspect the tick marks rather than assume each visual step represents one unit.
Suppose a fictional chart compares three book-club groups with 10, 15 and 20 registered pupils. Group C has twice Group A’s recorded count, but that does not mean its members read twice as many books. Registration and reading volume are different variables. The child should separate the observed quantity from the suggested behaviour.
At home, draw the same numbers on a properly labelled chart and ask what happens to the impression when the scale changes. Accuracy is not only about arithmetic but also about honest representation.
Line graphs and changes over time
A line graph often shows how a variable changes across ordered values such as time. The direction and steepness of a line can suggest increases, decreases or a period of little change. Yet interpretation depends on the axis scale and the intervals between observations. Connecting points is a visual convention, not proof that every moment between them was measured.
Imagine invented visitor counts of 20, 25, 25 and 30 during four equal observation periods. The graph shows an overall increase with a flat interval. It does not reveal whether the weather, event schedule or time of day caused the pattern. Such explanations would require additional evidence.
Ask the pupil to write one directly supported observation and one hypothesis that remains unproved. This trains the difference between reporting and causal explanation.
Pictograms and charts with repeated symbols
Pictograms represent quantities using icons. Their simplicity can disguise an important question: what does one symbol stand for? If one icon represents five people, three icons correspond to fifteen people. When a half symbol appears, the key must clarify how it should be interpreted. Students should avoid counting pictures as though every icon always means one person.
An original exercise can compare two categories shown by four and seven symbols with a key of two items per symbol. The counts are eight and fourteen, with a difference of six. The pupil should explain the key and the arithmetic instead of relying on a visual guess.
Pictograms are useful for younger learners, but the same habit of reading legends applies to maps, infographics and sophisticated statistical dashboards.
Frequency tables organise repeated observations
A frequency table shows how often a value or category occurs. Consider the fictional values 2, 3, 3, 4, 4, 4, 5. The frequencies are one, two, three and one respectively for values 2 through 5. Recording the values in a clear table allows the reader to see which number appears most often and how many observations were collected.
A common error is to confuse the value with its frequency. A student may say that 4 is the largest value because it has the highest count, even though 5 is numerically larger. The mode is the most frequently occurring value; the maximum is the largest observed value. These answer different questions.
Ask the pupil to reconstruct the original data from a frequency table and check the total count. This is a simple but powerful test of understanding.
Mean is a numerical balance point
The arithmetic mean is the total of the observations divided by the number of observations. For a fictional set of four daily counts—4, 6, 8 and 10—the mean is 28 divided by four, which is 7. It summarises the numerical centre under a particular definition. The student should not confuse the mean with a value that must actually appear in the dataset.
A mean of seven does not require any single observation to equal seven. It also responds to unusually high or low values. When one observation becomes much larger, the mean may shift substantially. The pupil should think about what that would mean for the question being asked.
Parents can ask whether the mean is a suitable description of the whole group or whether variation and unusually large observations need to be discussed too.
Median tells a different story from the mean
The median is the middle observation when data are arranged in order, or the mean of the two middle observations when there is an even number of values. For 2, 3, 4, 20 and 21, the median is 4 even though the arithmetic mean is 10. The two statistics differ because the larger observations pull the mean upward.
A student should first sort the values. Trying to find the median in an unsorted list often produces errors. When the list contains an even number, identify the correct two middle positions and calculate their average. The method depends on the number of observations, not on which figure looks most typical.
Ask what the median explains and what it conceals. It identifies a central position but does not reveal the full distribution.
Mode is about frequency, not size
The mode is the value or category appearing most often. In the fictional list 1, 1, 2, 3, 3, 3, 4, the mode is 3. A dataset can have two or more modes, or lack a unique mode. The mode is often especially useful for categorical information such as a most commonly selected option, where calculating a numerical mean may make no sense.
Some pupils assume ‘mode’ always means one value. Give them an example such as 2, 2, 4, 4, 7, where both 2 and 4 occur most often. The student should describe the tie accurately rather than arbitrarily choose the larger number. A clear frequency table makes this visible.
Use mode to answer the question it can answer, and avoid claiming that it represents every person’s preference.
Range describes spread only roughly
The range is maximum minus minimum. In the fictional set 5, 7, 7, 8 and 15, the range is 10. It provides a quick sense of the span covered by the data but does not show how values are distributed within that span. Two datasets can share the same range and have very different patterns.
A pupil who finds the range correctly should still ask whether the difference matters in context. A ten-minute variation in travel time is different from a ten-degree temperature variation. The numerical operation is straightforward, but interpretation requires units and purpose.
Teach the child not to declare a dataset ‘consistent’ solely from a narrow range without understanding the data collection and relevant comparison.
Outliers can change the story
An unusually distant observation may be called an outlier, depending on the relevant definition and context. Outliers can arise from genuine variation, measurement problems or unusual events. They should not be erased merely to make a graph look tidy. The student should investigate what is known about the value and whether it is valid for the question.
Imagine one unusually high number in a short list of library visits. It might be due to a special event, a different counting period or a recording error. Without checking, the pupil cannot know which explanation applies. A single unusual value may raise the mean while leaving the median comparatively stable.
A good learner asks what changes when the value is included or excluded and whether exclusion is justified. Statistical honesty begins before a final answer is written.
Population and sample are not the same
A population is the entire set about which a question seeks information, while a sample is the subset actually examined. Surveying twelve classmates may reveal their preferences but cannot automatically describe every secondary pupil in Singapore. The issue is not that small samples are always useless; it is that a claim must fit the method and the group observed.
Students should identify the target population explicitly. If a survey aims to understand the reading preferences of one class, surveying that class may be informative. If the target is all Punggol teenagers, one class from one school is a narrow and potentially unrepresentative sample.
Ask the child whom the data include and whom they exclude. This prevents a calculation from becoming an unjustified generalisation.
Sampling method can introduce bias
An apparently large sample can still be misleading if selected in a way that favours one type of respondent. A questionnaire about cycling sent only to a cycling club is unlikely to represent all neighbourhood residents. The issue is selection bias rather than a simple arithmetic mistake. Students should consider how the sample was obtained.
A fictional study comparing preferences at a public path might be affected by observation time and weather. An early weekday morning may attract different users from a weekend afternoon. If the researcher observes only one period, a broad conclusion would be too strong.
Teach the learner to write one practical limitation of the method and one way to improve it. This is evidence of statistical judgement, not a weakness to conceal.
Percentage comparisons need matching denominators
Percentages express a part of a defined whole. If eight of twenty respondents choose an option, the proportion is forty percent. If another group has twelve of sixty, the proportion is twenty percent. Comparing only the counts might make twelve appear more popular, while the percentages reveal different relative participation. Both figures may be relevant, depending on the question.
Students must ask what the denominator represents. Are the proportions based on all pupils, attendees or only those who answered a question? If the bases differ, a direct comparison may be misleading. The correct calculation cannot repair an undefined or inconsistent denominator.
Practice stating the group and count before the percentage. A well-written answer says forty percent of twenty respondents, not merely forty percent of an unspecified population.
Correlation is not automatic causation
Two variables may rise together without one causing the other. Both might respond to a third factor, or the apparent relationship could be coincidental in a small dataset. Students should not turn a graph into a causal explanation solely because two lines move in similar directions. A cause-and-effect claim requires a suitable method and additional evidence.
Suppose a fictional monthly graph shows more ice-cream sales and more park visitors as the weather becomes warmer. It would be premature to claim that ice-cream purchases caused people to visit parks. Temperature, school holidays and other conditions could influence both. The example makes the importance of possible confounders concrete.
Ask the pupil to identify one alternative explanation before accepting a causal claim. This habit is useful in Science, public discussion and consumer decisions.
Probability begins with a clearly defined experiment
In elementary probability, we define the possible outcomes of an experiment or chance process. A fair six-sided die has six equally likely face outcomes. The probability of obtaining a 2 is one out of six, while the probability of an even result is three out of six, or one-half. The fraction depends on both the favourable outcomes and the full sample space.
The word ‘fair’ is an assumption, not something every physical die or process satisfies automatically. If outcomes are not equally likely, counting favourable outcomes and dividing by the number of outcome labels may give an incorrect probability. Always check what the problem states.
Parents can use a paper diagram of a die’s possible outcomes without turning probability lessons into gambling or repeated wagers.
Probability values lie between zero and one
A probability of zero describes an impossible outcome within the stated model; one describes a certain outcome. Values between represent different degrees of likelihood. Percentages from zero to one hundred percent express the same scale. Students should recognise that a probability greater than one or negative probability is invalid for an ordinary event.
Suppose a pupil calculates seven favourable outcomes out of six possible equally likely outcomes. The result exceeds one, signalling an error in the sample space or counting. A reality check is useful even before identifying exactly what went wrong.
Probability does not guarantee short-run results. An event with a one-half model probability need not occur exactly five times in ten trials.
Complementary events offer a quick check
The complement of an event consists of outcomes where that event does not occur. Within a defined sample space, the probabilities of an event and its complement sum to one. If a fair die shows an even number with probability one-half, it shows an odd number with probability one-half. The two events cover all possible outcomes without overlap.
For an invented scenario where the probability of an event is 0.3, its complement is 0.7. This is straightforward only when the event and its complement have been defined correctly. Students sometimes confuse ‘not A’ with an entirely unrelated event B.
Ask the child to list the possible outcomes before using the shortcut. A reliable definition comes before subtraction.
Independent and dependent events need care
Two events are independent when knowing one occurred does not change the probability of the other in the model. This idea becomes more formal at later stages, but the intuition is useful: replacing an item after a draw can create a different model from drawing without replacement. Students should follow the exact conditions in their assigned topic rather than assume independence automatically.
Suppose a bag contains three red and two blue counters. If a counter is removed and not replaced, the composition of the bag changes. The next probability can differ depending on the first draw. In a separate model where the counter is replaced before drawing again, the probabilities may remain the same.
A parent can discuss the difference using paper diagrams; avoid presenting advanced probability trees as a universal Secondary 1 requirement if the school has not introduced them.
Expected values are models, not guarantees
An expected count can be useful over many trials, but it should not be mistaken for a promised exact result. If a fair coin has a one-half probability of heads, one might expect roughly fifty heads in a hundred tosses under the model. Actual results can differ. The expected value summarises a mathematical model, not a prophecy about one sequence.
Some students incorrectly call a coin biased whenever a short run contains several identical outcomes. Random variation can produce streaks. Assessing whether a process is fair requires more careful evidence and methods than a handful of trials.
Parents can teach that probability describes uncertainty rather than eliminating it. This is useful when students encounter health statistics, weather information or forecasts.
Data dashboards can be attractive but incomplete
Modern charts may show multiple colours, filters and interactive labels, but an elegant dashboard can still conceal missing data, sampling bias or outdated definitions. A student should identify the underlying measure before making a claim. A graph called ‘engagement’ may count clicks, attendance or completed work, and those are not equivalent.
Imagine a school project dashboard comparing two clubs. If one club measures registrations and another measures active participants, a visual ranking is not fair. The child should ask whether the categories and dates are comparable. Better design alone cannot fix incompatible data.
Teach readers to look for a source note, data period and definition. Honest uncertainty is more informative than a polished unsupported conclusion.
Punggol provides contexts, not invented statistics
Punggol’s libraries, transport, parks and community facilities can inspire Mathematics questions about counts, schedules and comparisons. A family may create hypothetical data about bus arrivals or reading habits to practise methods. Those numbers must be labelled as fictional. A parent article should never invent actual ridership, school examination marks or library visitor figures to make a local example sound authoritative.
If a child uses real data, prefer official dated sources and record the definition of the measure. Explain what the published numbers cover and what they leave out. An official forecast may also need to be distinguished from an observed result.
A short honest example often teaches more than a dramatic unsupported statistic. The goal is to understand how evidence can be summarised without pretending a mathematical formula verifies the source.
How Statistics connects to Science and Humanities
Science investigations rely on reliable measurement and meaningful data summaries. Geography uses maps, observations and sample-based comparisons. History and Social Studies may ask whether a numerical claim describes its period and population correctly. The same basic questions apply: what was counted, how was it collected, and what interpretation is justified?
A student studying a hypothetical weather dataset should inspect the measurement method before calculating an average. A pupil evaluating a public opinion chart should consider how respondents were recruited. Both tasks require more than arithmetic.
Parents can encourage the child to explain one data conclusion in ordinary language, then identify one limitation. This develops transfer across subjects and supports responsible reading outside school.
A four-week Statistics and Probability practice sequence
In week one, practise frequency tables, bar charts and line graphs using clearly labelled fictional data. In week two, calculate mean, median, mode and range, comparing what each reveals. In week three, investigate samples, percentages and misleading claims. In week four, introduce appropriate probability questions and ask students to justify the sample space and model assumptions.
Keep sessions brief and leave room for other school subjects. A pupil who repeatedly confuses mode and maximum needs a targeted correction, not more difficult probability tasks. Review the same idea later using a fresh dataset to check whether the concept is retained.
Progress means the teenager can explain the numbers, identify what they do not show and choose a suitable method without guessing. That is more meaningful than finishing an entire book of graphs.
What Punggol parents should ask Mathematics teachers
Ask which Statistics and Probability topics are taught in the actual school year and how reasoning is assessed. MOE’s G3 Mathematics syllabus spans multiple years, so a parent’s online list should not be presented as a promise that every topic appears in Secondary 1. The school’s current scheme of work and teacher feedback are the relevant guides.
If the child struggles, find the precise cause: inaccurate reading of scale, confusing mean and median, inappropriate generalisation, or a poorly defined probability sample space. These are different misconceptions requiring different explanations.
PG3 describes an academic starting route. Statistical confidence develops when students make accurate calculations, give meaning to the results and recognise the limits of the evidence.
Frequently asked questions
Does PG3 mean a separate statistics exam?
No. PG3 is a school-entry group and Statistics and Probability is one strand of G3 Mathematics.
Are all topics in this guide taught in Secondary 1?
Not automatically. The syllabus spans several years, and school sequencing should be verified.
What is the mean?
The total of numerical observations divided by the number of observations.
How is median different?
Median is the middle position after sorting the data, and may differ substantially from the mean.
Can a dataset have two modes?
Yes. If two values share the highest frequency, both can be modes.
Is range a complete measure of variation?
No. It captures the difference between maximum and minimum but conceals many distribution details.
Does a class survey represent all Punggol teenagers?
No. The target population and sampling method must support the generalisation.
What does a probability of one-half mean?
Under the specified model, the event has one-half probability, not a guarantee of exactly half the outcomes in a short sequence.
Is a rising line proof of a cause?
No. Causal conclusions require additional evidence and suitable methods.
Can public data be used for schoolwork?
Yes, subject to teacher instructions. Cite the current original source and define what the numbers measure.
Does the 2027 SEC K310 paper apply to a 2027 Secondary 1 student?
No. It is the 2027 graduating cohort’s examination syllabus.
What is the first useful checking habit?
Read title, units, source, date and denominator before interpreting or calculating.
Continue this PG3 subject-skills series: PG3 Science Particle Models and Physical Changes | PG3 English Expository Writing and Editing | PG3 Geography Sustainable Cities
Official references and related PG3 guides
- MOE G2 and G3 Mathematics syllabus, Secondary One to Four
- SEAB: 2027 G3 Mathematics K310 national examination syllabus
- SEAB 2027 SEC G3 school-candidate syllabus list
- Singapore Department of Statistics: official data and definitions
- What is PG3: Geometry, Measurement and Spatial Reasoning
- What is PG3: Science Laboratory Safety and Practical Reports
Your next step
Give your child one small fictional dataset. Ask them to draw a correctly labelled chart, calculate mean, median, mode and range, and write one supported observation and one statement that cannot be proved from the data. Then use a fresh example to test whether the reasoning transfers. Keep the actual school’s Statistics and Probability teaching sequence as the main guide.


