
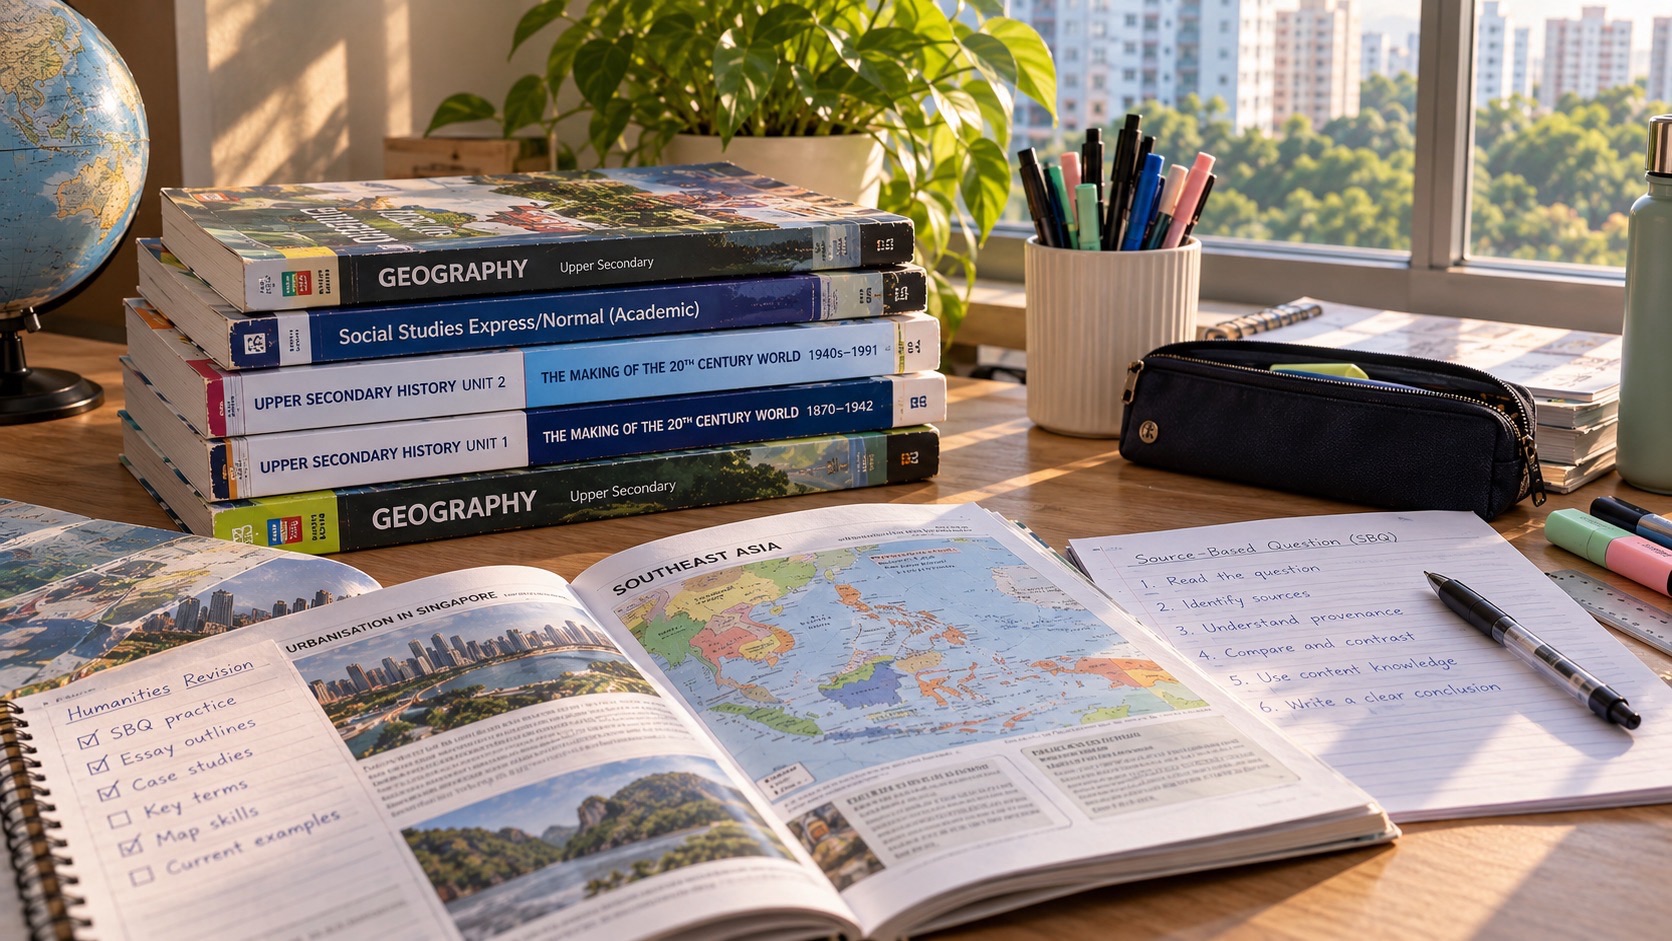
A Punggol student admitted through Posting Group 2 (PG2) can learn lower-secondary G2 Geography by investigating how people use water, housing, transport and public spaces, while using maps and evidence to answer specific questions. PG2 is a Secondary 1 admission group; G2 is a curriculum level for an individual subject, and families should confirm the child’s actual Humanities class. Geography is not simply memorising place names. Students need to locate information, explain patterns, compare possible causes and recognise what their evidence cannot establish.
Punggol’s waterway, residential neighbourhoods, LRT loops and MRT connections make geographical ideas easier to visualise, but they do not automatically provide a complete dataset or an official school fieldwork site. The MOE lower-secondary Geography syllabus addresses natural-resource management, sustainable cities and geographical investigation, while individual teachers specify their own approved inquiry tasks. This guide helps parents and teenagers practise map reading, inquiry questions, source checking, simple data analysis and thoughtful explanation using clearly labelled hypothetical examples and safe, supervised activities.
- PG2 and G2: school posting and subject curriculum levels are different parts of Full SBB.
- Key themes: natural resources, sustainability, settlements, housing and transport within the relevant lower-secondary syllabus.
- Start with a question: define the location, variable, people or process being investigated.
- Maps: read date, legend, scale, orientation, boundaries and status of features.
- Evidence: distinguish published datasets, actual observations, assumptions and invented practice values.
- Fieldwork: follow teacher instructions and public-space safety; do not collect water, wildlife or strangers’ data without permission.
- Transport: compare accessibility using full routes and stated criteria, not straight-line distance alone.
- Writing: describe a pattern, offer a justified explanation and acknowledge limitations.
- Next step: investigate one Punggol question through an appropriate source and write a short independent conclusion.
Definition lock: PG2 tells us how a child entered; Geography requires geographical thinking
Posting Group 2 is used for Secondary 1 admission under Full Subject-Based Banding. A student’s subject timetable may contain G1, G2 or G3 levels in different subjects. A PG2 entrant may be offered a particular level of Geography or Humanities depending on the school and eligibility, so the actual timetable and syllabus matter more than the original posting label. This article illustrates lower-secondary G2-style geographical reasoning without pretending that every school follows one identical fieldwork schedule.
Geography asks how places, environments and people interact. A strong answer does not just say that Punggol has trains or water. It asks how those systems work, who uses them, which patterns can be observed and what factors may explain differences. A student who can frame a clear question and interpret suitable evidence is developing transferable geographical thinking. Those skills remain useful even when the child’s examination topics focus on places beyond Singapore.

Why Punggol works as a familiar example
Punggol combines residential districts, public amenities, an artificial waterway, transport interchanges, elevated LRT infrastructure and a developing business and education district. These features can illustrate ideas about urban planning and the interaction between people and environments. A teenager can recognise the everyday effects of land use or commuting more readily when the example resembles a journey they have actually made.
Familiarity, however, is not the same as evidence. A family may know that one LRT journey often feels longer than another, but that does not establish an objective average for every resident. A photograph of the waterway may show the appearance of a place at a moment, not its ecological condition. Good geographical teaching uses familiar questions as a beginning and then checks what information is available. Personal experience motivates inquiry; verified data and careful reasoning support the conclusion.
Read the actual school topic sequence
The MOE lower-secondary Geography teaching and learning syllabus published for the 2021 cycle includes natural resources, tropical rainforests and mangroves, housing, transport systems and geographical investigation. Those broad themes can connect with Punggol examples, but the child’s actual teacher decides the class’s assignments and sequence within current requirements. Do not assume that a particular neighbourhood park, reservoir or transport station will appear on the assessment.
Start with the school’s current lesson notes and identify the topic: natural resources, urban development, map skills or fieldwork. Then choose an everyday illustration that helps explain the principle. The local example is an aid to understanding, not a substitute for content specified in the national or school syllabus. If the class studies a different country, the student still needs to learn the relevant facts and context rather than answer every question with Punggol.
A geographical question needs boundaries
‘Why is transport important?’ is so broad that almost any answer seems relevant. A more useful practice question might ask how different stages of a fictional school journey affect total travel time. That identifies a phenomenon, a location type and a measurable outcome. Another question might compare how two hypothetical neighbourhood layouts provide access to a shared public amenity. Neither example requires a student to conduct unsupervised surveys or collect strangers’ personal data.
Ask what evidence could answer the question and what would remain outside the scope. A route example needs journey stages and appropriate timing information, not a general declaration that public transport is good. A map-based land-use question needs accurate map categories and a date, not a photograph alone. Narrowing the enquiry makes the reasoning stronger and the task feasible. A small answerable question is more valuable than an ambitious question the learner cannot investigate honestly.
The first move in map reading is to inspect the source
Every map has a publisher, purpose and time period. A transport diagram emphasises connections and stations, sometimes distorting physical distances for readability. A street map emphasises geography and access. A land-use planning map may distinguish existing features from planned uses. A historical map records conditions and conventions associated with its own period. Before making a claim, ask what the map is intended to represent.
The student should locate the title, legend, date, orientation and scale where provided. If a necessary feature is missing, acknowledge that the map cannot answer the question alone. Do not treat an attractive transport schematic as a ruler or calculate walking time directly from the visual distance between two station symbols. Different maps provide different kinds of evidence. The best map is the one suited to the actual question.
A legend is part of the evidence
Colours and symbols on maps have meanings specified by their keys. Green may represent parks on one map and a transport line on another. A dashed shape may indicate a proposal, a boundary or a path depending on the legend. Students should not assume that familiar colours have universal meanings. Ask the learner to point to the symbol and then locate its definition before explaining a spatial pattern.
A useful home exercise uses a public teaching map with a clear legend. The child identifies two categories, describes where they occur and states one possible relationship. If the legend is incomplete, explain why the interpretation would be uncertain. This teaches careful reading rather than visual guesswork. The same habit helps with diagrams in Science and charts in Mathematics: labels and units are not decorative, but essential elements of meaning.
Scale allows distance estimates but not a complete journey
Suppose a hypothetical printed map states that one centimetre represents 250 metres. Two points 4 centimetres apart on the map correspond to 1,000 metres at that scale, under the map’s stated geometry. That is a valid mathematical estimate. It does not mean that a pedestrian can walk exactly one kilometre between those points, because the actual route may curve around roads, construction zones or buildings.
Ask the student to distinguish straight-line distance, route distance and travel time. A journey can involve waiting, transfers and walking at different speeds, so time needs its own evidence. The map scale helps answer a particular geometric question, not every question about accessibility. These distinctions are important for Punggol families who use MRT and LRT connections and for Geography pupils interpreting settlement patterns. The student becomes stronger when they know the limitations of each measure.
The MRT and LRT are different parts of the transport system
Punggol MRT station provides a North East Line connection, while the Punggol LRT has elevated loops serving different residential areas. A teenager may know these features from daily life but still need to describe their function carefully. The existence of a station does not prove that every home is nearby, nor does the number of stops alone determine the total journey time. Transfers, access paths, waiting and mobility needs can change a passenger’s experience.
A school investigation could use publicly available network information to frame questions about connectivity, without inventing ridership data. Ask whether the map shows routes, frequency or actual crowding; usually it shows only some of those. If a claim about travel behaviour requires measurements, obtain an appropriate verified source or state the uncertainty. Transport Geography examines how systems affect people, but it does so through evidence rather than assumptions about everyone who lives in a neighbourhood.
Connectivity and accessibility are not synonyms
Connectivity describes how places are linked by a network. Accessibility concerns how easily people can reach a place, and may depend on travel time, cost, walking conditions, disability access or service availability. A map with many links can indicate strong network connections while concealing long or difficult journeys for particular users. Conversely, a simple direct walking route may offer excellent access even without many transport lines.
Ask the student to define which measure of accessibility the question requires. For a fictional school journey, the criterion might be total minutes from home to the correct school gate. For a public facility, it might include step-free access and waiting time. A single distance cannot represent every person’s experience. Explaining the chosen criterion is part of the geographical argument; the conclusion depends on what is being measured.
A comparison table should contain comparable information
Imagine an exercise with two fictional routes. Route A involves 8 minutes of walking, 5 minutes of waiting and 12 minutes travelling, for a total of 25 minutes. Route B involves 4 minutes walking, 11 minutes waiting and 8 minutes travelling, for a total of 23 minutes. Route B is faster under those assumed numbers, but its waiting time is longer and the difference in totals is small. The student should describe both the numerical result and the conditions of the comparison.
These values are invented for teaching, not measured LRT or bus times. If actual timing data were collected on one day, it would still be necessary to consider variation by time and service conditions. A good table labels every quantity and includes the same kind of information for both routes. Comparing an advertised train journey for one route with a full door-to-door time for another would be misleading.
Waterways are geographical systems, not merely scenery
Punggol Waterway is a visible local example for discussing interactions among water, built surroundings and public space. It can prompt questions about drainage, land use, ecological management and recreational design. But a photograph of water does not reveal its chemistry, quality, flow rate or environmental impact. Those claims need appropriate data and contextual evidence. Students should distinguish an observable landscape feature from a measured scientific property.
An appropriate homework activity could compare verified published descriptions of a water-management system and identify what each source says. A teacher-approved field visit may offer further learning under supervision. Families should not collect water samples, enter restricted areas or disturb wildlife on their own to make an assignment appear authentic. Geographical curiosity must work alongside safety and permission.
Urban water is connected to more than rainfall
Singapore’s water environment is shaped by rainfall, drainage infrastructure, reservoir management, land use and deliberate planning. A lower-secondary Geography enquiry can use these relationships to explore how cities manage resources and hazards. However, students should avoid assuming every canal, pond and reservoir has an identical function or that one visually appealing feature proves a system is environmentally successful.
Ask the learner to map a chain of reasoning: what resource or issue is being managed, which infrastructure or behaviour may influence it and what evidence would demonstrate an outcome? The student should then identify the source needed for each link. A general assertion that ‘the waterway solves flooding’ is too strong without suitable engineering and hydrological evidence. A careful account describes intended functions and distinguishes them from verified performance.
Rainforest and mangrove themes require real source checking
The lower-secondary Geography syllabus includes natural resources and ecosystems such as tropical rainforests and mangroves. Those topics can be connected to questions about biodiversity and environmental services, but a casual observation of greenery in Punggol does not establish that a particular site is a mangrove forest. Students should learn the relevant ecosystem characteristics and check species, location and environmental conditions through appropriate reliable sources.
A parent can use published photographs and verified educational material to compare features without collecting plants or animals. Ask which details support the identification and what remains uncertain. Avoid labeling an unfamiliar tree as a protected mangrove species from appearance alone. A learner who checks the distinction between a park landscape and a specific natural ecosystem is practising more accurate Geography. Respect for living environments is part of responsible inquiry.
Housing is a land-use question as well as a home-life question
Punggol’s residential development provides opportunities to discuss how housing relates to access, amenities, population and urban design. But one tower block does not establish the housing patterns of the entire district. Students should examine appropriate maps, planning documents or statistics for the question asked. Land-use zones and housing types must be read in context, including the year and whether a development is built or planned.
A useful fictional task might compare two neighbourhood layouts for the accessibility of a school, public transport and recreation. The student can identify trade-offs: a central amenity may be convenient for some residents but farther from others. Without population data, the learner should not claim a numerical proportion of people benefit. Good Geography treats built environments as systems of decisions and effects, not simply collections of attractive buildings.
A city plan is not a completed photograph of the future
Planning maps may show intended development, reserved land or potential infrastructure. Students sometimes treat a proposed label as proof that a building is already operating. That creates inaccurate reports about Punggol’s future. Before using a plan, check the source, publication date and terminology. Distinguish completed, under-construction, approved and conceptual features where official documents make the status clear.
This habit also improves everyday media literacy. A promotional rendering may help the reader visualise an ambition but is not evidence that every pictured feature exists. Ask what can actually be verified on a particular date. When the assignment concerns future urban sustainability, it is legitimate to discuss possible outcomes, but identify them as possibilities or forecasts rather than observed results.
Geographical investigation requires an ethical method
Geographical Investigation involves asking a question, selecting an appropriate method, collecting or using data and evaluating the evidence. The teacher’s brief may require fieldwork, secondary-source research or a mixture. For a lower-secondary child, methods must be safe and appropriate to the school’s rules. The existence of a public place does not mean pupils may interrogate strangers, film passers-by or take samples there without consent or permission.
Start with a desk-based feasibility check. Can the question be answered using official maps, published datasets or hypothetical practice material? If firsthand observation is genuinely required, follow the school-approved plan, supervision and consent procedures. A well-designed small investigation can teach more than an ambitious exercise whose methods are unsafe or too unreliable to justify the conclusion.
Define variables before collecting numbers
A fictional enquiry might ask whether two types of classroom maps lead to different navigation performance. The learner should identify the factor being compared, what outcome is measured and which conditions need to remain similar. A real fieldwork project may be more complicated because weather, time and other people’s behaviour affect outcomes. The purpose of identifying variables is not to pretend that social geography is a perfect laboratory. It is to recognise possible alternative explanations.
Ask the child what factors could influence the result and whether the method controls them adequately. If the comparison relies on participants, the school must handle permissions and privacy appropriately. For home practice, use fictional data rather than recruitment or collection of identifiable information. Clear methods make the subsequent analysis more trustworthy.
Data tables must record source and units
A table can be neatly formatted yet misleading if it combines values from different dates, units or geographic boundaries. A student comparing population, rainfall or transport data should identify the source of each figure and whether the categories are genuinely comparable. A percentage of residents is not the same unit as a number of trips. A graph comparing percentages across years must consider whether the underlying definitions changed.
For a practice example, use a table explicitly labelled hypothetical and ask the child to describe a pattern without presenting it as a real Punggol finding. Then show a genuine published table and examine its explanatory notes. The skill is not simply creating rows and columns; it is preserving the meaning of the measurements so that a reader can judge the conclusion fairly.
Read graphs without inventing the reasons for trends
A line graph may show a quantity increasing over a period, but the graph alone may not explain why. A bar chart may identify differences among areas without establishing the causes of those differences. Geography students should separate description from explanation. First state what the data show, using axes and units. Then use relevant geographical knowledge or other evidence to support a possible reason.
A student who sees a rise in a fictional urban-transport chart should not immediately assert that a new station caused it unless there is evidence connecting the events. Other factors such as population changes, measurement revisions or service schedules may matter. A good conclusion is appropriately cautious and identifies the limits of the data. This habit supports both examinations and responsible interpretation of public statistics.
Sample size and timing change what a result means
Suppose a hypothetical observation counts pedestrians in a location for five minutes during one afternoon. The count describes that window only. It cannot establish all-day, all-year usage or represent the preferences of an entire population. Weather, school dismissal, public events and the choice of location may influence the result. A student should record those conditions where relevant and describe the limited scope honestly.
This does not make short observations worthless. They can support a narrow learning question when clearly framed. The mistake is claiming that the observation tells more than it can. Ask what additional sampling would be necessary for a broader conclusion and whether the school project permits it. Geographical reasoning values accuracy of inference, not exaggerated certainty.
An aerial image still needs a date
An aerial photograph or satellite image can reveal broad spatial arrangements, but its date matters. A building may have been completed after the image was taken, while a construction site may later change considerably. Students should check when the image was captured and whether labels or overlays are current. Perspective and resolution also affect what can be identified reliably.
Do not use an old aerial image to announce that a current road is closed or that a new development has not opened. Compare with suitable updated sources before making factual claims. For a classroom exercise, a dated pair of images can support discussion of change over time if they are genuinely comparable. It remains necessary to distinguish observable physical change from an inferred planning reason.
Fieldwork safety is part of geographical method
Students should not stand near road traffic, enter waterways, collect wildlife or walk alone into unfamiliar areas to obtain data for a Geography task. A school-approved fieldwork activity should have its own risk assessment, supervision and permissions. Even apparently harmless photography may require attention to personal privacy and site restrictions. Parents can encourage curiosity without acting as though every question requires an unsupervised outing.
A safer home exercise might analyse published photographs, transport maps or a simple model neighbourhood drawn on paper. If a family visits a public park normally, the child may make casual observations without disturbing people or nature, but should not present them as an official school survey unless the teacher has approved the method. Ethical behaviour and accurate evidence are not competitors; both make the investigation educationally sound.
How to organise a geographical answer
A practical response can begin by describing the pattern or feature, explaining the relevant process and supporting the explanation with specific evidence. If the task asks for evaluation, discuss trade-offs or limitations. The exact structure depends on the question: a ‘describe’ prompt needs different work from an ‘evaluate’ prompt. Avoid filling every answer with a long paragraph about sustainable development if the question only asks for the direction of a trend.
Ask the child to underline the command word before writing. Then identify which evidence belongs in each part of the response. A sentence such as ‘Route A is longer than Route B in the supplied map’ requires the actual map scale or distance information. A statement that one route is better needs an explicit criterion. Clear written Geography is the ability to connect facts, processes and judgements in a way another reader can follow.
Evaluation should compare real trade-offs
Urban planning rarely offers a single solution that is best for every person. A transport option may reduce travel time for one group while requiring a longer walk for another. More housing may bring amenities and population growth while raising questions about infrastructure capacity. A green public space may serve recreation alongside other environmental purposes. Geography invites students to evaluate these tensions rather than repeat slogans about good development.
For a hypothetical comparison, let the child list who may benefit, who may face a cost and what information would be required to decide. Do not assume the same preference represents every resident. A cautious evaluation can still give a reasoned recommendation. The strength of the answer comes from criteria and evidence, not from sounding certain about a complex public issue.
A fictional Punggol student investigates travel access
Imagine a fictional learner, Daryl, who wants to compare the journey from two hypothetical housing blocks to a school. He initially calculates only the straight-line distance from a digital map and declares the closer block more accessible. His parent asks him to consider actual walking paths, transfers and waiting times. Daryl creates a fictional door-to-door table with equal categories for both routes and states his assumptions.
He discovers that the straight-line comparison is only one part of accessibility. He then asks what real-world evidence would be needed for a more reliable conclusion. This invented example does not claim a particular Punggol block has a better route or provide actual transport timings. Its purpose is to teach the method: define the measure, collect comparable information and interpret what the calculation can and cannot establish.
Another fictional student learns the limits of a park photograph
Imagine a fictional student, Alya, studying a picture of an urban green space. She writes that it is a highly biodiverse ecosystem because many plants are visible. Her teacher asks whether the photograph identifies the species or measures biodiversity. Alya realises that visible greenery alone cannot support the full claim. She revises her answer to describe the visible vegetation and identifies what additional scientifically valid information would be necessary.
The revision may sound less dramatic but is more accurate. This fictional example shows how geographical understanding grows through correction. A student should not be discouraged from asking environmental questions; they should be taught how to choose evidence suited to those questions. The ability to distinguish appearance from measurement is a transferable skill across Geography and Science.
A four-week map and inquiry routine
During the first week, use the assigned textbook maps to practise reading legends, scale, orientation and date. In the second, formulate a narrow question about a given fictional transport or resource-management example. In the third, organise the provided data, label units and write a description of the pattern. In the fourth, explain a possible relationship, evaluate limitations and retry the reasoning with a different map or dataset. This is optional home practice, not a compulsory school fieldwork schedule.
Keep the tasks proportional to the actual learner’s syllabus. If a teenager still confuses scale with travel time, repair that concept before attempting complex evaluations. If the child can describe graphs but cannot explain them, focus on relevant geographical processes. Progress is visible when the student handles an unfamiliar source independently, not when a parent produces a polished presentation on the child’s behalf.
What a Geography tutor should add
A useful tutor should help a student understand the specific question type, interpret evidence, connect processes and improve explanations. If the child repeatedly confuses a map’s legend or substitutes unsupported assumptions for data, the tutor should diagnose that misconception and offer a targeted correction. Repeating large numbers of past questions without inspecting the first error may reinforce the same weak approach.
A tutor cannot guarantee a school subject-level change or a particular assessment result. They can, however, teach the learner to read new sources carefully and justify a conclusion. That independent transfer is the standard the family should watch. If the student can handle a different map or data table with less prompting, the teaching has produced something durable.
Sources, related guides and your next step
Use MOE’s published lower-secondary Geography syllabus for the broad natural-resource, cities and inquiry framework, and the SEAB G2 2027 index only when checking the correct graduating SEC subjects. The lower-secondary school teacher’s current material controls the immediate Geography tasks. For safety in public spaces, refer to NParks etiquette.
For separate Humanities evidence interpretation, see the PG2 source-based Humanities guide. For applied community projects, consult the applied-learning guide. Your next step is to take one dated map, identify its legend and scale, then ask the child to describe one pattern and explain what additional evidence would be needed before making a strong claim.
Frequently asked questions about PG2 G2 Geography in Punggol
Does PG2 automatically mean G2 Geography?
No. PG2 is an admission group. Confirm the student’s subject offer and Humanities combination under Full SBB.
Is Geography only memorising Singapore locations?
No. It involves natural and human processes, evidence, geographical inquiry and careful explanations.
Can a transport diagram prove journey times?
Not by itself. Network links do not directly show waiting, walking, transfers or door-to-door travel time.
How should a student interpret a map’s colour?
Read the map’s legend, publisher and date rather than assuming one colour has a universal meaning.
Can a public Punggol park be used for unsupervised fieldwork?
Do not assume permission. Follow teacher supervision, safety and site rules; use desk-based sources where appropriate.
Does a photograph prove water quality or biodiversity?
No. Appearance alone does not establish chemical measurements or a valid biodiversity assessment.
What is a geographical investigation?
An evidence-based enquiry with a defined question, appropriate sources or methods, analysis, reasoning and reflection.
Should students collect commuter faces or personal details?
No. Protect privacy and follow school-approved ethical methods; fictional or published data can support practice.
What is the difference between describing and explaining a graph?
Description states the observed pattern with units; explanation uses relevant geographical concepts and evidence to account for it.
What is a useful first home exercise?
Choose one dated map, interpret its key, explain one pattern and identify a limitation of the source.
Editorial note: Published 1 November 2026. Travel times, routes and student scenarios described as hypothetical are invented for learning, not actual transport or fieldwork measurements. Always check the school’s current syllabus, fieldwork arrangements and sources before publication of a factual local claim.


