
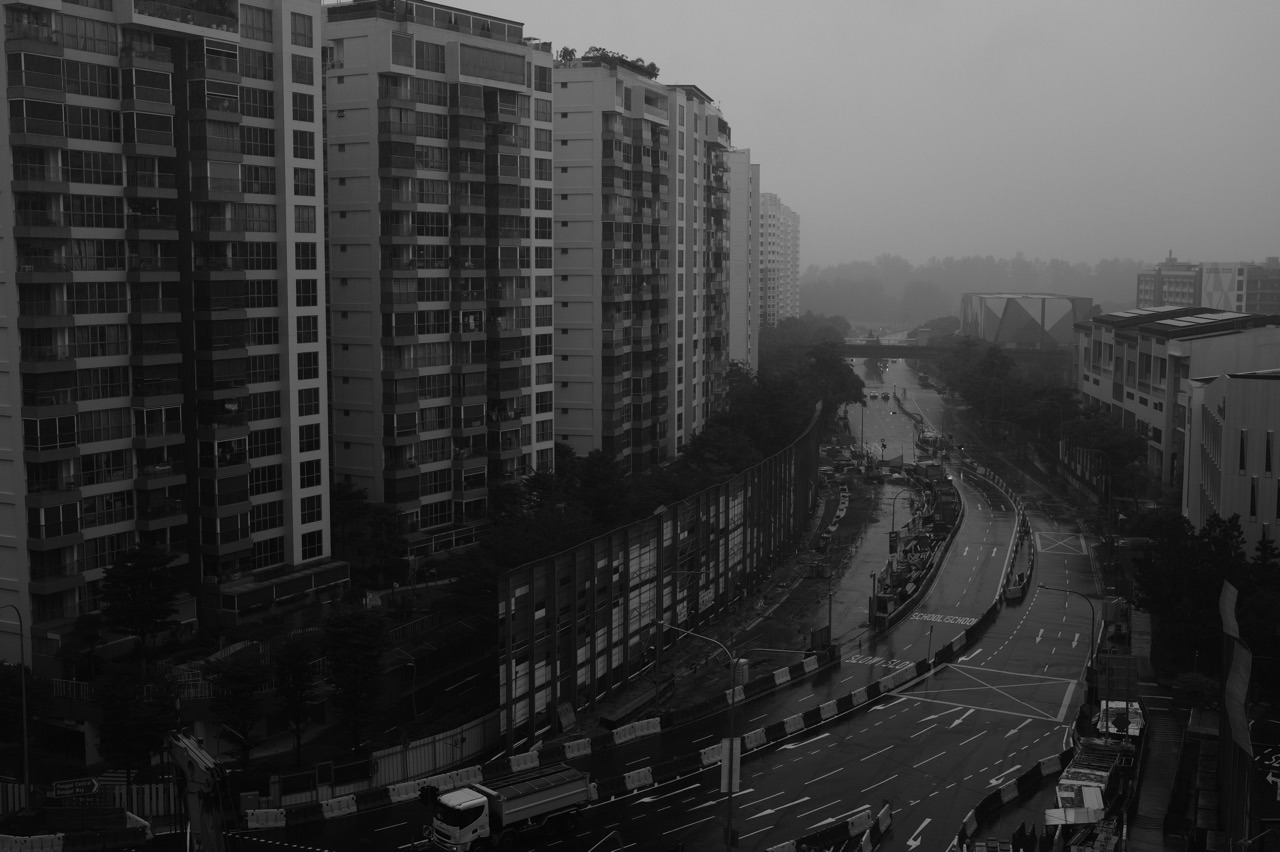
The top 10 things to do in Punggol for Meteorology students are to interpret a two-hour town forecast, compare weather outlooks at different time horizons, distinguish rainfall gauges from radar, learn the meaning of lightning alerts, draw wind-direction diagrams, read the UV Index correctly, compare WBGT heat stress with air temperature, investigate relative humidity, distinguish rain warnings from flood alerts and build a sourced weather-versus-climate notebook.
Best first exercise: use the Meteorological Service Singapore’s current two-hour forecast for Punggol and record the issue time, validity window, weather symbol and one appropriate decision for a hypothetical Waterway Park outing. Do not copy that forecast into an article as though it will be true next week. A forecast of thundery showers signals lightning risk and should never become an invitation to go outdoors to watch a storm.
This October 2026 guide is about how meteorological products are created and interpreted. A forecast, a measurement, a radar image, a lightning detection, a WBGT heat-stress level and a long-term climate average are different kinds of information. Worked numerical examples are fictional unless clearly linked to MSS or NEA’s published climatology, and an island-level station reading is not automatically the precise weather at one Punggol apartment.
Choose a meteorological investigation
- Short-range forecasting: learn two-hour nowcasts and their validity windows.
- Forecast uncertainty: distinguish regional twenty-four-hour and national multi-day outlooks.
- Observing instruments: learn what a rainfall gauge, radar, wind sensor and humidity sensor actually measure.
- Storm safety: interpret lightning warnings and flood alerts without creating a hazardous field experiment.
- Solar exposure: learn the Changi UV Index and the difference between heat stress and air temperature.
- Climate: compare seasonal monsoon patterns and long-run averages with specific weather events.
- Data work: build a timestamped, source-checked weather log and handle missing observations correctly.
The six pieces of metadata that every weather number needs
Write down the variable, unit, location or reporting region, observation or forecast time, accumulation or averaging period, and original issuing authority. A report of ten millimetres of rainfall needs a time window and gauge. A UV Index needs its observation station and timestamp. A WBGT value is not the same quantity as ordinary air temperature, even if both are expressed in degrees Celsius. A radar image represents spatial rainfall structure rather than a measured precipitation total at every home.
Next distinguish observation from prediction. A nowcast is issued for a future time interval, while rainfall observations describe water that an instrument has measured over a stated past period. A warning may combine measured conditions and forecaster judgement. A climate average aggregates many years and cannot tell a family if today’s school outing is safe. An article that puts all those products on one chart without labels creates false certainty.
The best student exercise identifies the first wrong inference. Sometimes the arithmetic is sound but the denominator is wrong. Sometimes a storm symbol is treated as a precisely timed strike. Sometimes an outdated screenshot is called live data. Correcting the source, time or unit is often more important than plotting another graph.
Ten Punggol meteorological learning activities
1. Compare the two-hour town forecast with a Punggol outing decision
Where: MSS two-hour nowcast for Punggol and a hypothetical Waterway Park family plan.
The weather-science question
The Meteorological Service Singapore publishes a two-hour town-centre forecast and explains that a thundery-showers symbol indicates an imminent lightning risk. The official nowcast is useful for a short outing, but it is not a guarantee that rain will begin or end at a particular bench on a precise minute. A weather forecast describes expected atmospheric conditions over a given validity window and location category. It is not the same thing as a measurement from a rain gauge in the student’s backyard.
How to investigate without risk
Open the current MSS two-hour forecast in a safe indoor setting. Record the issue time, validity window, named area and category, but do not copy the value into an evergreen article as though it will remain current tomorrow. Create a simple decision table for a fictional parent considering a waterway walk: favourable conditions, showers without lightning information, or thundery showers with lightning risk. For each decide what additional official warning must be checked and whether a safe indoor substitute is more appropriate. Repeat the desk exercise using a different forecast window.
Worked Punggol example
An illustrative nowcast says ‘Thundery showers, valid from 4pm to 6pm’. A student writes, ‘Lightning will strike the Punggol Waterway bridge at exactly 5pm.’ The forecast does not predict a specific strike, and the student’s inference is both unsupported and unsafe. The corrected conclusion is that thundery showers indicate a lightning risk and the outdoor plan should be reviewed against the latest official warning and safe shelter options.
An advanced question
Compare a two-hour forecast with the observed conditions after the validity window expires, if official archive data are available. Define what would count as correct for an area-level forecast and avoid judging the whole forecast by one narrowly selected apartment window. Ask how forecast spatial extent differs from a point sensor and why confidence may change during fast-developing thunderstorms.
Safety and interpretation limits
Do not stand outdoors waiting for a thunderstorm to test forecast accuracy. MSS cautions that lightning can occur more than 10km from the storm cloud; seek appropriate safety when warnings apply. Forecasts must be checked live for actual trips.
Official reference: Compare the two-hour town forecast with a Punggol outing decision. Use the current time-specific data for any actual decision.
2. Learn why the twenty-four-hour and four-day forecasts answer different questions
Where: MSS forecast pages for regional Singapore and general outlooks.
The weather-science question
MSS explains that it issues a two-hour forecast for town centres, a twenty-four-hour forecast for major Singapore regions, a four-day national outlook and a fortnightly outlook. Longer horizons can help with broad planning but usually cannot establish a precise local shower schedule days ahead. A student should not treat the 4-day outlook’s general message as identical to a Punggol-specific two-hour nowcast. Good meteorology begins by matching spatial and temporal scope to the decision.
How to investigate without risk
Create a planning matrix with columns for a trip starting in one hour, a school event tomorrow and a possible walk several days later. For each identify which forecast horizon is most relevant, its spatial scale and how frequently the information should be rechecked. Use the MSS FAQ as the source for the product definitions. Draw a hypothetical timeline showing how a four-day plan can be refined by the twenty-four-hour and two-hour products as the date approaches. Mark all sample weather symbols invented.
Worked Punggol example
A student sees a four-day forecast mentioning possible showers and tells a group that Punggol will be dry from 2pm to 3pm on the fourth day. The product does not justify that hour-by-hour local precision. The revised schedule says the outdoor event remains conditional and will be checked with the shorter-horizon guidance near the date. The learner has corrected overprecision rather than changed an actual forecast.
An advanced question
Discuss lead time, resolution and uncertainty. A broad national outlook may be useful for deciding whether to keep indoor alternatives ready, while a nearer town forecast supports immediate decisions. Ask what an app should show when a user requests precision that the original forecast cannot provide. The best answer may be a clear ‘hour and location not resolved by this source’.
Safety and interpretation limits
Do not make a trip booking or issue a public safety warning based only on hypothetical examples in a static article. Current MSS and responsible venue information take precedence at the actual time.
Official reference: Learn why the twenty-four-hour and four-day forecasts answer different questions. Use the current time-specific data for any actual decision.
3. Distinguish automated rainfall gauges from a radar image
Where: MSS rainfall observations and data.gov.sg rainfall readings.
The weather-science question
Rainfall gauges measure precipitation at particular station locations, while weather radar provides a spatial picture of echoes related to rainfall over a wider area. MSS explains that readings from automated instruments may have gaps or be corrected, and that local siting can influence observations. Data.gov.sg documents station-level rainfall readings with roughly five-minute updates. A colour-coded radar image and a numeric gauge value therefore answer related but different questions, neither of which is a direct measurement of rainfall at every square metre of Punggol.
How to investigate without risk
Read MSS’s observation guidance and the official data.gov.sg rainfall description. Construct a fictional table containing three station readings with names, timestamps and rainfall amounts for the same accumulation period. Beside it sketch a hypothetical radar grid showing a broad zone of stronger rainfall echoes. Ask what each representation can legitimately describe, and what must be verified before claiming a local event was heavier at one Punggol street. Keep real sensor identifiers and published timestamps if analysing actual data, but do not invent their readings.
Worked Punggol example
Illustrative station data show 4mm, 12mm and 7mm accumulated over an identical half-hour. The second station recorded the highest total in that fictional set, not necessarily the strongest rainfall at every point between stations. A learner who interprets the brightest radar colour as a measured 12mm value for an unsampled location has confused a spatial estimate with a point measurement. The corrected report preserves the measurement type and spatial limitation.
An advanced question
Explore what might cause an apparently inconsistent radar and gauge pattern: timing mismatch, different sampling intervals, radar processing or highly local convective rain. A stronger comparison synchronises times and uses appropriate interpretation of intensity versus accumulated depth. Develop a graph with a missing-data symbol instead of using zero whenever a station temporarily fails.
Safety and interpretation limits
Do not install instruments on roofs or exposed park structures, enter waterlogged drains or conduct sampling in thunderstorms. Rainfall data are subject to the official provider’s update and correction processes.
Official reference: Distinguish automated rainfall gauges from a radar image. Use the current time-specific data for any actual decision.
4. Study lightning alerts as a decision system, never as a viewing challenge
Where: MSS lightning information and a hypothetical Punggol Point Park or Waterway Park trip.
The weather-science question
MSS’s current FAQ explains that its lightning information service draws on detection sensors and distinguishes cloud-to-cloud from cloud-to-ground lightning. It also describes alerts when lightning is detected or thundery showers are forecast near a selected location, typically within a defined alert radius. An alert is not an invitation to find the storm visually. It is a risk-management message that should change outdoor decisions even if the sky directly overhead looks relatively bright.
How to investigate without risk
At home, read MSS’s lightning FAQ and draw a fictional decision tree. Inputs include a currently active lightning alert, a forecast of thundery showers, a visitor’s location and the availability of appropriate safe shelter. Outcomes should prioritise following official advice, stopping exposed activities and checking updates. Use an imaginary location marker without revealing a family’s home address. A student can explain why an alert radius is a safety screening rule rather than a prediction that lightning will hit a specific building.
Worked Punggol example
A student says, ‘There is no rain where I am, so the nearby lightning warning must be wrong.’ Lightning can occur away from the heaviest rain and even beyond ten kilometres of the storm cloud. The corrected reasoning recognises that visible local dryness does not cancel the risk information from official detection and forecasting systems. The safe choice is to defer an exposed coastal activity and use appropriate shelter.
An advanced question
Distinguish detection of a past lightning event from a forecast of conditions likely to produce more lightning. Discuss how an alert system balances missed events against false alarms, without asking anyone to experience the hazard. A software-design extension can model clear statuses such as warning active, no verified data and normal conditions, using fictional inputs.
Safety and interpretation limits
Never photograph storms from seawalls, bridges or isolated trees as a homework assignment. Do not conduct electrical or lightning experiments, and avoid assuming a mobile app has perfect real-time coverage.
Official reference: Study lightning alerts as a decision system, never as a viewing challenge. Use the current time-specific data for any actual decision.
5. Read wind direction correctly before discussing the Punggol coast
Where: MSS wind observations and an ordinary safe view near Punggol Point.
The weather-science question
MSS’s observation guide specifies that surface wind direction is the direction from which the wind blows. Thus an easterly wind travels from east toward west. It also explains standard measurement heights, while local buildings, land-sea contrasts and gusts can influence conditions. A coastal setting may prompt questions about sea breezes, but a visitor cannot infer the island’s official wind speed merely from moving leaves or a felt gust beside a building.
How to investigate without risk
Use MSS’s wind-measurement explanation to create a compass diagram. Draw arrows for an easterly, southerly and north-easterly wind and label the origin direction. Compare how a wind vane and an anemometer answer different questions. If a normal outing occurs under safe conditions, record only a qualitative observation such as ‘leaves moving’ and the time, without assigning an exact speed. Consult official station data for any quantitative reading and identify the station location rather than relabelling it a Punggol benchmark.
Worked Punggol example
A learner draws an arrow pointing east and labels it ‘easterly wind’ because the air is moving toward east. Under meteorological convention that would be a westerly wind, originating in the west. Correcting the arrow’s origin repairs the whole directional description. The learner then checks whether a source reports mean wind speed, gust or instantaneous reading before comparing numerical values.
An advanced question
Explain why winds fluctuate and are reported over averaging periods, and why measurement at roughly ten metres in a clear station location differs from conditions inside an urban canyon. Connect local sea-breeze hypotheses with land-water heating differences, while recognising that monsoon flows and thunderstorms may also influence the day.
Safety and interpretation limits
Do not release balloons, kites or measuring devices near rail tracks, high-rise roofs or power lines for this assignment. A coastal view is unsuitable during lightning or strong gusts. Preserve station metadata and avoid guessing local weather from a photo.
Official reference: Read wind direction correctly before discussing the Punggol coast. Use the current time-specific data for any actual decision.
6. Learn why an ultraviolet index reading is not a personal Punggol exposure value
Where: MSS UV Index and a shade-planning lesson using a public park or home.
The weather-science question
MSS says Singapore’s official UV Index is measured at the Changi Meteorological Station and reported at fifteen-minute intervals from 7am to 7pm. It can differ elsewhere under clouds or local conditions. The advisory recommends protection especially around 11am–3pm, when UV tends to be highest. A geolocated phone display therefore should not be described as a sensor measuring an individual’s exact skin exposure in Punggol. Meteorology students can study spatial relevance and the distinction between a public index and personal risk factors without intentionally staying in strong sunlight.
How to investigate without risk
Read MSS’s UV guidance and record the station, interval and meaning of its index categories. Draw a hypothetical outdoor schedule with a morning walk, midday activity and indoor alternative, identifying when checking current UV and weather guidance matters. Make a paper shade diagram rather than seeking peak sun exposure. Explain why clouds may reduce the measured index but do not make all outdoor exposure harmless. For a real activity, follow the latest official advice and sensible protective measures.
Worked Punggol example
A student sees an official UV Index value of 5 and writes, ‘UV Index at my Punggol home is exactly 5 right now.’ The Changi-based measurement cannot establish a private exact location value. The corrected statement names the official station, observation time and index category, then says local exposure depends on conditions and personal protection. A second error is treating a cloudy photograph as proof that sun precautions are unnecessary.
An advanced question
Compare the UV Index with air temperature and heat-stress information. Hot weather and ultraviolet radiation are related to the Sun but measured differently, and one number cannot substitute for the others. Consider how an inclusive public outdoor event should communicate sun, heat and lightning advice without promising uniform risk for everyone.
Safety and interpretation limits
Never stare at the Sun, use magnifying glasses to concentrate sunlight or ask children to stand outside at high-UV hours for comparison. Follow the current official advisory and individual healthcare advice where relevant.
Official reference: Learn why an ultraviolet index reading is not a personal Punggol exposure value. Use the current time-specific data for any actual decision.
7. Compare WBGT heat stress with ordinary air temperature
Where: MSS Heat Stress map or data.gov.sg WBGT observations, with Punggol fieldwork planned indoors.
The weather-science question
MSS explains that Wet-Bulb Globe Temperature (WBGT) combines air temperature, humidity, wind and solar radiation and differs from ordinary air temperature. Its reported WBGT is averaged over a recent fifteen-minute window, and the heat-stress levels apply to specified outdoor circumstances. The data.gov.sg WBGT dataset has been available since 2025. Students should not copy a 32°C air-temperature reading and label it WBGT, or assume a general index diagnoses a particular person’s medical condition.
How to investigate without risk
Open MSS’s current heat-stress page or the official dataset description. Make a variables diagram showing the influences used in WBGT assessment. Read the low, moderate and high advisory structure and its stated application scope. Create two hypothetical days with identical dry-bulb air temperature but different humidity, wind and sunlight conditions. Without trying to calculate WBGT from insufficient data, explain why their potential heat stress could differ. Keep numerical demonstrations clearly fictional and avoid unsupervised strenuous outdoor testing.
Worked Punggol example
Both fictional days have an air temperature of 32°C. Day A is shaded and breezier; Day B has strong solar radiation and high humidity. A student says WBGT must be 32°C on both days because the ordinary temperature is the same. That conclusion ignores the additional inputs and confuses measures. The corrected response notes that actual WBGT requires a suitable measurement or validated calculation, not a guessed adjustment.
An advanced question
Discuss how a model could incorrectly treat WBGT as a direct thermometer value and why timestamp and station location matter. Investigate how a missing fifteen-minute value should be shown in a dashboard. Compare the relevance of prolonged direct-sun activity advice with a short sheltered walk, without making a universal medical recommendation.
Safety and interpretation limits
Never expose participants to heat stress as a classroom test. Some people have additional vulnerability requiring appropriate professional advice; use current MOH and NEA guidance for actual outdoor decisions.
Official reference: Compare WBGT heat stress with ordinary air temperature. Use the current time-specific data for any actual decision.
8. Investigate relative humidity with a model instead of an unsafe heat experiment
Where: A desk exercise using MSS’s observation explanations and fictional temperature-humidity readings.
The weather-science question
MSS explains that relative humidity is the amount of water vapour relative to what air can hold at the same temperature. A change in air temperature can change relative humidity even without adding or removing the same absolute amount of moisture, which often confuses beginners. Singapore commonly has high early-morning humidity and lower afternoon relative humidity. However, a student’s unsheltered phone sensor or a brief feeling of stickiness cannot establish a calibrated local humidity record.
How to investigate without risk
Read MSS’s guide to humidity sensors and temperature observation. Create a fictional time series with labelled temperature and relative humidity values, maintaining consistent units and location. Ask the student to distinguish a drop in relative humidity from proof that water vapour mass decreased. On paper, describe a hypothetical room that warms while the amount of vapour initially remains similar, then discuss the direction in which the relative humidity might change. Record uncertainty rather than calculating an exact new value without the necessary psychrometric relationship.
Worked Punggol example
A model has an early sample of 26°C at 90% relative humidity and a later sample of 32°C at 65%. A student says the second reading necessarily means the air contains less water vapour in absolute terms. That conclusion cannot be inferred from the percentages alone without temperature and the relevant vapour-pressure calculation. The repaired answer says relative humidity compares actual vapour with temperature-dependent saturation, so absolute moisture needs further analysis.
An advanced question
Introduce the concept of a dew point using an authoritative description, and ask which factors affect perceived comfort. A higher relative humidity may make evaporation less effective under some conditions, but individual comfort also depends on wind, clothing and activity. Keep physiological claims within official health advice and not as a diagnosis from a single sensor reading.
Safety and interpretation limits
Do not turn off essential cooling or heat a confined room to create a humidity contrast. Use original authoritative data or clearly labelled desk models; no personal health readings are required.
Official reference: Investigate relative humidity with a model instead of an unsafe heat experiment. Use the current time-specific data for any actual decision.
9. Distinguish meteorological rain warnings from an actual flood alert
Where: PUB and data.gov.sg flood alerts, considered before a Punggol outdoor route.
The weather-science question
Heavy rain increases flood risk, but a rain forecast, a measured rainfall total and an actual flood alert are three different information types. PUB maintains flood warning and monitoring services while the national open-data portal lists flood alerts. Students should not interpret every thundery-shower forecast as evidence that a specific Punggol underpass is flooded. Equally, a public flood alert should not be dismissed because a weather photograph shows sunshine at a different location or time.
How to investigate without risk
Draw a source-to-action table containing MSS rain forecasts, near-real-time gauge observations and PUB flood alerts. For each identify who issues it, what it means and what a family should verify before using a public path. Work through a fictional Punggol route with a low-lying crossing and a storm forecast; mark how the decision would change if the relevant actual flood alert were present. Use fictional event values and do not list nonexistent current flooded Punggol streets.
Worked Punggol example
A student sees a two-hour thundery-showers forecast and posts ‘Punggol Waterway is flooding now’. The forecast does not document active flooding at that location. The correction is to seek PUB’s relevant actual alert and current safe route information, and to avoid publishing a specific flood claim without confirmation. The same distinction applies to a map shaded with rain intensity; rain is not identical to a water-depth measurement.
An advanced question
Discuss forecast lead time and the need for independent environmental and infrastructure sensors. Explain why heavy rain can affect different catchments differently and why a flood warning service should be clear about event time, location and status. Design a simple alert interface that displays ‘forecast’, ‘observed rain’ and ‘flood alert’ as three distinct categories.
Safety and interpretation limits
Do not approach flooded roads, streams, underpasses or storm drains for fieldwork. Real warnings require following the responsible authority’s safety instructions and avoiding unnecessary travel through affected areas.
Official reference: Distinguish meteorological rain warnings from an actual flood alert. Use the current time-specific data for any actual decision.
10. Build a Punggol weather-versus-climate notebook with reproducible sources
Where: Home using MSS Climate of Singapore, annual reports and published observational datasets.
The weather-science question
MSS describes Singapore’s Northeast Monsoon from December to early March, Southwest Monsoon from June to September and inter-monsoon periods around late March–May and October–November. Seasonal descriptions come from patterns over many years. One rainy evening in Punggol cannot demonstrate that a season’s climate has permanently changed. Students can connect near-term forecasts with long-term climatological patterns only when they preserve different time scales, stations and definitions.
How to investigate without risk
Use MSS’s climate page and write the four broad seasonal periods with the official caveat that transitions are not instantaneous. Choose one climate statistic from a defined baseline, such as the 1991–2020 Changi long-term rainfall mean, and label its station and period. Compare it with a wholly fictional single-day Punggol rainfall amount, explicitly noting that one observation cannot replace the climatological mean. Create an evidence portfolio with source URLs, retrieval date, data units, quality limitations and one meaningful question for future study.
Worked Punggol example
MSS gives a 1991–2020 long-term annual rainfall average of 2,113.3mm at its climate reference. A student sees hypothetical heavy rain on one October afternoon and claims that Punggol’s annual climate has changed by 30%. One afternoon cannot justify that number. A corrected claim identifies the long-term statistic and keeps the local daily event separate, explaining that climate trends require many observations and appropriate comparison.
An advanced question
Create a simple quality-assurance plan for a weather dashboard: reject impossible units, flag missing timestamps, distinguish current observations from predictions, retain station names and prevent stale readings from being labelled live. Compare why data.gov.sg’s API update cadence does not mean every sensor has complete data at every instant. An advanced student can build a completely fictional time series and practise computing a rolling mean with properly documented gaps.
Safety and interpretation limits
Do not substitute a climate average for today’s weather advice. Station readings and derived climate products can be revised, so use MSS’s current original records and attribution. The notebook is educational, not an official forecast or safety alert system.
Official reference: Build a Punggol weather-versus-climate notebook with reproducible sources. Use the current time-specific data for any actual decision.
Three complete meteorology study plans
A thirty-minute forecast-literacy lesson
At home, open the live MSS two-hour forecast for Punggol and write down the current issue and validity times. Compare what it says with the twenty-four-hour product’s broader purpose and outline why one is more suitable for an imminent outing. If any thundery-shower or lightning warning is present, do not go into exposed areas to verify it. Create a simple indoor decision table and a fictional alternative plan such as reading at Punggol Regional Library.
A one-hour observation-data quality session
Use MSS and data.gov.sg pages to identify rainfall-station values, radar imagery and current observation metadata. Build a small imaginary table with matching timestamps and one missing record, and keep the units consistent. Describe what each instrument measures and why a missing reading cannot be set to zero without evidence. A chart with correctly displayed gaps teaches more than a smooth chart created by inventing data.
A climate-and-city fieldwork proposal
Study Singapore’s monsoons and the relationship among air temperature, humidity, wind and solar radiation. From home, write a proposed public-space question such as how shade may affect outdoor comfort. Include the data an authorised study would need, but do not direct participants to stand in dangerous heat or thunderstorms. Distinguish the long-term seasonal baseline from the short-term forecast that would determine whether the actual visit is appropriate.
A sample weather-data record
- Metric: specify temperature, rainfall, wind, UV, WBGT, relative humidity or another precise quantity.
- Value and unit: preserve millimetres, degrees, metres per second or index labels as appropriate.
- Station or area: name the actual reporting source rather than assuming an exact street reading.
- Time: include Singapore time, publication time and observation interval.
- Type: label forecast, observation, alert or long-term climate statistic.
- Quality: flag unavailable, delayed, corrected or uncertain readings.
- Source: cite MSS, NEA, PUB or data.gov.sg with its actual dataset page.
- Decision: state what the information can and cannot establish.
Common errors that an MSS source check will repair
An hourly forecast cannot specify when lightning will strike a particular tree. A station gauge cannot measure every point between stations. A radar image’s intense colour does not provide a calibrated rainfall depth for one HDB balcony. The Changi UV Index is not a private household sensor. Air temperature and WBGT are not interchangeable. A storm in October is not on its own a measurement of climate change. These errors share one cause: a mismatch between the claim and the type or scale of evidence.
A second class of error concerns old screenshots. Weather data change quickly and can be revised after automated transmission. A perfectly real screen capture becomes unsuitable as a current weather report when reused tomorrow. Keep issue time visible, maintain the original source and avoid using images without dates. A static educational article should explain where to check real conditions rather than copy a forecast that will expire.
Frequently asked questions
Where can Punggol students learn meteorology without equipment?
Use the official MSS forecasts, observation explanations, data.gov.sg datasets and clearly labelled desk models.
What is a nowcast?
A very short-range forecast, such as MSS’s two-hour town-centre weather product.
Does a forecast of thundery showers mean lightning will hit a particular location?
No. It indicates risk, not the time and location of an exact strike. Follow current safety advisories.
How often is the two-hour forecast updated?
The official data.gov.sg description lists a routine thirty-minute update cadence, with ad-hoc updates possible; check the current issue time.
What does the twenty-four-hour forecast describe?
MSS issues broader forecasts for Singapore’s major regions, not an exact hourly guarantee at one Punggol street.
What is the difference between rainfall gauge and radar data?
A gauge records precipitation at a point over a period; radar presents broader spatial rainfall echoes and estimates.
Can a weather-station reading describe my exact home?
Not necessarily. Location, height, environment and sensor exposure can differ.
Can lightning occur when it is not raining directly overhead?
Yes. MSS warns that lightning may occur more than ten kilometres from a thunderstorm cloud.
What does wind direction mean?
Meteorological wind direction is the direction the wind comes from, such as an easterly blowing from east toward west.
Where is Singapore’s official UV Index measured?
MSS says it is measured at the Changi Meteorological Station, with fifteen-minute reports from 7am to 7pm.
Is the official UV Index a personal skin-exposure measurement?
No. It is a station-based environmental measure; local conditions and protective behaviour affect exposure.
What is WBGT?
Wet-Bulb Globe Temperature, a composite heat-stress measure incorporating temperature, humidity, wind and solar radiation.
Is WBGT equal to ordinary air temperature?
No. The inputs and interpretation differ, although both may be expressed in degrees Celsius.
What does relative humidity mean?
The amount of water vapour compared with the saturation capacity at the same temperature.
Does a lower relative humidity always mean less absolute moisture?
Not necessarily; temperature must also be considered.
Is a heavy-rain forecast identical to a flood alert?
No. Rain predictions, gauge readings and PUB flood alerts are different products.
What are Singapore’s monsoon seasons?
MSS describes Northeast Monsoon from December to early March and Southwest Monsoon from June to September, separated by inter-monsoon periods.
Does one rainy day prove climate change?
No. Climate questions require suitable multi-year data and methods.
Can a student make a weather dashboard?
Yes, using documented APIs and clear timestamps, licensing, missing-data handling and labels that distinguish forecasts and observations.
What is the safest response to a lightning warning during fieldwork?
Stop exposed outdoor activity and follow current official advice and appropriate safe shelter procedures.
Official sources and related Punggol guides
- Compare the two-hour town forecast with a Punggol outing decision
- Learn why the twenty-four-hour and four-day forecasts answer different questions
- Distinguish automated rainfall gauges from a radar image
- Study lightning alerts as a decision system, never as a viewing challenge
- Read wind direction correctly before discussing the Punggol coast
- Learn why an ultraviolet index reading is not a personal Punggol exposure value
- Compare WBGT heat stress with ordinary air temperature
- Investigate relative humidity with a model instead of an unsafe heat experiment
- Distinguish meteorological rain warnings from an actual flood alert
- Build a Punggol weather-versus-climate notebook with reproducible sources
- MSS tropical climate and seasonal monsoons
- MSS automatic rain-station observations
- MSS Changi UV Index and protection guidance
- NEA WBGT station datasets
- Punggol environment and verified measurements
- Punggol station location and spatial data accuracy
- Punggol community prevention and environmental advisories
- Punggol family storm and emergency readiness
- eduKateSG progression, error diagnosis and checking
A weather forecast is useful because its limits are understood
Punggol’s waterway, coast, schools and community spaces are sensible contexts for learning meteorology, but no safe science lesson needs students to stand in lightning or heat. Read the original MSS product, preserve its time and location, distinguish what was forecast from what was measured and explain uncertainty before calculating. The skill transfers from one Punggol afternoon to a lifetime of better decisions about the weather.


