
Maths is all around Punggol, from the Waterway Park’s route lengths and distinctive bridges to LRT trips, shopping decisions and the newest urban design at Punggol Coast. The most meaningful mathematical outing is not a long list of calculations. It is one question that starts with a real place, uses clearly defined numbers and ends with an explanation that can be checked.
The ten activities here are a Waterway walking-time estimate, bridge symmetry sketching, terraced-bank geometry, Punggol Coast route optimisation, LRT interval statistics, supermarket unit prices, urban-shade similar triangles, plant-count proportions, board-game probability and 3D-scale modelling with NLB MakeIT. They are different kinds of reasoning, and not all require a ticket or even a trip. A safe observation and a paper model can be a complete activity.
Two numbers need special care. NParks publishes a 4.2 km easy nature walk with an estimated duration of one to two hours, while the Punggol Waterway Park Connector is listed separately at 8.4 km. They are different named routes. Likewise, every worked price, time and dimension described as hypothetical in this article is an invented classroom number. It is not a current food price, surveyed building dimension or actual rail timetable.
For children, counting shapes and explaining a simple rate may be the ideal challenge. Older students might prefer proportions, coordinates or statistical bias. Adults may enjoy networks and how models fail under real constraints. The purpose is to learn to think carefully, not to claim that one outing guarantees higher school marks.
1. Use Waterway route distances to explore time and speed
Punggol Waterway Park is an inviting place for rate problems because NParks gives useful public route descriptions. The easy 4.2 km nature walk is different from the 8.4 km named connector. A learner should read the source, select which route a question concerns and avoid treating an arbitrary segment from home as equivalent to either distance.
A basic mathematical model uses time equals distance divided by speed. One can work with a deliberately assumed pace before setting out, then compare the result with a real time only if the actual route and observation have been recorded. Stops, heat, companions and a different starting point change the real journey. The correct formula alone cannot establish the total time a visitor will need.
Use a short, familiar public path and an appropriate turnaround for any actual outing. Do not force a child to walk the whole route or block cyclists while recording data. The important outcome is a named route, a correct unit conversion and an honest note about the limits of the estimate.
2. Draw symmetry in Punggol’s bridges
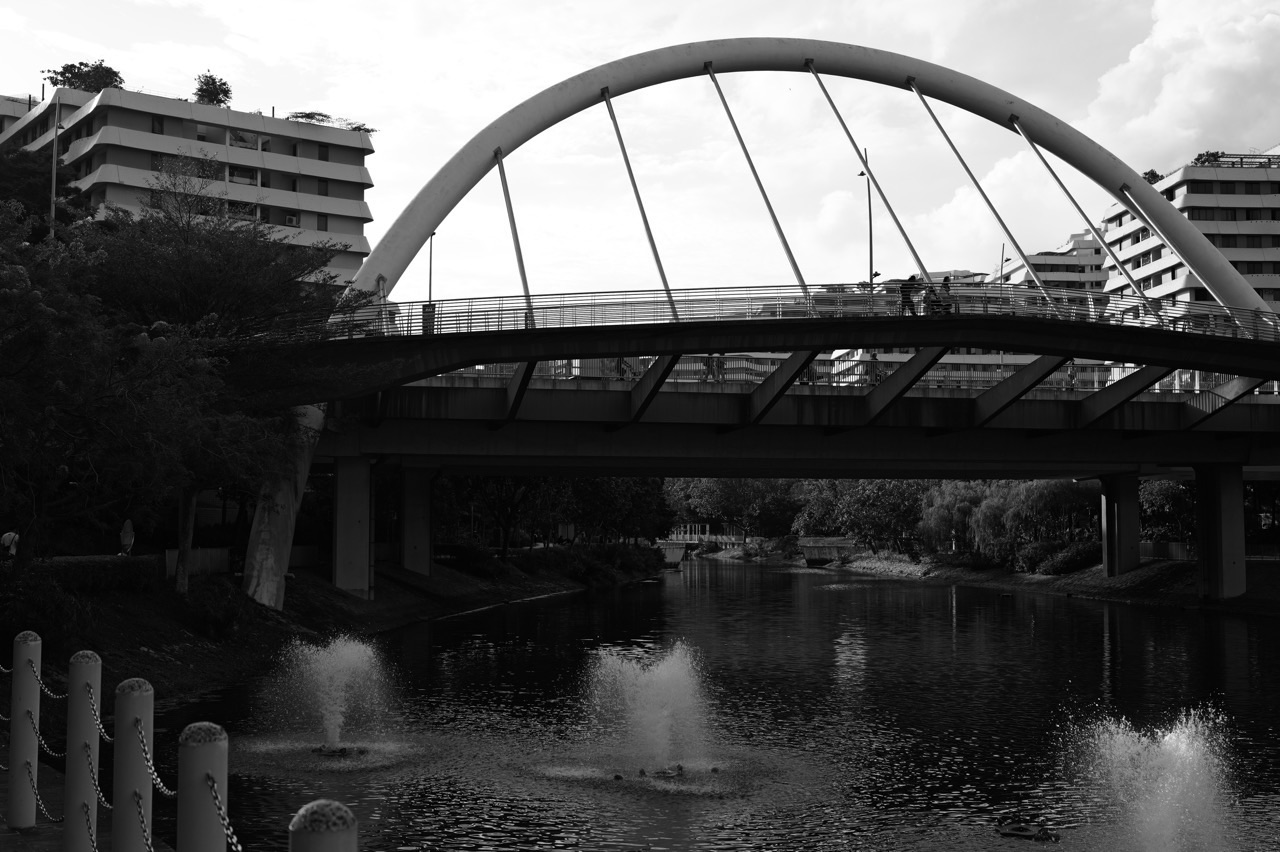
NParks identifies Jewel, Wave, Sunrise and Kelong Bridges within the Waterway Park environment. Their shapes can prompt questions about reflection, congruence and repeated forms. Kelong Bridge evokes fishing heritage, but it is a modern interpretive structure rather than a surviving working kelong.
Choose a lawful public viewpoint, make a sketch and draw a possible mirror line. Look for pairs of details that seem equally distant from it, but remember that a bridge might not be perfectly symmetrical and a photograph adds perspective distortion. Constructing an idealised symmetric version on graph paper is a separate mathematical exercise.
Keep observations and assumptions apart. A hand-drawn railing is not an engineering survey. Never lean over the water, climb a bridge or place equipment across an accessible path to obtain a better angle. A well-labelled comparison of the visible shape and the imaginary model is enough.
3. Model terraced landscaping with a trapezium
Waterway Park’s planted banks and terraced landscapes show that Punggol combines environmental planning with public open space. A visible terraced slope can be simplified to a two-dimensional trapezium to practise area, but the actual ground is irregular and its dimensions cannot be read accurately from an ordinary photograph.
From a public path, observe the slope’s general form and draw a hypothetical cross-section. Identify the two parallel edges and the perpendicular height. Use the trapezium area formula to investigate a small imaginary set of dimensions, then explain why this two-dimensional result is not automatically the surface area or soil volume of the real bank.
Do not climb down the slope, dig, collect soil or perform runoff tests. The landscape has environmental functions that cannot be quantified from the toy model alone. This activity is successful when the student knows exactly what the area formula calculates and what it does not.
4. Draw a shortest-path graph around Punggol Coast
JTC lists Punggol Coast Mall, the new hawker centre, Our Punggol Story mural and the first open section of Punggol Heritage Trail among public-facing Digital District amenities. These names can become nodes in a graph representing places connected by walking routes.
Use real current public links only when they have actually been verified, or create a completely hypothetical network with fictional edge lengths. Compare two routes by adding their edge weights. Then consider an important complication: the shorter path might involve stairs, heat, an unopened trail phase or a private university entrance.
This is the introduction to mathematical optimisation. A route must first be legal and available before its length matters. Punggol Heritage Trail’s longer planned alignment is not all open merely because it appears on a map. Keep the exercise on paper when access is uncertain.
5. Explore means and medians using LRT times
LTA describes Punggol LRT as an automated local railway with two loops serving housing areas around Punggol MRT. Actual waiting time varies by date, direction, station and service pattern. A maths enthusiast can use either a permitted personal observation or an entirely hypothetical list to learn statistical summaries.
Calculate the arithmetic mean, median and range of a few sample intervals. An average based on a handful of observations describes that sample, not the entire rail system. A particularly delayed train may increase the mean more than the median, and four observations cannot tell a visitor when the next train will arrive.
Any real observation should be made without hindering passengers, standing across tactile strips or misusing fare gates. Official live service information belongs with LTA or the operating company. Statistical literacy includes knowing when not to generalise.
6. Compare unit prices on an everyday shopping trip
One Punggol has a hawker centre and Punggol’s shopping districts provide plenty of ordinary grocery decisions. A lower sticker price is not necessarily a lower price for a common quantity. Comparing two packages requires their weights or volumes, a common unit and a check that the goods are genuinely comparable.
Convert grams to kilograms, then divide price by kilograms. For a teaching problem you can use fictional prices written on paper, without buying any items. If you record an actual shop price, mark the retailer, date and product quantity, because prices and promotions are not permanent.
The result is more than arithmetic. A household might reasonably choose a smaller pack with a higher unit rate when the larger one would spoil, cost too much upfront or fail to meet dietary needs. Maths supports good decisions but does not replace them.
7. Draw similar triangles from an imaginary shaded walkway
URA’s Punggol Digital District urban-design guidance includes sun-shading and tropical climate design principles, updated in October 2026. Public canopies and façades can inspire a simple similar-triangles question about heights and shadows. A casual observer, however, does not know the exact sun angle or annual cooling performance.
Draw two imaginary vertical poles on level ground under the same sunlight direction. Use the ratio of height to shadow length to predict the second shadow, then explain which assumptions are essential. The exercise teaches geometric similarity, not the actual dimensions of a Punggol Coast structure.
Public shade does not imply permission to access rooftop gardens or service rooms. Do not block a walkway with measuring tools or call a paper model a measured building-temperature result. Keep the field note visual and the calculation clearly hypothetical.
8. Learn proportions by counting a small selected set of plants
NParks describes aquatic planting at Waterway Park, but a small view from one bench cannot represent all the park’s plant species. A learner can practise counting with visible growth forms, using categories such as broad leaves, narrow leaves and unknown. Exact species identification often needs more information than is visible at a distance.
Assign each observation to one category, divide each count by the sample total and convert to a percentage. A bar chart can display the relative frequencies. If you invent the sample for class, label it fictional; if you make a real observation, record the boundary and date.
This is a lesson in sampling bias. A carefully calculated percentage might accurately describe ten selected objects while being useless as an estimate of a large park. Leave unknown classifications rather than inventing plant names, and never enter sensitive planting or water to complete a chart.
9. Use a board game to discuss theoretical probability
NLB’s Comics & Games Library at Punggol Coast Mall offers a shared collection of games and graphic novels under its own visitor-entry procedure. A suitable game can illustrate probability, but a particular board game, die or table may not be available on the day.
Imagine a fair six-sided die. List the six possible results and classify them into even and odd outcomes. The theoretical probability of an even number comes from the proportion of favourable results, not from a feeling that a number is due. A short run of throws can deviate from the theoretical long-run expectation.
The probability task works with a paper spinner at home as well. If visiting NLB, follow entry, age, equipment and noise rules. Do not turn probability into gambling or use the shared library as a private tournament venue.
10. Learn 3D scaling with a paper model or an authorised MakeIT session
NLB’s MakeIT service at Punggol Regional Library offers digital making, including 3D printing, on specific operating days with booking and safety conditions. A maths enthusiast who is not eligible for equipment can still make an ordinary paper cube and study the same principles.
Start with a cube of side length one unit. Consider a geometrically similar cube with every side doubled or tripled. Its face area does not grow at the same rate as its length, and its solid volume grows faster still. Use powers to construct a scale table and relate the result to packaging or prototype design.
Actual printer material usage also depends on infill, supports and wall thickness. A geometric solid-volume result is not a quote from the library’s printer. Follow current NLB instructions and never use unfamiliar fabrication tools without the appropriate approval.
Ten fully worked maths examples for a Punggol day out
The locations above are the starting points. The following calculations show how to complete each mathematical task while separating verified place facts from invented exercise data. Every price, shadow length, route-edge distance and sample time in the worked examples is hypothetical unless the sentence expressly identifies an official authority source. A teacher or parent can adapt numbers to a learner’s level without pretending to have surveyed public infrastructure.
1. Nature-walk time and distance
NParks publishes 4.2 km for the designated Punggol Waterway Park nature walk and estimates one to two hours. Suppose someone walks at a steady hypothetical speed of 3.5 km/h without pausing. Time equals distance divided by speed, so 4.2 ÷ 3.5 = 1.2 hours. To turn this into minutes, multiply 1.2 by 60 and obtain 72 minutes.
The 72-minute result is consistent with the broad NParks duration, but it is not a measurement of somebody’s actual trip. A parent and child who stop for plants, photographs or rest might need longer. If a visitor instead chooses only one bridge and returns, the relevant distance may be far shorter than 4.2 km.
As a second exercise, divide the separately named 8.4 km connector length by four. Each imaginary quarter is 2.1 km. This arithmetic does not establish four equally spaced real entrances. It teaches why a length on a map and a practical walking route are different concepts.
2. Coordinate reflection by the bridges
At a public viewpoint near Jewel or Kelong Bridge, observe a repeated outline without asserting that the structure is perfectly symmetrical. At home, construct an independent coordinate-grid problem. Imagine a vertical mirror line x = 5. A point at (3, 2) is two units to its left. Its image is therefore two units to the right of the mirror, at (7, 2).
The horizontal distance from each point to the line is two units, which checks the reflection. The y-coordinate remains unchanged for this vertical reflection. A learner can extend the exercise by moving the mirror to x = 4. The same point (3, 2) would then reflect to (5, 2).
These coordinates are not bridge measurements. They belong to a model inspired by a visible form. The important distinction is that exact reflection in a coordinate plane follows mathematical rules, whereas real buildings can have asymmetry and perspective distortion.
3. The area of an idealised terrace
Suppose an imaginary terraced-bank cross-section is drawn as a trapezium with parallel sides 6 m and 4 m and perpendicular height 3 m. Its area is A = ½ × (6 + 4) × 3 = 15 m². This is a two-dimensional area, not a cubic-metre volume, a planted-landscape surface area or the capacity of a drainage system.
A useful checking method is to redraw the shape as a 4 m by 3 m rectangle plus two small triangles whose combined base width is 2 m. The rectangle area is 12 m², while the two triangles together occupy ½ × 2 × 3 = 3 m². Adding 12 and 3 confirms 15 m².
The check is valid for the idealised drawing. Punggol’s actual landscaped slopes are not guaranteed to match its dimensions or geometry. Do not step onto planting or interpret the model as evidence of water-quality performance.
4. Shortest paths with fictional distances
Use four imagined nodes called Station, Mall, Hawker and Mural, referring only to the types of public destinations named by JTC at Punggol Coast. In a purely fictional graph, let Station-to-Mall be 120 m, Mall-to-Mural 280 m, Station-to-Hawker 160 m and Hawker-to-Mural 190 m.
The mall route totals 120 + 280 = 400 m. The hawker route totals 160 + 190 = 350 m, so the latter is 50 m shorter within the fictional model. A student can explain that shortest-path reasoning compares sums of permitted edges.
The real problem is harder. A graph edge that crosses a private campus room or unopened Heritage Trail section is not usable. A step-free route may be longer but necessary for a stroller or wheelchair. The mathematical answer only becomes a valid navigation choice after the edges, access and relevant constraints are established.
5. Mean, median and range of waiting times
Imagine four sample Punggol LRT waiting intervals of 4, 6, 5 and 7 minutes. The sum is 22 minutes, so the mean is 22 ÷ 4 = 5.5 minutes. Arrange the values in ascending order: 4, 5, 6, 7. The median is the average of the middle two, (5 + 6) ÷ 2 = 5.5 minutes. The range is 7 − 4 = 3 minutes.
Now imagine one unusually long additional interval of 20 minutes. The five observations total 42, giving a mean of 8.4 minutes. Their median is 6 minutes, because the middle value in 4, 5, 6, 7, 20 is 6. This example shows how a large outlier can move the mean more than the median.
These are invented numbers, not train timetables. The appropriate travel information is provided by the operating authority. The purpose of the calculation is to explain the difference between descriptive statistics and reliable prediction.
6. Comparing two packages fairly
Imagine Packet A costs S$3.20 for 500 grams of a staple and Packet B costs S$4.20 for 750 grams of a comparable product. The values are fictional and must not be represented as prices in One Punggol or any other shop.
Packet A weighs 0.5 kg, giving S$3.20 ÷ 0.5 = S$6.40 per kilogram. Packet B weighs 0.75 kg, giving S$4.20 ÷ 0.75 = S$5.60 per kilogram. B is cheaper by S$0.80 per kilogram, but it costs S$1 more to purchase the whole packet.
If the family needs only 500 grams and the extra 250 grams will spoil, buying the larger pack may not be worthwhile. The final answer should contain both the correct unit-rate comparison and the real-world constraint. A number is useful when it supports the actual decision.
7. Similar triangles and imaginary shadows
Draw two right triangles representing vertical poles and their shadows on perfectly flat ground under the same sun angle. Suppose Pole A is 1 m high with a 1.5 m shadow. Pole B is 3 m high. Because the pole heights have ratio 3:1, their modelled shadow lengths do as well, so Pole B’s shadow is 3 × 1.5 = 4.5 m.
A student can write the proportion 1 ÷ 1.5 = 3 ÷ 4.5 and see that both sides give the same ratio. The result assumes that the poles are vertical, the ground is level, and sunlight falls at the same angle. If one object stands on a slope or its shadow is blocked by another building, the simple model may fail.
No actual Punggol Digital District shadow was measured. URA’s design guidance motivates the exercise, but a proportional drawing cannot establish a current building’s cooling performance or annual energy use.
8. Percentages from a small selected sample
Suppose a fictional learner counts ten visible plant groupings in three categories: six in Group A, three in Group B and one unclassified. A makes up 6/10 = 60%; B makes up 3/10 = 30%; unknown makes up 1/10 = 10%. These three percentages add to 100%, as expected.
A bar chart can use bar heights of six, three and one. A pie chart would use angles of 60% × 360° = 216°, 30% × 360° = 108° and 10% × 360° = 36°. The angles also add to 360°, providing an arithmetic check.
Yet the numbers remain an imaginary sample, not a biodiversity survey of Waterway Park. If actual observations are made, the sample may be unrepresentative because one visible bank differs from the entire park. Correct percentages do not automatically support wide ecological conclusions.
9. Probability of even outcomes on a fair die
Imagine a fair die with six possible outcomes: 1, 2, 3, 4, 5 and 6. The even outcomes are 2, 4 and 6. There are three favourable outcomes out of six equally likely possibilities, so the probability of even is 3/6 = 1/2, or 50%.
A related paper-spinner model could have four equal sections, two blue, one red and one green. P(blue) = 2/4 = 1/2 and P(green) = 1/4. These results depend on the sections being equal and the device being fair.
In ten actual trials, an even outcome need not occur exactly five times. Small samples vary, and a sequence of odd rolls does not make even results due. These are maths and game-design discussions, not a reason to gamble. Respect NLB’s rules if making observations at its shared games library.
10. Scaling a cube into a larger model
Imagine a solid cube with side one unit. If each edge is doubled, the new solid is two units by two units by two units. The original volume is 1³ = 1 cubic unit, while the new volume is 2³ = 8 cubic units. The volume factor is eight.
Surface area changes differently. A cube has six square faces, so its original surface area is 6 × 1² = 6 square units. Doubling the side gives 6 × 2² = 24 square units, a factor of four. Tripling the side multiplies surface area by nine and solid volume by twenty-seven.
This is important for making and packaging because a design can consume much more material as it grows. Actual 3D printing does not always fill the entire volume with material; wall thickness, infill and support structures matter. Follow NLB MakeIT’s current access and training rules or make a paper model at home.
Three realistic Punggol maths itineraries
A short geometry and distance walk
Begin at one familiar public entrance to Waterway Park. Choose a single bridge with a lawful public viewpoint. Sketch two visible shapes and compare them with a perfectly symmetric drawing on paper. Use NParks’ 4.2 km and 8.4 km figures in a separate calculation, taking care to identify which route each describes. Turn around whenever the walking party needs to; the outing need not reach any minimum distance.
This is suitable for a mixed-age family because younger children can describe shapes while older learners calculate speeds or coordinates. Safety is more important than precise field measurements. A wet or crowded bridge can be replaced with a drawing based on publicly available material.
An everyday numbers-and-shopping outing
Choose an ordinary shopping errand near central Punggol and make one unit-price comparison using actual current product labels when possible. If the shopping trip does not offer equivalent items, use the fictional example instead. Discuss the relation among price, mass, expiry and household need without buying excess food for the sake of an exercise.
Finish with a one-page note showing both rates, the common unit and why the lower number may not settle the decision. A real-world consumer calculation is successful when it helps the shopper choose calmly and fairly, not when it produces the largest spreadsheet.
A Punggol Coast route puzzle and a later library activity
Choose a short public Punggol Coast visit to observe the relationship between MRT, mall, hawker centre and mural. Construct your route graph with imaginary weights, identify its assumptions and check any genuine public access separately. The next visit might be to NLB’s Comics & Games Library for probability, or to a properly booked MakeIT activity at One Punggol for scale geometry.
The two NLB services have different locations, booking and entry rules. Keeping activities separate makes the trip easier and protects time for actually enjoying the mathematical question rather than spending the afternoon in transit.
How to keep a mathematical field notebook
Write the question first. Then write the source of each quantity. A route length may come from NParks; a public destination’s status from JTC; a train system description from LTA; an ordinary product label from a live retailer. Anything you invented for teaching should be marked hypothetical. The source and date matter if the claim could change.
Next, list assumptions in plain language. A walking speed is constant only because a model assumes it. A geometric pole is vertical because the diagram says so. A die is fair because the probability problem defines equally likely outcomes. Assumptions are not embarrassing shortcuts; they are what makes a model manageable.
Show the arithmetic with units. Check decimal-hour conversion rather than interpreting 1.2 hours as one hour and twenty minutes; it is one hour and twelve minutes. For price comparisons, convert all masses to kilograms before dividing. For area, use square units. For a percentage, state the sample total that forms the denominator.
Finally, identify a limitation. The average of four fictional intervals cannot predict a train arrival. The shortest hypothetical path may be blocked. A price per kilogram does not capture quality. An irregular bank is not a perfect trapezium. These qualifications show that the learner understands the mathematics and the real place.
A progression for Primary, Secondary and adult learners
Primary-level learners can enjoy a simple shape hunt, count visible items from public space, convert grams to kilograms and compare two imagined prices. They can make a paper spinner and discuss likely outcomes without needing formal probability vocabulary at every step. A parent or teacher should choose one achievable objective and allow time for play.
Secondary learners can add coordinate reflections, trapezium area, similar triangles, equations relating distance and time, data summaries, percentages and sampling limitations. Encourage them to write full solutions and explain which variable was assumed. The most valuable correction is often discovering a mistaken unit or an unsupported inference.
Older learners and adults can extend the route graph to consider unavailable paths, variable costs, accessibility constraints or a different optimisation objective. They may examine how choice of sample or an extreme observation changes the mean. They can also compare a physical object with its scaled model and ask whether the same material or structure remains suitable.
None of these outings guarantees academic results. Recreational mathematical activities may deepen curiosity and understanding, while sustained improvement in formal assessments still requires appropriate instruction, independent practice and feedback where needed.
Five further challenges for curious maths learners
How sensitive is the walking-time result to the assumed pace?
The 4.2 km official nature-walk length remains the same in a simple model, but travel time changes when the assumed pace changes. At a hypothetical 3.0 km/h, the calculated duration is 4.2 ÷ 3.0 = 1.4 hours, or 84 minutes. At 4.0 km/h, it is 4.2 ÷ 4.0 = 1.05 hours, or 63 minutes. The two modelled times differ by 21 minutes even though the route length is unchanged.
This is called sensitivity to an input assumption. It explains why estimating with only one rate can be misleading. Actual walking pace may vary along the route, especially with weather, crossings, age or mobility needs. A good maths notebook therefore offers a plausible range where helpful and avoids declaring one model result as the arrival time for everybody.
Does a cheaper unit price still save money after transport?
Suppose two shops in an entirely invented shopping scenario sell an otherwise equivalent product. Shop A charges S$8.00 and is already on your ordinary route. Shop B charges S$7.20 but requires a separate journey costing an illustrative S$1.50 in additional transport. The apparent product saving is S$0.80, while the hypothetical added journey costs more than that difference.
The total in the imaginary comparison is S$8.00 for A versus S$8.70 for B. Under those assumptions, choosing B for the single item is not cheaper overall. A real decision might include other errands, travel concessions or time costs, but those must be established rather than guessed. This exercise shows that choosing a denominator and defining the full cost are both part of mathematical problem solving.
Why might two small samples give different averages?
Imagine four observed intervals during a hypothetical busy period: 3, 4, 4 and 5 minutes. Their mean is 4 minutes. A second fictional group of waits at another time is 7, 8, 9 and 8 minutes, giving a mean of 8 minutes. The difference between the means is four minutes, but it does not prove that any current Punggol LRT timetable guarantees those values.
The samples might reflect different demand, service patterns or simply a small and unrepresentative selection. Good comparison requires a consistent definition of waiting time, observation method, line direction and sample period. Before drawing conclusions, ask whether the two sets are meaningfully comparable and how much additional evidence would be needed.
How do shape counts change when one classification is uncertain?
Suppose a fictional plant observation contains eight examples confidently classified as Group A and two uncertain examples. A careless learner might call the result 100 per cent Group A by ignoring the unknown cases. The honest whole-sample rate is 8/10 = 80 per cent confidently identified as Group A, with 20 per cent unknown.
If the two uncertain cases are eventually confirmed as A, the rate becomes 100 per cent. If neither is A, it remains 80 per cent. These form simple lower and upper bounds under the stated assumptions. This is not evidence about Punggol’s plants; it illustrates why missing or uncertain observations should be retained rather than silently excluded from a denominator.
What changes when you scale a hollow rather than a solid object?
Doubling all the dimensions of a geometrically similar solid cube multiplies its volume by eight. But an actual 3D-printed model may contain a hollow interior, supporting ribs, a specified wall thickness or an infill pattern. Its material consumption depends on how those features scale. If wall thickness stays constant while the outer object gets larger, the material factor need not be exactly eight.
This is why a geometric scaling formula should be described as a model of solid volume, not a firm printer-material estimate. A beginner can compare a solid paper cube with an open-top paper box, then note how their required paper areas differ. A learner using MakeIT should follow the operator’s real equipment and certification arrangements before attempting a print.
Frequently asked questions
Why are 4.2 km and 8.4 km both associated with Punggol Waterway?
NParks gives 4.2 km for the designated easy nature-walk activity and 8.4 km for the named Waterway Park Connector. They are different descriptions and should not be treated as one measured route.
Are the route, grocery and waiting-time calculations real measurements?
No. The worked pace, grocery prices, LRT intervals, route graph weights and shadow dimensions are explicitly hypothetical. Only the named authority facts are presented as real place information.
Which Punggol destination is best for geometry?
One public Waterway Park bridge viewpoint is enough for a useful symmetry sketch. Keep to safe paths and avoid treating the drawing as an engineering survey.
Can a student study Punggol LRT statistically?
A small lawful observation or a clearly invented data set can illustrate mean, median and range. The result must not be advertised as the operating timetable or an all-day average.
What if the cheapest per-kilogram product is too large?
Unit cost is only one decision factor. Food waste, upfront expense, expiry, quality and the household’s needs may justify a smaller package despite its higher rate.
Can a class measure the waterway bank by entering the planting?
No. Use a hypothetical cross-section and do not enter landscaping, collect materials or handle water. Public park access does not authorise intrusive surveying.
Do Punggol Coast shortest-path examples give real walking directions?
No. The illustrative graph uses invented distances. JTC’s current public route information and on-site signage must govern real access.
Is the Comics & Games Library an ordinary commercial arcade?
No. It is an NLB public library node with an identity or day-pass entry procedure, shared equipment and venue rules. Availability of specific games is not guaranteed.
Can anybody use the MakeIT 3D printer immediately?
No. NLB requires bookings or relevant certification for some equipment, as well as appropriate age and safety rules. Paper-model geometry remains an alternative.
Do mathematical park activities replace tuition or school lessons?
No. They can strengthen observation and reasoning, but do not independently establish examination improvement. Learning support should fit an individual student’s needs.
Official sources and related Punggol reading
NParks 8.4 km Waterway Park Connector
NParks Waterway Park and bridges
JTC Punggol Coast community and current trail status
URA Digital District urban-design guidance
Understanding Punggol Mathematics Education
The best first maths outing in Punggol
Begin with the published difference between the 4.2 km nature walk and the 8.4 km connector, or simply sketch a Waterway Park bridge. Choose one problem, write the source, calculate with the correct unit, and explain why the model might differ from real life. That is a complete, useful mathematical discovery.


