
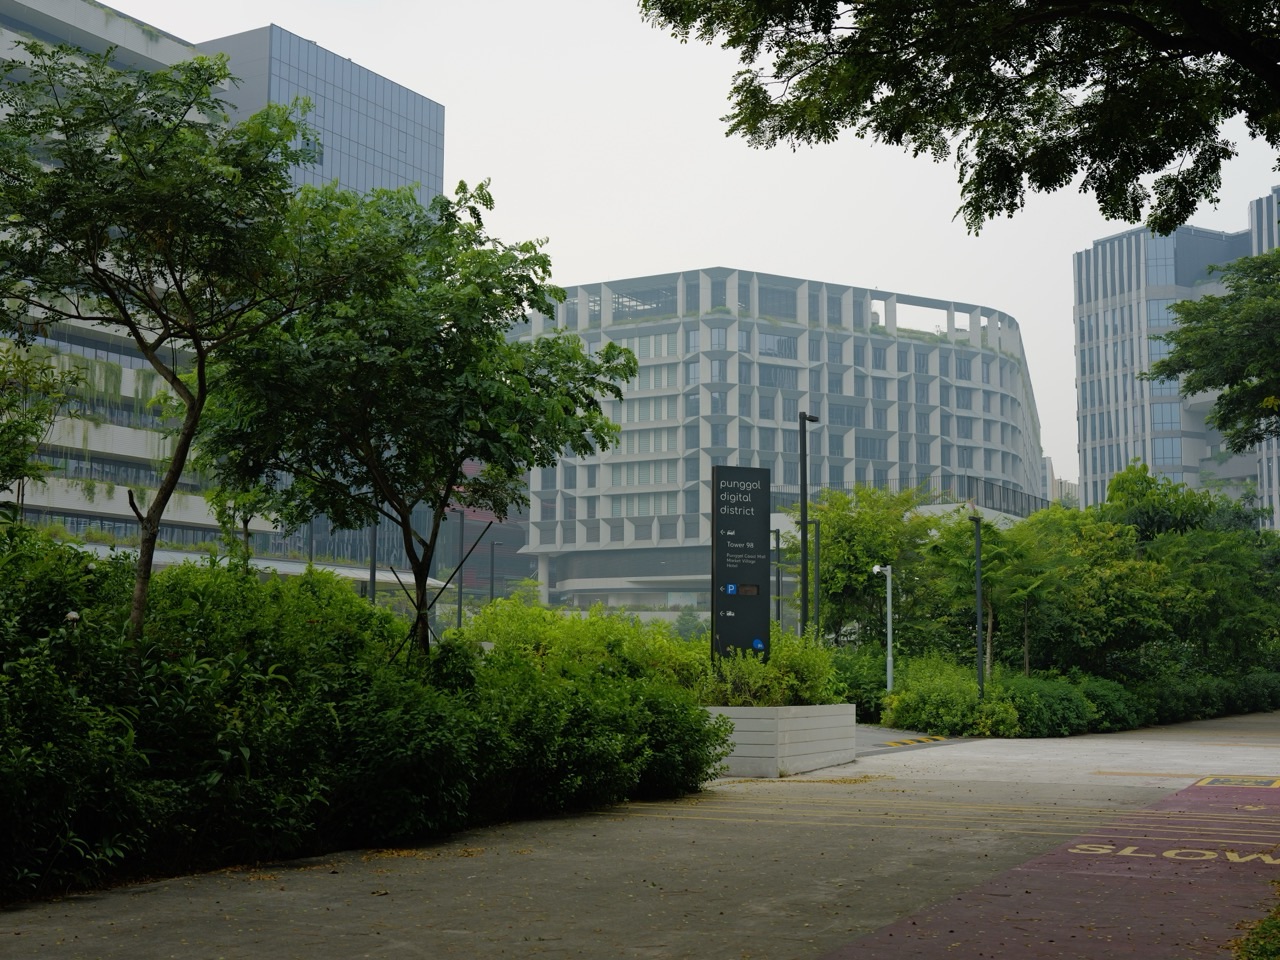
Punggol Digital District’s district cooling system uses a central plant and pipe network to deliver chilled water to connected buildings. ENGIE designs, builds and operates the system described by JTC; SIT also confirms that its Punggol Campus is connected to centralised chilled-water cooling.
For anyone searching how air-conditioning works at PDD or SIT Punggol, the key idea is shared infrastructure: cooling is supplied across connected buildings rather than every building maintaining a separate cooling plant. ENGIE’s district cooling explainer shows the plant, pipelines and building transfer station.
JTC describes potential energy savings of up to 30% against standard commercial buildings. Treat that as the published comparison, rather than a promise about an individual tenant’s bill. Below, we explain the water route, the role of controls and why this infrastructure also matters for students.

Find what you need
Follow the chilled-water route
Read the energy-saving figures carefully
Follow the chilled-water route
ENGIE’s explanation starts with a central chilled-water plant, then pipes supplying buildings through energy transfer stations. The building uses that cooling within its own systems. A useful way to picture it is a shared cooling service reaching several destinations.
Follow the sequence when explaining it to a child: plant, pipe, building connection, indoor cooling. This makes the otherwise hidden infrastructure easier to understand than beginning with a long list of equipment names.
Why share the cooling plant?
The JTC feature on ENGIE’s PDD system describes an underground central plant, monitored from a control room. Sharing plant infrastructure can reduce equipment duplication and free space that would otherwise be needed for separate building cooling facilities.
The educational question is therefore about scale: what can several buildings do together that would be harder to organise independently? A shared service also requires coordination, so the building connection and operating arrangements remain important.
Read the energy-saving figures carefully
JTC’s feature gives an estimated annual carbon reduction of 3,700 tonnes alongside the energy comparison. These are figures in the project description, not a live display of measured savings for the day you visit.
For a school report, put the number beside its meaning: percentage reduction compared with what, estimated over what period, and stated by which organisation? Keeping those details together makes the claim easier to assess and explain.
How does data help manage cooling?
JTC describes interaction between cooling controls and PDD’s Open Digital Platform. Monitoring provides information about the system’s condition and performance, supporting decisions about operation and maintenance.
In an explanatory sketch, give the water route one colour and the information route another. This is a suggested learning activity: water delivers cooling, while data helps people and controls understand what the system is doing.
What is the connection with SIT?
SIT’s sustainability page says its ENGIE partnership uses district cooling as a living laboratory, with real system data supporting learning and applied projects. Infrastructure becomes something students can study as well as use.
For the broader district, continue with our PDD sustainability guide. For the information layer, see the Open Digital Platform explainer. A public walk through PDD should follow visitor routes; plant access requires separate arrangements.
Independent eduKatePunggol guide. Official sources checked on 11 October 2026. Consult the linked official pages for current service details and arrangements.


