
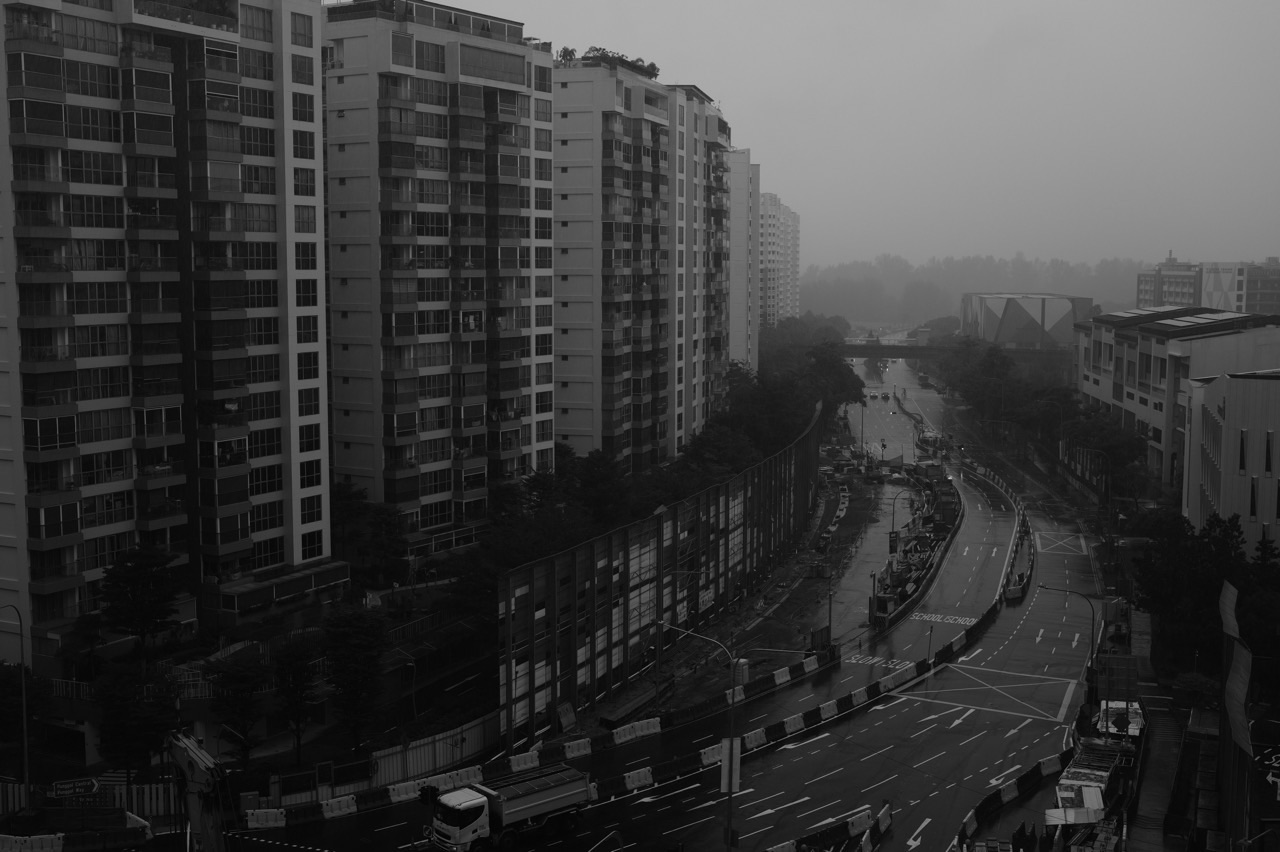
After a sudden downpour, a Secondary 4 student in Punggol looks at a wet road and says, “That’s climate change.” The observation is understandable, but the conclusion needs care. A rainy afternoon is weather; a change in long-term climate patterns requires evidence over a much longer period. Parents searching for Secondary 4 Geography tuition in Punggol, O-Level Geography climate change, climate action revision or SEC Geography exam questions often find their child knows the headlines but cannot turn them into a precise, examinable explanation.
Secondary 4 Punggol Geography tuition should connect climate processes, geographical evidence, unequal risks and climate-action strategies to accurate structured and evaluative exam answers. Students learn to distinguish weather events from climate trends, explain mechanisms rather than repeat slogans, compare adaptation and mitigation, analyse exposure and vulnerability, and judge whether a response is suitable for the place and population specified. The goal is not merely to memorise “climate change is dangerous”; it is to show how a changing climate interacts with human and natural systems, and what a defensible decision looks like.
Singapore’s coastal geography and highly urbanised environment provide meaningful context, but local experiences must be interpreted carefully. A photograph of standing rainwater does not prove a location is chronically flood-prone; a hot afternoon does not establish a decades-long warming trend. At the same time, official climate assessments show why long-term preparedness matters. A Geography tutor uses that tension—serious consequences, careful evidence—to build mature judgement.
This is the final article in our third four-year Geography progression, following Secondary 1 water resources, Secondary 2 housing and sustainable cities, and Secondary 3 sustainable tourism. It develops the specialist climate topic beyond our earlier broad Secondary 4 O-Level and SEC Geography revision guide and past-paper and prelim correction guide. Actual topics and assessment structures must be checked against the student’s current syllabus and school programme.
Explore: course and syllabus · climate process · source evidence · exposure and vulnerability · Singapore impacts · mitigation and adaptation · worked exam answer · inside tuition · parent questions.
First identify the correct climate syllabus and examination year
For 2026 GCE O-Level school candidates, official SEAB listings include standalone Geography 2279 and Humanities (Social Studies, Geography) 2260. For 2027 Singapore-Cambridge SEC G3 candidates, the subjects are labelled K329 Geography and K335 Humanities (Social Studies, Geography). G2 courses have separate requirements. A tutor should not treat these codes as interchangeable or assume a student’s older practice paper reflects the exact current assessment.
The SEAB 2027 G3 syllabus directory links to the current Geography syllabuses. The K329 standalone Geography syllabus identifies a Climate cluster covering weather and climate, climate change and climate action. The current 2026 O-Level syllabus directory provides the predecessor subject references.
Course format and required examples depend on the candidate’s own year and pathway. This matters before a tutor assigns questions about global circulation, climate action or Singapore risk. Learning one accurate process is useful; learning a whole chapter outside the student’s assessed scope while leaving required material untouched is not.
What the first climate revision diagnostic should reveal
A tutor can give three short tasks: interpret a climate or rainfall graph, explain a relevant climate process and evaluate one management measure. These tasks deliberately require different cognitive moves. A student may know the topic but confuse units, recall a cause but omit the mechanism, or name a strategy without judging how it works.
The tutor asks the child to describe their first thought on seeing each question. Do they inspect the year and unit? Can they distinguish a short-term weather record from a long-term climate trend? Do they understand the role of greenhouse gases? Do they read the word “assess” as a request for a judgement rather than a list of actions?
Feedback should identify the first error, not simply the final lost mark. “You used a single event to prove a long-term trend” requires evidence literacy. “You linked carbon emissions directly to coastal flooding without explaining the intermediate climate processes” requires a clearer causal chain. “You wrote advantages but never judged the measure” requires evaluation.
Once the weak link is known, the tutor models a repair and tests it on a changed question. This is more useful than distributing another thirty-page summary of climate change facts.
Climate change begins with a process, not a dramatic consequence
Students need to distinguish the Earth’s natural greenhouse effect from the enhanced warming associated with increased concentrations of greenhouse gases. Solar energy reaches Earth, some energy is absorbed, and the surface and atmosphere emit infrared radiation. Greenhouse gases absorb and emit infrared radiation, influencing Earth’s energy balance. Increasing their concentrations can contribute to warming.
A common misconception says greenhouse gases stop all heat from escaping, or that climate change is simply caused by a hole in the ozone layer. These descriptions are inaccurate. A tutor should explain the relevant physical mechanism at the level required by the syllabus and avoid replacing science with a memorable but misleading shortcut.
Human activities that add greenhouse gases to the atmosphere can strengthen warming effects. Different gases, sources and feedbacks may be important in the relevant curriculum. The student should be able to trace a simple chain from increased greenhouse-gas concentration to an altered energy balance and warmer long-term conditions without claiming every location warms in the same way at every time.
The tutor may use a labelled schematic, then remove labels and ask the learner to explain the arrows. A diagram that is merely memorised offers little protection against an unfamiliar question; explaining each part aloud reveals whether the process is understood.
Weather is not climate: the distinction still matters in Secondary 4
Weather describes atmospheric conditions over short periods at particular places. Climate concerns patterns and distributions of atmospheric conditions over longer periods, usually established using multi-year observations. Weather varies from day to day; climate is not a claim about one afternoon.
A learner may accurately report that Punggol experienced intense rain on a particular day. They may not use that isolated observation to prove a long-term increase in rainfall extremes. Establishing a change requires an appropriate baseline, long-term records and a suitable analysis. Similarly, an unusually cool day is not evidence that global warming has stopped.
This distinction is important beyond examinations because students encounter weather claims attached to climate arguments in news and social media. Geography can teach them to recognise the difference between a striking event and a long-term pattern without dismissing the importance of either.
How a tutor teaches climate graphs without guesswork
Before writing, students should identify what a graph measures, the unit, location, observation period and whether the data are daily measurements, monthly averages, annual means, anomalies or projections. A climate graph with rainfall in millimetres and temperature in degrees Celsius requires care: the axes do not represent interchangeable quantities.
A tutor may show a fictional monthly temperature chart and ask for its warmest month. Then a separate long-term dataset is presented and the child is asked to describe an observed trend. The student must not use the first chart to answer the second question’s time frame.
When a graph shows a temperature anomaly, the value is a difference from a defined reference period, not necessarily an absolute temperature. If the student treats an anomaly of +1.2°C as the day’s temperature, the interpretation collapses before the explanation begins.
The tutor uses source checks before content recall: state the variable, unit, period and comparison. These small habits save marks across Geography question types, not only the Climate cluster.
Evidence: observations, trends, projections and limits
Climate evidence can include weather-station records, long-term datasets, sea-level measurements, physical observations, models and projections. Each serves a different purpose. A recorded historical trend and a modelled future outcome should not be presented as the same kind of fact.
A projection describes a potential future under specified assumptions and uncertainty. It can be valuable for planning without promising that a precise outcome will occur at a specific date at every location. The tutor trains students to read scenario descriptions, time horizons and qualification language.
One of the most valuable skills is to make an accurate claim modestly. “The displayed long-term series shows an overall increase across the selected years” is stronger than “temperatures rise every single year” when the graph contains fluctuations. The student should describe the pattern in the data, not an oversimplified slogan.
Climate risk: hazard, exposure and vulnerability are different ideas
A climate-related hazard is a potentially damaging event or condition, such as extreme heat, heavy rainfall or rising sea level. Exposure concerns people, infrastructure or ecosystems located where the hazard may affect them. Vulnerability concerns susceptibility to harm and capacity to cope. Together these help explain why consequences differ among places.
Imagine two fictional coastal communities facing similar water-level conditions. One has more buildings in low-lying exposed areas and limited preparedness. Another has protective measures, planning and effective response systems. The risk of harmful consequences need not be equal even if the underlying hazard is similar.
The tutor should teach these distinctions visually. Students can label hazard, exposure and vulnerability in a scenario and then explain how changing one factor may alter risk. An unsupported sentence such as “the poor always suffer more” should be replaced by a relevant mechanism and carefully described conditions.
This is the foundation of good climate-action evaluation: before judging a response, identify which part of the risk it changes.
Singapore’s climate challenges: a local case with verified evidence
Singapore is a low-lying and densely developed island city-state in the tropics. Long-term climate changes can have implications for coastal protection, heat, water, health, ecosystems and infrastructure. The particular impact depends on where people and assets are exposed, the nature of the hazard and the measures taken.
The National Climate Change Secretariat’s adaptation overview reports an increase in annual mean temperature of approximately 0.24°C per decade from 1984 to 2022. It also discusses projected sea-level changes by the end of the century. These are dated official scientific summaries; the tutor should preserve the period, definition and projection conditions if using them in a case.
A useful comparison asks the child to separate an observed historical warming trend from a projected future sea-level range. One is a summary of measurements over a defined past period; the other is a scenario-informed future estimate. Confusing the two can distort a structured answer.
The student should not extrapolate a national summary to claim a specific Punggol path or block will flood in a particular year. Local exposure and engineering details require site-specific evidence.
Coastal change: how higher sea levels can affect exposed places
Rising sea levels can increase coastal flood exposure in relevant low-lying areas, depending on local geography, protective measures and water-level conditions. The process does not mean the entire coastline is covered by the same depth of water at the same moment.
A sound explanation traces the mechanism: changes in average sea level can alter the baseline for high-water events, potentially making inundation more likely or severe for exposed places under specified conditions. Homes, transport or ecosystems in those places may face disruption if they are not adequately protected.
A tutor may ask students to interpret a fictional coastal cross-section showing elevation and projected water levels. They should identify which areas are exposed in the diagram and what details are missing, rather than state that all buildings will be affected.
This directly links Secondary 1 water resources to upper-secondary climate action: water is both an essential resource and, under particular conditions, a hazard that must be managed.
Heavy rainfall: why one wet road is not a climate trend
Intense rain can generate surface runoff that challenges drainage systems under certain conditions. The actual likelihood and consequence of flooding depend on terrain, surfaces, rainfall intensity, water levels and infrastructure performance. A photograph taken during rain is evidence of that moment, not proof of chronic flood risk.
A learner may see a graph of rain intensity during one storm and confuse it with a multi-decade record of extreme rainfall. The tutor should distinguish those datasets. An event-level graph can explain a particular storm’s characteristics; trends in event frequency or intensity require longer-term evidence.
Risk-management measures can include drainage improvements, planning, preparedness and other responses where relevant. Each should be explained by the mechanism it addresses, and the answer should avoid promises that one strategy eliminates all flooding.
Urban heat: an environmental issue that links design and climate
Urban environments can have distinct local temperature patterns because surfaces, vegetation, built form and human activity influence energy exchange and airflow. The urban heat island effect is related to urban development and local conditions; it should not be confused with the global greenhouse effect, although warming can interact with urban heat risks.
A fictional fieldwork comparison might show two school sites with different shade, surface material and temperature readings. The student can describe the observed difference, but should not claim that one factor caused it without considering observation time, measurement method and other differences.
Climate adaptation measures relevant to heat may involve shade, vegetation, building design, cooling strategies and health preparedness. The tutor should distinguish a plausible benefit from a measured result, particularly when using an attractive photograph rather than data.
Biodiversity, water and health: avoid a single giant ‘climate impact’ paragraph
Climate change can affect natural ecosystems, water-related risks and health through different pathways. Students should not combine them into an unordered list of disasters. For each, the learner identifies the relevant change, the exposed system, the mechanism and the potential consequence.
A claim about water security might discuss changes in rainfall patterns and demand alongside infrastructure resilience. A claim about health might involve heat exposure or conditions influencing some disease risks. Each requires a distinct chain and appropriate evidence.
By the end of the lesson, a student should be able to answer “Which process connects this climate hazard to the stated consequence?” without reaching for a universal sentence saying it is “very dangerous”.
Climate action: mitigation and adaptation are not interchangeable
Mitigation addresses drivers of climate change, for example by reducing greenhouse-gas emissions or increasing suitable carbon removal. Adaptation involves adjusting human or natural systems to actual or expected climate impacts, reducing some risks or managing consequences. Climate action often requires both.
A tutor should insist the student state what a measure acts on. A policy that reduces emissions may contribute to limiting further warming over time; it does not by itself stop tomorrow’s heavy rain at a specific street. A coastal-protection project may help manage inundation risk at a site; it does not by itself reduce global greenhouse-gas concentrations.
The classification is not always rigid. Some measures can provide both mitigation and adaptation benefits, and others involve trade-offs. The important skill is explaining the actual mechanism rather than attaching a fashionable label.
| Measure in a hypothetical plan | Main intended pathway | Evaluation question |
|---|---|---|
| Reduce emissions from energy production | Mitigation: limits additional greenhouse-gas emissions | What energy, cost and implementation constraints matter? |
| Improve protection of exposed coastal assets | Adaptation: manages coastal hazard exposure or effects | Which places and water-level conditions are covered? |
| Increase appropriate urban shade and vegetation | Adaptation: may reduce heat exposure; other environmental benefits depend on design | Where will shade help and how will outcomes be assessed? |
| Support building energy efficiency | Primarily mitigation through reduced energy demand; can intersect with resilience | Are savings, costs and user needs evidenced? |
Teaching mitigation as a causal mechanism
The basic reasoning is that lowering the release of greenhouse gases or increasing appropriate removals can influence the future concentration of these gases and the scale of additional warming over time. Students should be careful with claims about immediacy, scale and effectiveness.
A weak response says, “Solar energy stops global warming.” A developed response explains that generating electricity from lower-emission sources may reduce fossil-fuel-related greenhouse-gas emissions compared with a suitable alternative, depending on system design and life-cycle considerations. No single technology eliminates every climate risk.
A tutor can ask the student to name the emissions source, explain what changes and identify one meaningful condition affecting uptake or performance. If the child can do this for an unfamiliar action, they are using mitigation as a concept rather than memorising a slogan.
Teaching adaptation as risk management
Adaptation begins by identifying what is at risk. Is the concern coastal inundation, heat exposure, water security or another impact? The strategy should act on the relevant vulnerability, exposure or hazard pathway where feasible.
An example involving shade for outdoor users targets some aspects of heat exposure. A flood-warning arrangement targets preparedness and response. A coastal barrier may protect specified areas from particular water-level conditions. These strategies work through different mechanisms and cannot simply replace one another.
The tutor also asks what the intervention may fail to address. Shade does not remove all heat-related risks; warning without the ability to respond may have limited value; one defence may protect a site but leave issues elsewhere. Good adaptation evaluation considers conditions, not perfect guarantees.
A practical risk-analysis chain for Geography questions
Before recommending action, students should identify the climate-related hazard, who or what is exposed, why some groups are vulnerable, the consequences under relevant conditions and how the proposed measure changes that chain. A diagram can help at first, but the learner should eventually build the argument without prompts.
For instance, two fictional neighbourhoods both experience extreme heat. One has sheltered access routes and effective cooling arrangements for at-risk residents; the other has limited shade and fewer support resources. The hazard may be similar, while exposure and ability to cope differ. The tutor asks which factor the proposed strategy would change.
An excellent answer may recognise that improving resilience involves more than a single structure: planning, maintenance, public information, infrastructure and community capacity can interact. Students should explain only the elements relevant to the question instead of listing every intervention they have heard of.
Why climate solutions involve trade-offs
Climate action uses money, land, materials, energy and institutional attention. It can affect communities differently. A measure that protects one area might change water movement elsewhere; an infrastructure project may involve construction impacts; a household-based measure may be harder for lower-income families to adopt.
Evaluation does not require rejecting every solution. It means explaining how benefits, limitations and distributional effects relate to the stated objective. The tutor asks students to consider costs and opportunities only where evidence or geographical knowledge makes them relevant.
A student who writes “the most expensive solution is best” has not justified effectiveness. Another who claims “nature-based measures always work” is also overgeneralising. Real geographical judgement depends on context and evidence.
Worked climate-action exam question: explain, then evaluate
Illustrative question: A low-lying fictional coastal community expects increasing sea-level-related risks over the long term. Explain one way a coastal defence could reduce impacts, then assess the likely effectiveness of relying on this defence alone.
Weak response: “Build a wall and the sea will not flood the town.” The answer identifies an action but promises complete protection without describing its design, physical conditions or limitations.
Stronger explanation: “A suitably designed coastal defence may reduce the movement of seawater into a protected low-lying area during water-level events within its design conditions. This could lower the exposure of buildings and infrastructure behind it to coastal inundation.”
Stronger evaluation: “Its effectiveness depends on the defence’s location, height, design, maintenance and the range of water-level events it is intended to manage. Relying only on a barrier may leave risks associated with drainage, extreme conditions or other exposed areas, so complementary planning and preparedness may still be needed.”
The improvement lies in the mechanism, criteria and acknowledged limits. The tutor then changes the case to a higher-elevation community, or asks about heat instead of sea-level rise. If the student keeps repeating the coastal paragraph, the concept has not transferred.
Worked climate-data interpretation: a trend is not every data point
Suppose a fictional classroom dataset shows annual average temperatures of 27.1°C, 27.4°C, 27.2°C, 27.7°C and 27.8°C for five selected periods. The series increases overall from first to last, but not every consecutive value rises. The student should describe both the overall change and any relevant fluctuation accurately.
The difference between the first and last values is 0.7°C. That is an absolute temperature change across those given observations, not a percentage, and not a rate per decade unless the time intervals justify calculating such a rate.
The tutor asks whether this short fictional series proves the cause of climate change or determines a future temperature. It does neither on its own. Establishing mechanisms and future projections requires other scientific information. The lesson is about making a claim no stronger than the evidence.
Now show a separate official long-term graph. The child checks its baseline, dates and whether plotted values are observations or projections. This ability to change reading method with the source is particularly important in upper-secondary Geography.
How command words change a climate answer
Describe may require a trend, distribution or observable characteristic. Explain asks for a process or causal relationship. Compare requires common criteria. Assess or evaluate requires a judgement with evidence, conditions and limitations. Every answer must still follow the precise wording and assessment instructions.
A common mistake is to write an essay on the greenhouse effect when the question asks how one adaptation strategy affects coastal exposure. The content may be scientifically relevant to climate change generally, but it does not perform the requested task. The tutor should teach topic selection by command and focus.
A short answer can be excellent if it gives the exact value with correct units. A longer answer may be needed to develop several causal links and an evaluation. Writing length should reflect the marks and complexity of the question, not the child’s anxiety.
The real paper matters: G3 standalone and Humanities combinations
A student using the 2027 K329 G3 standalone Geography syllabus will find a specified two-paper scheme and assessment objectives that include knowledge, skills and judgement. That syllabus places the Climate cluster within the published paper structure and includes level-descriptor assessment for certain evaluative questions.
Do not infer that every Geography component uses the same paper, marks or weighting. The K335 Humanities combination syllabus has its own assessment arrangements, and G2 subjects differ. Tutors should match practice to the student’s actual syllabus and year rather than teach a universal template.
The correct examination strategy combines accurate content, source reading, answer relevance and time management. Students should not practise a specific “nine-mark essay formula” on every question without checking which task actually uses those marks and criteria.
Singapore as a climate case study—not an invitation to invent local damage
Singapore’s National Climate Change Secretariat publishes summaries of climate trends, vulnerabilities and adaptation approaches. These can support accurate place-specific context for Geography study. A child should attribute figures to the official source and preserve the time periods and uncertainty language.
An important distinction is between national-scale climate projections and site-specific consequences. A projection of sea-level change for Singapore is not a claim that any named Punggol housing block will be submerged on a certain date. The tutor should help learners identify what additional elevation, design and protection information would be needed.
The same caution applies to local photographs of roads after rain. Use them to begin observing surfaces, drainage features and exposure—not to diagnose infrastructure failure from a single frame.
Microclimate fieldwork: measuring instead of guessing
Where the school programme includes geographical investigation or microclimate comparisons, students may work with temperature, relative humidity, wind or site characteristics. The first requirement is a clear question and consistent measurement method, not an elaborate graph.
A fictional exercise compares temperature readings in a shaded school courtyard and an open paved area at comparable times. The student describes the measured difference and suggests possible factors while acknowledging that instruments, timing, wind and other site differences can influence results.
Real fieldwork must follow school instructions, safety rules and permissions. Tutors can teach methods with synthetic datasets; they should not present practice numbers as actual Punggol environmental observations.
This inquiry method strengthens examination evidence handling: question, method, measurements, interpretation, conclusion and limitations. A student who learns where data come from is less likely to make unsupported claims in case-based climate answers.
The climate case-study card: concise but evidence-rich
A helpful climate case card identifies the place, climate-related issue, mechanism, people or environments exposed, responses and their relevant limitations. A verified statistic should have a clearly indicated source and date. Separate observed trends from modelled projections.
Rather than memorise a long paragraph about every country, students can practise using one accurate case to answer several different questions: an explanation of exposure, an adaptation evaluation and a comparison of stakeholder needs. Each task requires selecting different details.
If a fact belongs to an older source or a different policy context, do not relocate it to a new case simply because the topic sounds similar. Accurate case identity is more useful than dramatic numbers.
Inside an illustrative Secondary 4 climate Geography tuition session
A ninety-minute small-group tutorial might open with retrieval of the enhanced greenhouse-effect mechanism and a two-minute climate-graph reading check. The tutor then examines one recent answer and names the first error: missing causal link, data misreading, confusion between adaptation and mitigation or weak evaluation.
The main teaching section addresses that exact gap with a short explanation and worked example. Learners then complete a fresh question independently. The tutor checks each student’s reasoning, not just the final sentence, and offers specific feedback.
A second question changes the place or strategy. The child must adapt the climate mechanism and the judgement rather than repeat the original model. Once accuracy is stable, the class can practise an appropriate timed section from a paper matching the learner’s examination year.
The lesson ends with one small home target and a brief progress record. The student should be able to say which error became less likely and demonstrate the change on unfamiliar material.
A final-year climate revision plan that remains manageable
Begin with core processes: greenhouse effect, weather-versus-climate distinctions and the relationship between hazards and vulnerability. Next, retrieve climate-impact mechanisms and their accurate case evidence. Then practise mitigation and adaptation evaluations on mixed scenarios.
Short spaced reviews are useful because processes can be forgotten after a topic is “finished”. An older climate graph can be revisited with changed questions; a case card can be recalled without notes; a previously weak explanation can be rebuilt after a delay.
Increase timed mixed-question practice once the reasoning is reliable. A student who is confused about a mechanism may need teaching, while one who understands but writes too much may need better selection and pacing. The tutor should not solve both problems by assigning more identical papers.
Climate exam mistakes that deserve targeted correction
- Weather versus climate: one day is treated as proof of a long-term trend.
- Ozone versus greenhouse effect: unrelated mechanisms are conflated.
- Impact without pathway: warming is jumped straight to harm without intermediate processes.
- Hazard equals risk: exposure and vulnerability are ignored.
- Adaptation equals mitigation: strategies are classified without explaining what they change.
- One solution is perfect: design conditions, costs and limitations are omitted.
- Forecast equals projection: a scenario-based future estimate is treated as a certain local prediction.
- Case misattribution: a figure or policy is assigned to the wrong place or year.
A good tutor chooses the first recurrent error and repairs it with a new task. The correction should specify the mental move to change, not simply instruct the student to “write more detail”.
How parents can tell whether climate revision is improving
Look for independent explanations that preserve the full causal chain. The student should read new graphs with correct units and timeframes, distinguish observed changes from projections, select appropriate adaptation or mitigation examples and evaluate a strategy against a stated objective.
Compare first attempts across several weeks using comparable but different prompts. Count how often the student needs a hint and whether the same error returns. A polished answer completed after heavy tutor guidance is not as strong evidence as a clear answer to an unfamiliar question.
No tutor can guarantee an examination result. The more defensible promise is a transparent method, targeted practice and a record of improving independent performance.
What a Punggol parent can do at home
Ask the learner, “Is that weather or a climate trend?” or “What is the evidence and what is the mechanism?” or “Does this strategy reduce emissions, reduce exposure, or do both?” You do not need to know every Geography fact to prompt careful thinking.
Avoid turning every news headline into a test. Keep revision manageable alongside other subjects and sleep. When the student makes a precise observation about a claim’s time frame or limitation, that is worth recognising.
For exam logistics, always follow the school and current SEAB requirements. A well-practised reading routine and adequate rest are more useful than a late search for supposedly guaranteed climate questions.
Official climate references and eduKate learning routes
For national context, use Singapore’s official climate adaptation overview. For course requirements, check the SEAB 2027 G3 directory and the relevant current syllabus.
For broader exam preparation, read Secondary 4 Geography O-Level and SEC Exam Revision. To strengthen source practice and identify recurring errors, see Geography Past-Year Papers and Prelim Revision.
If the learner needs a stronger foundation in understanding data, visit Geographical Data Interpretation and Evidence. The immutable reference for learning design is eduKateSG’s Clementi small-group benchmark: diagnose, explain the first principle, correct the specific mistake and test independent transfer.
The full four-year topic progression: start with Secondary 1 Water Resources and the Four National Taps, progress through Secondary 2 Housing and Sustainable Cities and Secondary 3 Sustainable Tourism Development, and finish with climate change and climate action here. Use the earlier stage that matches the student’s actual learning gap; this is a route for understanding, not a race to finish chapters.
Secondary 4 Punggol Geography climate-action tuition: FAQs
Is climate change part of upper-secondary Geography?
Yes, the published upper-secondary Geography frameworks include Climate topics, but the precise coverage and assessment format depend on whether the learner takes standalone Geography, a Humanities combination, G2 or G3, and the relevant examination year.
What’s the difference between climate-change adaptation and mitigation?
Mitigation addresses drivers of climate change, such as greenhouse-gas emissions. Adaptation manages exposure, vulnerability and consequences of actual or expected climate impacts. Strong answers explain the specific mechanism of a named strategy.
Can a rainy day in Punggol prove climate change?
No. It is an observation of weather. Climate trends require appropriate records across longer periods and careful analysis. A single event may be important without independently establishing a long-term trend.
Do students need to memorise Singapore sea-level projections?
Use figures only when the syllabus or question makes them relevant, and keep their reference period, range, assumptions and source intact. A national projection is not a precise forecast for one individual site.
How should my child answer a climate-action evaluation?
Identify the objective, explain how the strategy acts on a hazard or underlying driver, examine the most relevant conditions and limits, and reach a judgment justified by evidence. Do not merely append an unrelated “however” paragraph.
What if my child knows the climate chapter but loses source marks?
Isolate graph-reading skill: variables, units, averages, anomalies, timeframes and observed-versus-projected values. Then test on an unfamiliar graph to check that the repair has transferred.
Does every G3 Geography paper have identical question formats?
No assumption should be made across standalone Geography, Humanities combinations or examination years. Use the actual SEAB syllabus and school directions. A question’s marks and command should determine how the student responds.
How can I judge the tuition’s effectiveness?
Ask to see a recent independent first attempt, the specific error diagnosed and a new question completed correctly with fewer hints. Evidence of transfer is stronger than the amount of revision material produced.
What should my child revise in the final week?
Prioritise stable core mechanisms, the current error log, accurate cases and short unfamiliar practice questions. Protect rest and other subjects rather than trying to memorise an entirely new online case bank at the last moment.
The goal: thinking clearly about a warming world
At the start of a lesson, a wet street may look like straightforward proof of climate change. By the end, the student can distinguish observation from trend, trace the process behind a climate risk, identify what is exposed and explain why different responses have different strengths and limitations.
That is what Secondary 4 Geography tuition in Punggol should accomplish: a student who cares about the world, handles evidence responsibly and can make a clear, defensible geographical argument when the examination question is unfamiliar.


