
When parents search for Geography tuition in Punggol, Secondary Geography tuition, O-Level Geography revision or help with Geography data-response questions, they often describe the same frustration: ‘My child studied the whole topic, but the graph question still went wrong.’ The student may know the definition of climate, understand tourism and have memorised a case study, yet still struggle to extract a dependable conclusion from a table, chart, photograph or short passage.
The core aim of Punggol Geography tuition for geographical data interpretation is to teach learners how to move from a source to a justified claim. They should identify what the evidence measures, observe patterns precisely, connect a conclusion to supporting values, recognise what the source cannot prove and use appropriate geographical knowledge to explain what they find. This ability supports lower secondary Geography, upper secondary Elective or full Geography and the unfamiliar evidence students encounter beyond school.
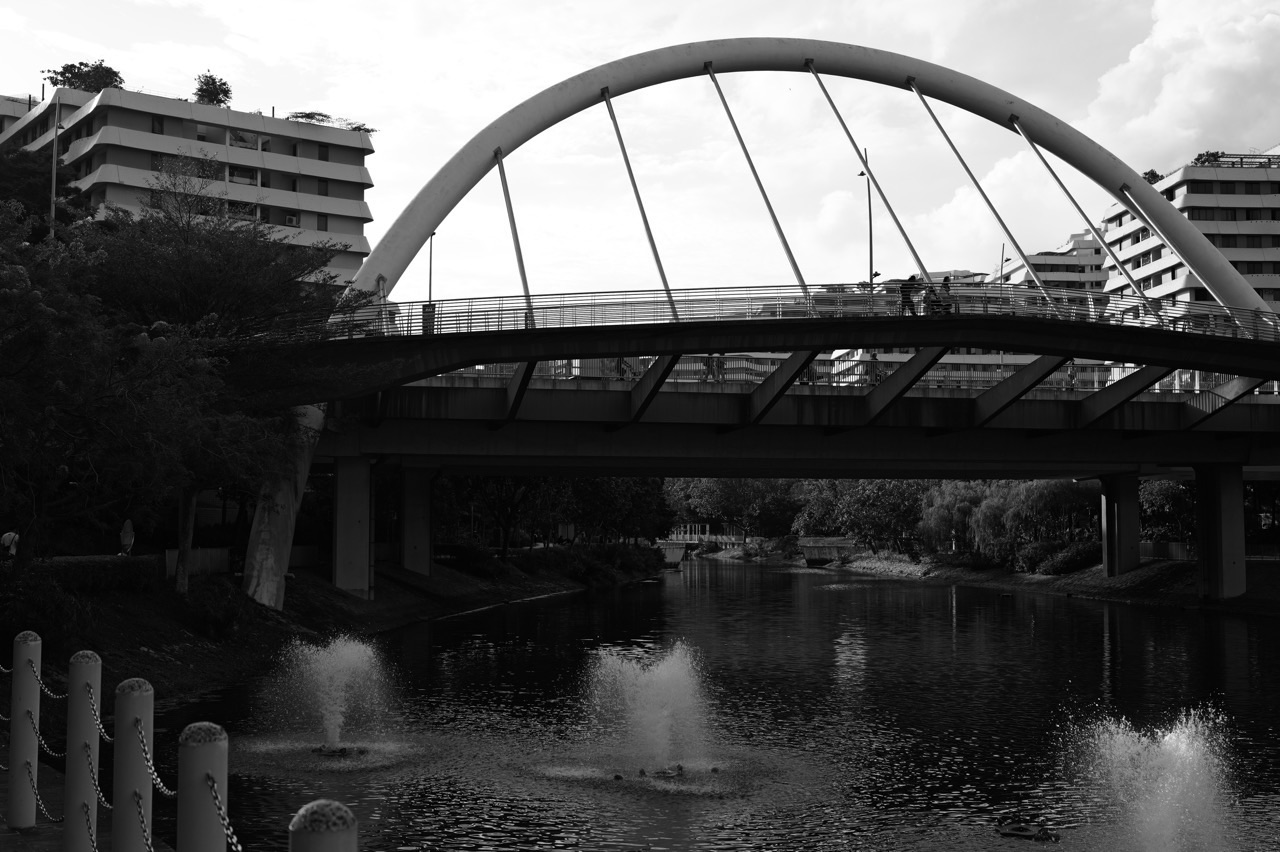
Imagine a student standing beside Punggol Waterway on a bright afternoon, guessing how many people use the path. A guess is a beginning, not data. A carefully defined count, at stated times and locations, is data; a comparison across several observations becomes a pattern; and an explanation of that pattern is a further step requiring evidence and reasoning. Geography tuition should help students recognise each step rather than leap from an interesting impression to a confident but unsupported answer.
The Core Aim: A Claim Should Know Where It Came From
A common weak response sounds impressive: ‘The area is popular because it is attractive and conveniently located.’ That may be an intelligent hypothesis. But what was the source? A bar chart of visitors by time? A map of public transport access? A questionnaire recording reasons for visiting? Each source supports different claims.
The stronger learning habit begins with a small question: ‘How do you know?’ This is not a challenge intended to embarrass the student. It is a friendly invitation to point to the exact number, visual feature, quotation, place or observation that justifies the sentence.
Data interpretation becomes reliable when a student can trace the path from evidence to statement and back again. If a value changes, the statement should change appropriately. If a missing piece of information appears, the student should be ready to revise the interpretation. That flexibility is far more useful than memorising a standard answer to a standard-looking graph.
For parents, the goal is visible. The child does not simply say, ‘I got eight marks.’ They can show which part of the source supports each conclusion and which part came from their wider geographical understanding.
Why Geography Data-Response Questions Feel Unfamiliar
Content revision makes familiar material easier to recall. Data-response work asks for something additional: read a new representation, decide what it means and connect it to the question. A student who is strong at recalling definitions may need deliberate practice with this different demand.
The difficulty can arise at several points. Some students overlook axis labels. Others describe an increase without noticing a later fall. Some quote numbers without comparing them. Others offer a compelling explanation but never address the actual values given. A student may even understand everything in the source and still fail to answer the question command.
A helpful tutor locates the first weak link rather than prescribing more of everything. If the error begins at source decoding, revising the chapter again may have little effect. If the student reads the data correctly but cannot build a geographical explanation, the next exercise should target that connection.
The distinction saves time, reduces discouragement and makes the purpose of each practice question easier to understand.
Step One: Establish What Is Actually Being Measured
Start with the source title, the variable, unit, population, location and time period. ‘Number of tourists’ is not the same measure as ‘tourism revenue per visitor’. ‘Average temperature’ is not the same as ‘maximum afternoon temperature’. ‘Percentage of surveyed residents’ is not the same as ‘percentage of all residents’.
In a table, examine the column headings before the figures. In a bar chart, read both axes and any legend. In a line graph, decide whether each line represents a different place, time series or category. In a photograph, ask when and where it was taken and what the frame excludes.
Students should learn to write a quick source identity in the margin: what, where, when, unit. The point is not to produce notes for their own sake. The point is to prevent a wrong first assumption from contaminating every sentence that follows.
Many geographical misunderstandings begin with a hidden change of denominator. A chart may show percentages of different groups while the student speaks as though the bar heights were absolute totals. The fix is not a complicated formula. It is learning to name the measure before using it.
Step Two: Describe the Pattern, Including Its Exceptions
A useful description has a direction, an extent and an anchor in the source. Rather than saying ‘It goes up’, a student might write, ‘The value rises from the earlier observation to the later one, although there is a brief decline between the two middle points.’ The answer should use exact figures when the source supplies them and the question calls for evidence.
Look for highest and lowest values, overall increase or decrease, peaks, troughs, stable periods, clusters and outliers. But resist the urge to mention everything. The best observation is the one relevant to the question. An exhaustive list of numbers is not necessarily an explanation of a pattern.
This is where a tutor can improve a student’s geographical language. ‘Fluctuates’ describes a changing value that rises and falls. ‘Steady’ implies a pattern of little change. ‘Rapid’ needs a basis of comparison. ‘Most’ and ‘majority’ should not be used casually when the values do not support them.
The student should be encouraged to check counterexamples. A graph can have an overall rising trend and a temporary decline. A place can have a high average but substantial differences between individual sites. Good answers make room for complexity without becoming vague.
Step Three: Use Evidence, Not Number Decoration
Quoting a number does not automatically make a response evidence-based. The value must support the claim being made. A student may write, ‘Visitor numbers are increasing, as shown by 120 visitors.’ Yet 120 by itself is only one figure. To prove an increase, the reader needs a comparison with another point or period.
A stronger response might state that a hypothetical count increased from 80 to 120 over the observed interval, a difference of 40. The values make the claimed direction visible. If the chart includes uncertainty, incomplete coverage or unequal observation periods, the learner should acknowledge that limitation before generalising.
Evidence can be numerical or non-numerical. A photograph may show a paved path, shade structures or a flood barrier; it cannot by itself demonstrate how many residents approve of those features. An interview may reveal a person’s experience; it cannot automatically represent every member of a population.
The basic rule is wonderfully transferable: choose evidence that bears directly on the statement. Do not add figures merely because the examination answer is expected to contain data.
Step Four: Explain the Mechanism Without Replacing the Evidence
A geographical explanation answers ‘Why might this happen?’ or ‘How does this process produce the pattern?’ For a rainfall pattern, factors might include atmospheric conditions, topography or location. For visitor patterns, possible mechanisms might include access, attractiveness, seasonality or events. The relevant mechanism depends on the question and sources.
An explanation must not be confused with the observation. ‘The highest value occurs in the last year’ is a pattern. ‘The value may have risen as a result of increased access’ proposes a cause. The second step requires a reasoned chain and, where appropriate, corroboration from another source.
Teach learners to express the chain in ordinary language before polishing it: change in condition → change in opportunity or exposure → behaviour or process → observed outcome. If one arrow is unclear, the explanation needs work.
This makes Geography more interesting, not less. Instead of memorising ’cause’ and ‘effect’ as labels, the student learns to tell a careful story about how a physical or human system operates.
A Worked Example: Hypothetical Visitor Counts Beside Punggol Waterway
Imagine an exercise in which students count people passing a chosen observation point during four equally long periods. For illustration, the recorded counts are 18, 24, 39 and 31. These are invented classroom numbers, not measurements of actual visitor activity in Punggol.
A basic question asks for the highest count. The answer is 39 in the third period. A more interesting question asks for the overall pattern: counts rise during the first three observations before declining in the fourth. A comparison question asks for the increase between the first and third counts: 21 people during equal observation intervals.
Now move to interpretation. The student might wonder whether time of day influenced pedestrian activity. That is a plausible hypothesis, not a demonstrated cause. The sheet has not yet told us about weather, school dismissal, a special event, the day of the week or how people were counted.
What should happen next? The student could propose repeated counts at comparable times across more days and record relevant conditions. They might also compare a second location. Suddenly a simple sequence of four numbers has become a small lesson in geographical inquiry, source limitations and responsible explanation.
The pupil’s success is not guessing the teacher’s preferred cause. It is correctly distinguishing the counted pattern from the explanation that still needs testing.
A Worked Example: Two Areas, One Misleading Average
Suppose a hypothetical graph reports average temperatures for two locations. Site A records an average of 30 degrees Celsius and Site B an average of 29 degrees. A rushed student concludes that everyone at Site A experiences one degree more heat at all times.
But an average summarises multiple observations. It does not show every measurement, the time of day or the variation within each site. Perhaps Site A has occasional high readings; perhaps Site B remains consistently warm. Without the underlying distribution, both possibilities remain open.
The appropriate conclusion is narrower: the reported average for Site A is one degree higher over the defined measurement period. An explanation of why would need evidence of shade, ground cover, wind, surrounding structures, site positioning or other relevant factors.
This lesson is important because Geography frequently compares averages, rates and indices. The student should be able to use summaries confidently without pretending that a single summary reveals every local condition.
Why Percentages Can Be So Deceptive
Percentages are helpful because they allow comparisons between groups of different sizes. They can also mislead if the denominator is missing. Imagine 60% of a small sample supporting a proposal and 55% of a much larger sample supporting it. Which represents more people? We cannot know without the numbers surveyed.
Likewise, an increase from 10% to 20% is a rise of ten percentage points and a doubling of the percentage. Those are different descriptions. A student does not need advanced mathematics to recognise that the wording changes what readers imagine.
Good Geography tuition pairs percentages with questions: ‘Percentage of what?’, ‘How many observations?’, ‘Were the samples chosen fairly?’ and ‘Can these two figures be compared?’ This protects the student from repeating striking numbers without understanding their basis.
Where a source combines maps and proportions, the tutor should ensure the student understands whether the shaded regions differ in total population, share of a group or count per area. The darkest colour is not always the largest number of people.
Reading Graphs With Unequal Axes
Axes are part of the argument a chart communicates. If a vertical axis begins above zero, differences may look visually dramatic even when the numeric change is modest. That does not automatically make the chart invalid, but the reader must inspect the scale.
Time intervals matter too. A line joining observations taken one day apart may visually resemble a line joining observations taken a year apart. The student should identify whether spacing is equal and whether a graph represents continuous measurements, selected moments or grouped categories.
Bar charts, line charts, scatter plots, tables and maps serve different purposes. A line chart may make trends over time more visible. A scatter plot may show a relationship between two variables. A map can show where measurements are distributed. None automatically proves a cause.
Practice should include intentionally tricky visual design, provided the student is told that the exercise tests careful reading rather than suspicion of every graph. Learning to question a source means understanding its construction, not assuming somebody has acted dishonestly.
Data, Information, Inference and Judgement
These words are often used as though they mean the same thing. They do not. Data are recorded observations or responses. Information emerges when the data are organised and described. Inference is a reasoned statement that goes beyond direct observation. Judgement weighs evidence, alternatives and limitations to reach a defensible conclusion.
For example, a table gives recorded rainfall values. A student describes which month has the largest figure. They infer a possible seasonal pattern, using multiple values and contextual knowledge. They then judge whether the evidence is sufficient to support a proposed decision about planning an outdoor event.
Each stage has a different burden of proof. Some questions require only a direct reading. Others demand analysis or evaluation. A tutor should teach students to identify where the question sits along that ladder.
This is also where English matters. Words such as ‘shows’, ‘suggests’, ‘may indicate’ and ‘proves’ carry different strengths. Students become more accurate geographers when they use a verb matching the strength of the source.
Correlation Is Not the Whole Explanation
Two variables can rise together without one causing the other. Consider visitor numbers and the number of shops in an area. More visitors may encourage shops to open; more shops may attract visitors; a third influence such as improved access may affect both. A graph showing both increases cannot settle which mechanism dominates.
Students should learn to propose competing explanations and identify what evidence might distinguish them. The goal is not to make every answer an elaborate research paper. It is to avoid treating any visible relationship as a confirmed cause.
A useful tutorial prompt is, ‘Name one other reason this pattern could occur.’ The student might suggest a difference in data collection, a related policy, weather, seasonal timing or changes in the wider region. If they can explain why that alternative matters, they are developing strong analytical thinking.
The deeper How Geography Works library explores these mechanisms across spatial patterns, relationships and evidence. This tuition article keeps the focus on the classroom skill of making an accurate claim from a new source.
Photographs Are Data Too—but They Have a Frame
A photograph can contain geographical information about built form, land use, vegetation, water, pedestrian movement and visible environmental conditions. Yet every photograph has a frame, a viewing angle, a time and a photographer’s choice about what to include.
Ask a student to make two columns: ‘visible’ and ‘not established’. Visible might include the presence of a path or trees. Not established could include the average number of users, long-term water quality or the intention behind a planning decision. This simple separation trains evidence discipline.
Comparing photographs from different dates introduces another challenge. Were they taken from the same viewpoint? Do they represent the same site? Could differences in season, time of day or camera framing affect the apparent change? Without such checks, a before-and-after story can become too simple.
For a local conversation, photographs taken during a family walk can be valuable teaching material. But a student should learn the same restraint when viewing unfamiliar landscapes in a school assessment.
Case Studies Should Supply Evidence, Not Just Names
Students sometimes memorise case-study names and a handful of facts, then try to insert them into every question. This creates the appearance of revision without developing the ability to decide which example actually fits the task.
A useful case-study notebook contains five elements: place and context, the geographical issue, a key process or decision, an evidence example and an important limitation or trade-off. Instead of memorising a list of dramatic claims, the student builds a compact explanation that can be adapted.
If the topic concerns climate adaptation, an example should show what hazard or vulnerability is involved, who responds and why the response might help. If the topic concerns tourism, the learner should distinguish economic, social and environmental effects rather than presenting every development as purely beneficial.
The important phrase is ‘relevant evidence’. A case study that the student can explain and apply appropriately is worth far more than three impressive names inserted where they do not belong.
How to Write a Strong Data-Response Paragraph
Begin with a statement that answers the question. Add one or two pieces of relevant source evidence. Explain the pattern or relationship when the command requires explanation. Finally, qualify the claim if the material has a meaningful limitation. This is a guide, not an inflexible template for every mark allocation.
For a hypothetical graph, a response might say that visitor activity is higher during the third observation period than the first, citing the counts of 39 and 18. If asked to suggest reasons, the student can then discuss a plausible role for timing or accessibility while indicating what remains unverified.
The paragraph should not hide behind jargon. ‘This shows a positive trend’ is weaker than a clear comparison if the line rises and falls significantly. ‘The results are reliable because there are numbers’ is not an adequate assessment of method. Precision beats formality.
The best editing question is, ‘Could another reader point to the same evidence and understand why this sentence follows from it?’ If yes, the student has created a useful chain of reasoning.
An Illustrative Tuition Lesson: From Chart to Explanation
The lesson begins with an unfamiliar chart. For three minutes the student records the variable, units and one trend. The tutor observes whether the first reading is correct and avoids rescuing the answer prematurely.
Next, the student compares two meaningful points. If they choose irrelevant values, the tutor asks what the question is requesting. If the values are useful but the wording overstates them, the tutor challenges the quantifier. If the answer is correct, the task becomes more demanding: find an exception or limitation.
Only after establishing the source reading does the class discuss possible mechanisms. Students may suggest alternatives and compare which are supported by the data and which depend on wider knowledge.
Finally, the learner repeats the sequence on a different source—perhaps a photograph, table or map rather than another line graph. The transfer task shows whether the reasoning habit has become portable.
The tutor records one error type and one independent improvement. The purpose of the lesson is not to use as many worksheets as possible. It is to produce a repeatable skill.
A Four-Week Data Interpretation Cycle
Week one — Source decoding. Practise identifying variables, units, legends, time periods and sampling frames. Build accuracy with straightforward materials before increasing difficulty. A student who regularly misreads the axis should not be judged primarily on their explanatory paragraphs yet.
Week two — Comparison and pattern. Practise trends, extremes, exceptions and evidence-supported descriptions. Ask students to replace vague statements with comparisons. Show how a single number differs from a numerical argument.
Week three — Explanation and limits. Use content knowledge to propose mechanisms, then evaluate what the source actually proves. Introduce alternative explanations, different data definitions and the need for corroboration.
Week four — Mixed-source transfer. Present unfamiliar combinations of map, chart, photograph and short text. Give an appropriate time limit after accuracy improves. Let the student decide which evidence is most useful instead of having the tutor label it.
Four weeks are an example cycle, not a promise of a particular grade. The pace should be adjusted for the student’s actual error pattern and workload.
How Parents Can Check Progress at Home
Ask your child to show you a chart and explain it in thirty seconds without reading a memorised paragraph. They should say what is measured, point to an important comparison and indicate one thing the chart alone cannot establish. That is already a useful progress check.
On another day, ask them to choose a statement in a completed answer and draw an arrow to the exact evidence that supports it. If the arrow ends nowhere, the sentence may need revision. This tiny exercise can uncover an unsupported inference immediately.
A third check is transfer. Give a different type of source with familiar question commands. Does the student still read the units? Can they avoid guessing? Does their answer become more careful even when the topic is unfamiliar?
Avoid making every home conversation into a surprise examination. The aim is to help the student notice their own reasoning. A child who starts asking ‘What are we measuring?’ is developing a remarkably strong habit.
Common Misconceptions That Block Geography Data Skills
- ‘A high percentage means many people.’ It means a high share of a defined group; the group size matters.
- ‘An average describes everybody.’ It summarises a set of values; variation may be hidden.
- ‘Two rising lines prove one variable causes the other.’ A relationship is not the same as a demonstrated mechanism.
- ‘Every photo shows the complete situation.’ A photograph includes only a frame at a moment.
- ‘More statistics always make an answer stronger.’ Only relevant statistics strengthen the argument.
- ‘A graph with no zero baseline must be false.’ A truncated axis can be appropriate, but the reader must assess how the display affects interpretation.
- ‘If the case study is famous, it must be relevant.’ Relevance depends on the precise question.
- ‘A long answer is a complete answer.’ The answer must meet the command, address the source and provide justified explanation.
The correction for every misconception is a short reasoning action. Name the denominator. Check the time frame. Locate the claim’s evidence. Identify a possible alternative. Learning sticks when an error is replaced by a method.
Practice Tasks for Secondary Geography Data Interpretation
Task A: The two-sentence chart. Choose an unfamiliar graph. In sentence one, describe its main pattern with appropriate units. In sentence two, identify an exception or a limit. No invented causes are allowed yet.
Task B: The misleading summary. Write a deliberately exaggerated description of a chart, using words such as ‘always’ and ‘everyone’. Then correct it by citing the data. This makes the danger of overstatement memorable.
Task C: The cause test. Given two variables that rise together, propose two possible mechanisms and one third factor. Explain what additional evidence could make one explanation more convincing.
Task D: The photo boundary. Look at a photograph of a public place. List five visible observations and five claims that cannot be established from the frame. Compare the lists with another student’s response.
Task E: The case-study card. Create one small card for an examined topic: location, issue, process, evidence, trade-off. Explain the card without reading it word for word.
Task F: The transfer challenge. Return one week later with a new source. Ask the same reasoning questions without the old tutor prompts. Progress is the reduction in unsupported conclusions, not merely a faster completion time.
Frequently Asked Questions on Punggol Geography Tuition
Why does my child lose marks despite memorising Geography notes?
Data-response questions assess whether a learner can interpret a new source and use geographical knowledge appropriately. Memorised material may provide background explanation, but it cannot substitute for reading the graph, chart, photograph or table actually given.
Is Geography data interpretation just Mathematics?
Basic numeracy helps: comparisons, percentages, units, averages and trends. But Geography also requires interpreting place, scale, environment, human decisions, representations and limitations. Numbers become geographical evidence when used to answer a geographical question.
Should a student quote every figure on a graph?
No. Select the figures that demonstrate the claimed pattern or comparison. Overloading an answer with unrelated values can obscure the argument and waste time. Accuracy and relevance are more important than quantity.
Can a student use real Punggol examples in Geography answers?
Local observations can improve understanding and discussion, but examination responses should follow the specific question and accepted evidence. A personal example is not automatically an adequate case study; the student must show relevance, correct context and, where needed, verifiable facts.
What is the first sign that tuition is working?
The learner begins reading the source systematically before writing. They identify the measure, choose a useful comparison and stop claiming that the source proves something it cannot. Those habits are observable in unseen practice.
Does the same approach work for G2 and G3 Geography?
The broad evidence habit transfers, but expectations, content depth and assessment arrangements depend on the student’s pathway, level and syllabus. Tutors should adapt complexity and examples rather than assuming all Geography courses are identical.
Is it better to practise lots of past questions or fewer questions carefully?
Both speed and breadth matter eventually. However, when a recurring error is still unidentified, fewer questions with careful diagnosis and a fresh retest often build a stronger foundation. Volume becomes valuable once the method is reliable.
What if my child is strong at writing but weak at graphs?
Treat the graph-reading skill as its own target. Begin with variables, axes and comparisons, then reconnect those observations to the student’s writing strength. A polished paragraph cannot rescue a source that was decoded incorrectly.
Can AI summarise Geography graphs for the student?
A digital explanation can model one approach, but students need to verify its claims against the source and demonstrate their own reasoning. The learning goal is not a convenient summary; it is being able to produce and challenge a summary independently.
What follows data interpretation?
Students can progress to geographical investigation, evaluating data collection methods, constructing explanations and weighing alternative responses to geographical issues. The capacity to use evidence reliably supports each of those later goals.
Choosing Geography Support With a Clear Purpose
Before enrolling in Geography tuition, bring one piece of work that went wrong and one that went well. Ask the tutor to explain the contrast. If the student consistently loses marks through inaccurate comparisons, the plan should emphasise data decoding and evidence selection. If their comparisons are correct but the explanation is shallow, the plan should focus on mechanisms and judgement.
Families can connect this guide to Map Reading Skills in Punggol Geography Tuition, the Punggol Education and Town-Life Index and the specialist How Geography Works library. These routes separate the learner’s practical target from deeper geographical concepts and general family decisions.
For official syllabus selection, refer to the SEAB O-Level school-candidate syllabuses for the appropriate examination cohort and subject. No generic tuition guide should override a school’s current assigned syllabus.
There is a satisfying moment when a student reads a fresh graph and does not panic. They check the axes, pause over an unusual point and say, ‘This is what the data show. This is what I think may explain it. And this is what I would still need to find out.’
That is the core aim: not louder certainty, but better-grounded understanding.
Next in the Punggol Geography Tuition series: Geographical Investigation and Fieldwork Skills. Follow the next learning target and its parent guide, worked examples, progress checks and practical questions.


