
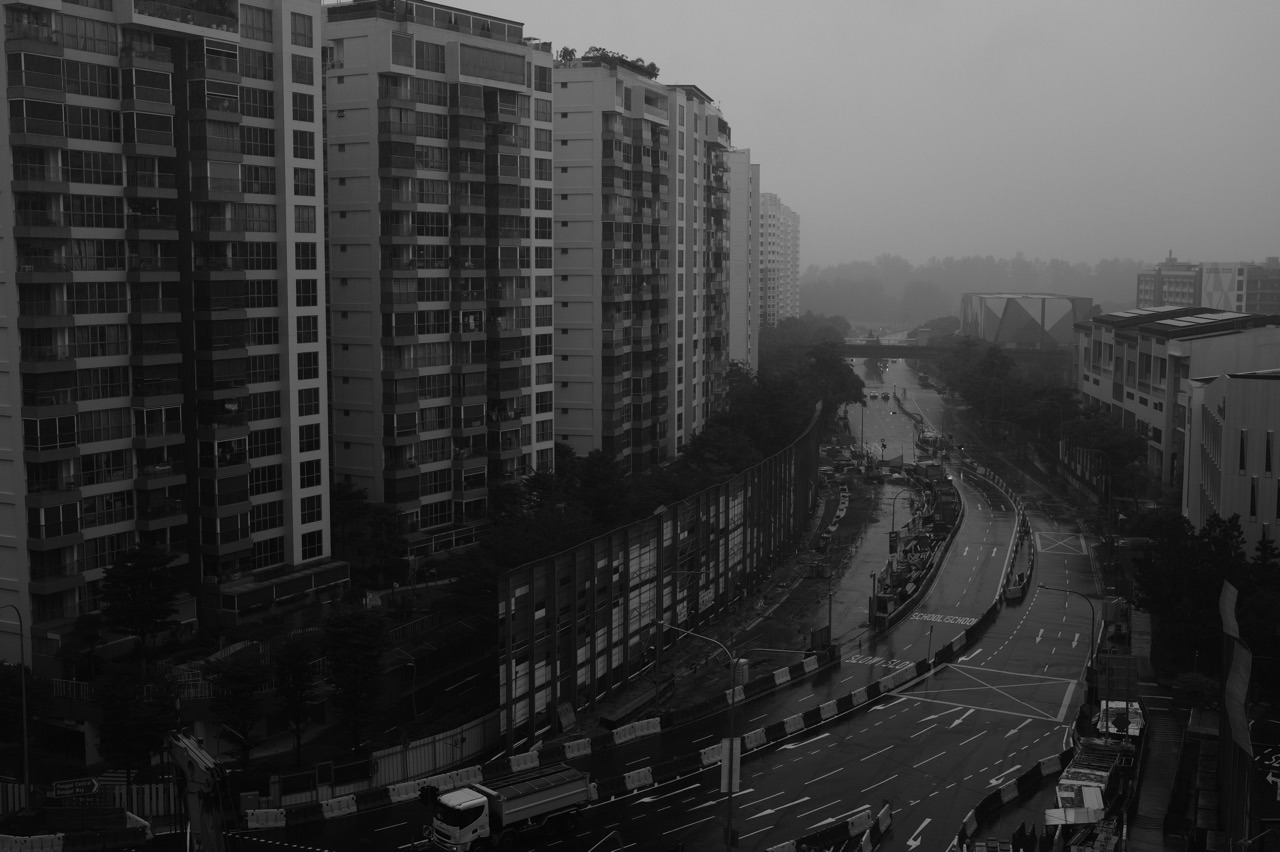
A dark cloud gathers over Punggol, and a student announces, “The Northeast Monsoon must be here.” It is an understandable guess. Singapore is famous for tropical rain, and families searching for Secondary Geography tuition in Punggol, O-Level Geography weather and climate revision or monsoon Geography notes often meet these ideas together. Yet one shower does not identify a season, and one memorable afternoon cannot describe a whole climate. Geography begins when the learner asks what atmospheric evidence would actually distinguish the possibilities.
The core aim of Punggol Geography tuition for weather and climate, monsoons and rainfall is to help students explain the mechanisms behind atmospheric patterns, interpret weather and climate evidence accurately, and apply those ideas to unfamiliar locations. By the second paragraph of a learner’s answer, there should be more than a definition: the student should know whether the question concerns conditions at one place and time, a long-term pattern, a physical process or a human consequence. This is a foundation for Geography from lower secondary through G3 elective or full Geography, with the appropriate syllabus guiding depth.
Punggol is a useful everyday doorway into the subject. On one walk, sunshine can give way to cloud and an evening downpour. On another, wind may feel stronger along an open waterfront than between buildings. These observations generate questions, but they are not substitutes for measured data. Good teaching connects lived experience with atmospheric science without confusing anecdote and proof.
The Core Aim: Explain the Sky Instead of Merely Naming It
A weak climate answer is often a collection of labels: humidity, rain, temperature, wind, monsoon. A stronger answer connects ideas into a mechanism. Solar energy warms a surface; warm, moisture-bearing air may rise under suitable conditions; rising air cools; water vapour can condense; clouds may form and precipitation may occur. Each step depends on circumstances, and a geographical explanation should show the important links.
When a child can repeat the phrase “convectional rainfall” but cannot explain why air rises, the problem is not a shortage of notes. The missing link is a process. When a child knows that Singapore has two monsoon seasons but assumes every rainy afternoon belongs to the wet phase of the Northeast Monsoon, the missing link is temporal scale.
A well-designed Geography tutorial asks: Which variable changed? What forces or processes could produce the change? Over what area and time period is the explanation intended to apply? What evidence would confirm or challenge it?
The destination is independent reasoning. The student should be able to see a new climate graph from another country, inspect the temperature and rainfall pattern, and begin a defensible explanation without relying on a memorised Punggol example.
Weather and Climate Are Related, Not Interchangeable
Weather is the state of atmospheric conditions at a particular time and place. Temperature, wind, cloud cover, precipitation and humidity can change over hours or days. Climate describes patterns and statistics of weather over a longer reference period.
This distinction sounds simple until an assessment question asks whether one extraordinary storm proves a place has a wet climate. The storm is evidence of an event; the climate claim needs a broader record. Likewise, a period of unusually cool days does not by itself refute a long-term warming trend.
Teach students to name the time window before drawing conclusions. Is the source an hourly observation, a daily reading, a monthly total or a multi-decade reference average? Many mistakes disappear when the learner pauses to identify that single detail.
Use everyday language: weather is what happened during the walk; climate is what long records tell us to expect and how that expectation varies across places and seasons. Neither is a promise about every future day.
How Solar Energy Begins the Explanation
Solar radiation provides the energy behind much of Earth’s atmospheric behaviour. But sunlight does not heat every place equally. Latitude, time of day, season, cloud cover, surface characteristics and elevation can alter the energy balance.
A student may memorise that places nearer the equator are generally warmer without understanding why the angle at which sunlight reaches the surface matters. More direct radiation concentrates incoming energy over a smaller area, while lower-angle sunlight spreads that energy across a larger area and travels through more atmosphere.
Earth’s rotation helps explain the cycle of daylight and darkness. Earth’s axial tilt, together with its revolution around the Sun, helps explain seasons and changing day length away from the equator. Avoid saying that summer occurs simply because Earth is closer to the Sun; that is not the main explanation for the seasons.
These ideas become geographical when a student links the physical cause to spatial and temporal differences. Instead of repeating “latitude affects temperature,” they can explain why and apply the mechanism to an unseen comparison.
Air Temperature: What Are Students Actually Measuring?
Air temperature is not the same as the temperature of a sunlit pavement or a metal railing. A surface exposed to direct radiation can become substantially warmer than the nearby air. Geography lessons must make clear which variable a thermometer or dataset represents.
A properly sited air-temperature measurement reduces distortions caused by direct sun, nearby heat sources and unsuitable instrument placement. For a classroom demonstration, compare readings only when the method is safe, authorised and consistent.
Students often describe a hot day as “high heat.” In a scientific explanation, encourage more precise language: air temperature, surface temperature, thermal comfort and heat exposure are related but not identical.
A local Punggol example can illustrate the question. A shaded path and a sun-exposed path may feel different. But the sensation alone cannot establish the measured air-temperature difference; wind, radiant heat, humidity and the individual’s activity can also influence how hot a place feels.
Why Coastal Settings Can Behave Differently
Land and water tend to gain and lose heat at different rates. This difference can create local pressure contrasts and air movement under suitable atmospheric conditions.
A daytime sea breeze occurs when land warms more rapidly, encouraging rising air over the warmer surface and a circulation that can bring relatively cooler air inland from the sea. At night, the circulation may reverse in some situations as land cools more quickly. Real coastal weather also depends on larger weather systems, topography and prevailing winds.
A common student error is to describe the direction of wind without specifying whether it is named by the direction it comes from. A sea breeze blows from the sea towards land. A land breeze blows from land towards the sea.
Do not promise that Punggol’s waterfront always feels cooler. An open waterfront may have different wind exposure, shade and humidity from an inland path, and conditions change throughout the day. The useful lesson is the mechanism and the need to compare evidence.
Pressure, Wind and the Invisible Gradient
Wind is the horizontal movement of air, and pressure differences are an important driving force. Air tends to move from higher towards lower pressure, while Earth’s rotation, surface friction and other influences affect direction and speed.
An explanation should distinguish the cause of movement from what redirects or slows it. A simple diagram with two locations of different pressure can start the discussion. Then introduce why real winds do not always travel in an uncomplicated straight line between them.
A pressure gradient can be steep or gentle. In a simplified setting, a greater pressure difference across a given distance can contribute to stronger wind. But local friction, terrain and weather systems may alter what is observed.
Good tuition moves from the cartoon diagram to a map or wind rose. The student learns to interpret an arrow correctly, identify speed units and explain why a single observation may not represent a whole season.
Humidity Is More Than the Feeling of Sticky Weather
Humidity describes moisture in the air, but different humidity measures answer different questions. Relative humidity compares the current water-vapour content with the amount the air could hold at that temperature, expressed as a percentage.
A warm parcel of air can contain more water vapour than a cooler one before reaching saturation. This helps explain why changing temperature can change relative humidity even without an equivalent change in actual moisture content.
Students sometimes claim that “100% humidity means the air is full of liquid water.” It is better to say the air is saturated with water vapour at its temperature. Condensation can occur when appropriate conditions are reached, often involving cooling and condensation nuclei.
Relative humidity also helps explain everyday discomfort, but thermal comfort involves temperature, radiation, wind and activity. For exam writing, students should use the variables asked for instead of treating one value as a complete explanation of human experience.
From Rising Air to Clouds and Rainfall
Convection is a process in which warmer, less dense air may rise relative to its surroundings. As it ascends into lower atmospheric pressure, it generally expands and cools. If sufficiently moist air cools to saturation, condensation may produce cloud droplets. With suitable cloud microphysics and growth processes, precipitation can form.
The important link is not merely “hot air makes rain.” Heating does not guarantee a thunderstorm. Atmospheric instability, moisture availability, lifting mechanisms and other conditions matter.
Singapore’s familiar afternoon and evening showers can involve strong solar heating and sea-breeze circulations, among other mechanisms. They offer a useful local example, but a student’s explanation must stay faithful to the particular weather system in the question.
Try a three-line exercise: condition → physical process → visible outcome. The child should articulate the middle step. If they cannot, more memorised examples will not necessarily help.
Understanding the Northeast and Southwest Monsoons
The Meteorological Service Singapore describes the Northeast Monsoon as occurring broadly from December to early March and the Southwest Monsoon from June to September, with inter-monsoon periods separating them. Conditions vary within each season; they are not two fixed daily weather forecasts.
During the Northeast Monsoon, monsoon surges can bring prolonged widespread rainfall, especially in the wetter early phase. A relatively drier later phase often follows. The Southwest Monsoon may include occasional Sumatra squalls as well as shorter showers. Inter-monsoon periods often feature lighter variable winds and afternoon or early evening thunderstorms.
Students should not memorise “Northeast = always wet, Southwest = always dry.” Singapore receives rainfall across the year, and local thunderstorms occur under more than one seasonal regime.
For reliable detail, read the Meteorological Service Singapore’s Climate of Singapore guide. A strong student uses this as evidence of typical patterns, then distinguishes the climate summary from today’s specific weather forecast.
Why the Monsoon Wind Changes Direction
Monsoons are large-scale seasonal wind systems shaped by differential heating, pressure patterns and regional atmospheric circulation. Students should connect changing solar heating across seasons with evolving pressure distributions and winds, while recognising that the regional system is more complex than a simple two-box model.
The Coriolis effect matters when discussing large-scale motion on a rotating Earth. It affects the apparent deflection of moving air relative to the surface. The degree of deflection depends on latitude and other factors, so students should avoid treating every local breeze as a miniature monsoon.
A careful explanation of monsoon wind direction names the region and season. Singapore’s actual prevailing directions are affected by geographical position and the regional atmosphere, and cannot be worked out from the name of the season alone.
In a tutorial, ask the learner to draw a simplified wind map, identify the origin of air movement and state one limitation of the simplification. That last step protects them from using a classroom cartoon as a universal law.
How to Read a Climate Graph Correctly
A climate graph frequently combines monthly temperature and precipitation. Before answering, inspect the title, axes, units, months and the distinction between bars and lines. A student who confuses rainfall in millimetres with temperature in degrees Celsius may write a confident but invalid comparison.
First describe the temperature range, seasonal timing and any clear differences across months. Then describe rainfall totals, peaks and quieter periods. If the question asks for an explanation, connect the pattern with relevant climate processes rather than merely restating bar heights.
Be precise about averages. A long-term mean monthly rainfall total does not guarantee that exactly that much rain fell in the same month of every year. A climate normal is a reference summary, and individual years vary.
For an illustrative exercise, compare a humid tropical station with one from a cool temperate climate. The student should infer relevant differences from the data before naming the climates. This prevents classification from becoming a guessing game based on familiar places.
A Worked Example: A Hypothetical Punggol Observation Record
Consider a fictional learning table—not actual recorded weather data. The observations at a selected point are as follows: 9 a.m., air temperature 28°C and no rain; noon, 31°C and no rain; 3 p.m., 29°C with a shower; 6 p.m., 28°C and cloudy.
A student can accurately state that the highest recorded temperature in this small set is at noon. The temperature then decreases between noon and 3 p.m., while a shower is recorded at the latter time.
A weaker answer might declare that rainfall caused all the temperature decline. That is not established by the four entries alone. Cloud cover, changing radiation, wind and the timing of the measurements may also matter.
The teacher can then ask: What extra information would help? Hourly rain intensity, cloud observations, wind conditions and readings over more days could build a better explanation. The learning goal is disciplined reasoning, not forcing one expected narrative onto a tiny table.
What a Single Heavy Downpour Cannot Tell Us
A very heavy shower can affect transport, walking routes and outdoor activities. It may remind Punggol students that weather has real consequences. But the existence of one shower does not demonstrate a trend in extreme rainfall, a shift in monsoon timing or the effects of global climate change.
Those claims need a broader record, appropriate definitions and analysis. Students must distinguish event, variability and long-term trend.
This boundary is essential for later climate-change topics. If a child can say “one day is weather; the wider distribution over time is climate,” they have a conceptual tool for avoiding misleading conclusions in news reports and exam responses alike.
A parent can use the latest weather forecast as a reading exercise, but never use unsafe storms as an invitation to collect outdoor observations.
Thunderstorms, Lightning and Responsible Learning
Cumulonimbus clouds can be associated with thunderstorms, intense rain, gusts and lightning. In Singapore, thunderstorm activity can develop rapidly. An educational desire to observe weather never overrides lightning safety.
Students should learn from approved sources, indoor observation and appropriate historical records. If there is thunder or lightning, avoid exposed paths, open fields and bodies of water and follow official safety advice. Neither Geography marks nor a photograph is worth a dangerous field trip.
This principle also creates a useful question: How do natural processes become hazards? A storm becomes consequential through exposure, infrastructure, behaviour, vulnerability and preparedness. Physical geography and human geography meet in the ways societies manage risk.
A well-rounded lesson therefore moves from atmospheric mechanism to consequences without sensationalising the weather.
Climate Change Belongs to a Longer Time Scale
The relationship between weather and climate leads naturally to climate change. Climate change concerns shifts in climate statistics across extended periods, not merely seasonal differences or a short spell of abnormal weather.
A student must understand the distinction between the natural greenhouse effect, which contributes to Earth’s habitable temperature, and the enhanced greenhouse effect resulting from additional greenhouse gases associated with human activity. It is equally important not to confuse ozone depletion with the main explanation for contemporary global warming.
However, teaching everything about climate change during a single weather lesson can overwhelm the first aim. Build weather variables and their mechanisms first. Then examine how the long-term climate system changes and how societies respond.
The companion guide Climate Change and Climate Action in Punggol Geography Tuition develops that next learning step.
How Small-Group Geography Discussion Can Help
A well-run small group can compare competing explanations. One student may notice the humidity reading; another may point to a changed wind direction; a third may recognise that the available source is insufficient to prove either mechanism. Guided discussion makes the boundary between observation and inference visible.
But group size is not a substitute for individual assessment. Each learner must interpret the climate graph alone at some point. A student who nods along to another person’s answer may not yet be able to reproduce the method.
The tutor’s task is to identify the first weak link in each student’s understanding. Is the trouble with the diagram, the physical process, the units, the seasonal pattern or the written explanation? The response should be targeted accordingly.
Do not assume that all Geography support in Punggol follows one fixed timetable or group size. Families should evaluate the actual arrangement and teaching method available to them.
An Example Four-Week Weather and Climate Plan
Week one — Definitions and measurement. Distinguish weather and climate; read units and instruments; practise identifying variable and time scale. Use unfamiliar source snippets to assess whether the distinction transfers.
Week two — Atmospheric mechanisms. Explain heating, pressure gradients, winds, rising air and rainfall. Require causal chains, not single-word labels. Short diagrams can reveal missing links.
Week three — Monsoons and graphs. Read Singapore’s monsoon pattern with trustworthy data. Compare climate graphs from different locations. Train precision about averages, seasons and exceptions.
Week four — Unseen applications. Use a fresh weather scenario, data response and short explanation question. Ask students to name uncertainty and connect the physical process to one potential human consequence.
This is an illustrative programme, not a four-week grade promise. A student with weak graph-reading skills may need to revisit those foundations before moving to increasingly complex explanations.
Practice Tasks for Punggol Geography Students
- Weather or climate? Classify six statements by time scale. Explain why a single rainy afternoon cannot identify a long-term rainfall trend.
- Explain convection. Write a five-step chain from surface heating to possible precipitation. State two conditions that can alter the outcome.
- Check the wind. Draw the direction of a sea breeze and explain why the breeze is named from its source direction.
- Inspect a climate graph. Identify months, variables, units, one prominent pattern and one exception before explaining anything.
- Repair a claim. Replace “Singapore never has dry weather” with a statement that reflects year-round rainfall and month-to-month variation more accurately.
- Transfer to a new place. Interpret the same variables in an unfamiliar country, avoiding the assumption that tropical Singapore’s pattern applies everywhere.
Every task should be checked for reasoning, not simply whether the student used the right vocabulary.
Frequently Asked Questions About Weather and Climate Geography Tuition
Is weather and climate an O-Level Geography topic?
Weather and Climate appears in the Climate cluster of the upper-secondary Geography framework. However, whether and how it is assessed depends on the specific route. Check the student’s official syllabus and school guidance rather than treating every online O-Level worksheet as interchangeable.
Does G3 Elective Geography cover the same Climate material as full Geography?
The shared cluster concepts overlap, but the assessment structures are different. For the 2027 SEC G3 Humanities (Social Studies, Geography) syllabus, the Geography paper includes a choice between a Climate and a Tectonics question in Section B; the G3 full Geography syllabus examines its separate clusters across two papers. Students need course-specific practice.
Why does my child keep mixing up weather and climate?
The terms are connected and everyday speech often blends them. Teach the time-scale distinction with examples first, then apply it to unfamiliar graphs and statements. Repeating dictionary definitions alone may not create the habit.
Is Singapore’s Northeast Monsoon always rainy?
No. The seasonal pattern includes wetter and relatively drier phases, and individual days vary. Refer to official climate information for the typical timing and mechanisms rather than assuming the season determines every day’s weather.
Must students memorise monthly Singapore rainfall totals?
Students should follow their own syllabus and teacher’s requirements. In general, understanding patterns and interpreting a supplied climate graph is more transferable than memorising a long table of isolated figures.
Can weather apps help with Geography revision?
Yes, when used to practise identifying variables, time scales, forecasts and observations. An app reading is not necessarily a controlled scientific measurement, and the student should know the difference.
What if my child can draw the water cycle but cannot explain rain?
The diagram may not make the mechanism explicit. Ask about heating, evaporation, rising air, cooling, condensation and the conditions under which precipitation forms. Then check the explanation on an unfamiliar question.
Is Punggol an especially useful place for learning weather?
Punggol offers familiar waterfront, park and built-up settings that can prompt questions about shade, wind and rain. Those local observations are teaching prompts, not proof of a special microclimate without measured comparative evidence.
How should a student revise monsoons?
Build the process first, learn the broad seasonal pattern, verify it against a climate source and practise interpreting new weather maps or climate graphs. Avoid memorising a simple “wet versus dry” slogan that conceals meaningful exceptions.
How do parents tell whether Geography tuition is helping?
Ask the learner to interpret an unfamiliar climate graph and explain one atmospheric mechanism without a script. Look for accurate units, a defensible causal chain, appropriate time scale and fewer unsupported claims.
Where This Fits in the Geography Learning Journey
The first foundation is Secondary Geography Map Reading Skills: locate, orient and recognise spatial patterns. The next is Geographical Data Interpretation and Evidence: read graphs and make justified comparisons. Weather and climate apply those foundations to atmospheric systems and their effects on people.
For the official context, families can check the 2026 O-Level syllabus listings or the 2027 G3 SEC syllabus listings, according to examination year. The wider How Geography Works library provides further conceptual exploration.
The next time a cloud arrives over Punggol, a child may still guess whether rain is coming. That is entirely human. The improvement is the question that follows: “What could cause this—and what observations would help me know?” The aim of Geography tuition is to make that question an instinct.


