
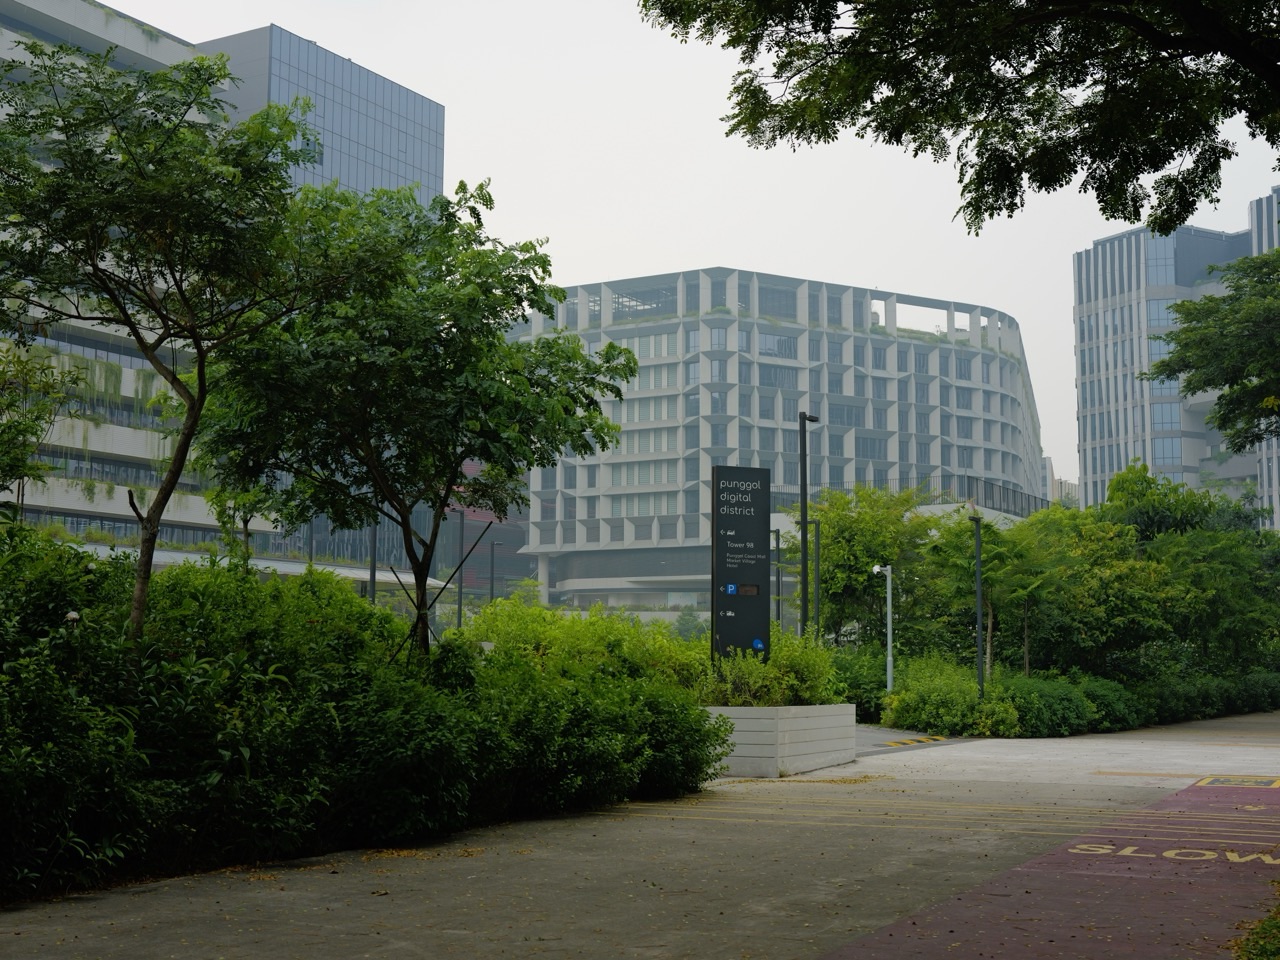
Why did Punggol Coast Hawker Centre introduce AI-powered video analytics to study customer queues, foot traffic and possible safety hazards, instead of relying only on staff to notice problems after they happen? A food centre with hundreds of seats and forty stalls is a constantly changing environment. Some queues grow quickly, a table area can become busy, and a spill may need attention while workers are occupied elsewhere. The operator’s pilot uses information from approved camera analytics to help staff recognise patterns and respond to operational problems more efficiently.
The centre at 84 Punggol Way, Level 2, opened on 25 July 2025 with 40 stalls, 121 fixed tables and 576 fixed seats according to JTC’s detailed launch annex. Kopitiam, under FairPrice Group and appointed as an operator by NEA, said its self-funded AI video-analytics programme could map foot traffic, support queue management and improve cleanliness and safety monitoring. This is a support system for staff and stallholders, not a claim that a machine cooks every meal, guarantees no waiting or automatically identifies every diner. It also requires responsible consideration of how camera information is used and managed.
- Place: Punggol Coast Hawker Centre, 84 Punggol Way, Level 2, inside Punggol Digital District.
- Actual opening: 25 July 2025, separate from the earlier expected opening dates in planning releases.
- Capacity at launch: 40 stalls, including 34 cooked-food and 6 drinks/juice/dessert stalls; 121 fixed tables and 576 fixed seats.
- Technology: FairPrice Group/Kopitiam’s AI-powered video analytics pilot.
- Operational tasks: observe footfall, study queues, support deployment of staff for crowd flow and cleaning, and flag some safety concerns.
- Human role: stallholders cook and serve; authorised employees interpret information and take appropriate action.
- Important limits: no public source establishes perfect detection, guaranteed table availability, facial identification or access to identifiable visitor profiles.
- Visitor guidance: follow queues, stall payment instructions and food-hygiene rules; do not expect a live wait-time guarantee from this article.
- Main sources: JTC’s 25 July 2025 operator release and detailed hawker-centre annex.
The answer in 50 seconds
The centre’s operator wanted to make a large, busy food space easier to manage. Video analytics can transform selected camera observations into information about queues, occupancy and operational concerns.
That can help managers decide when to send staff towards a spill or crowded area, while stallholders may learn when demand is higher.
The aim is better decisions, not a completely automated hawker centre. Actual performance depends on equipment, data quality, management, staff response and how responsibly the systems are operated.
Why a hawker centre is a dynamic system
A food centre contains customers arriving, ordering, collecting meals, finding seats and leaving. Workers prepare food, clean tables and move supplies.
These activities overlap rather than happen in one neat line. A queue at one stall may disappear while a crowd gathers somewhere else.
The operator’s challenge is to maintain a practical, safe environment without assuming every part stays equally busy throughout the day.
Why Punggol Coast is a particular example
JTC published a press release from Kopitiam for the 25 July 2025 opening, explicitly naming the AI-powered video analytics as an operational pilot.
That distinguishes this article from a general discussion of what AI might do in food service. It concerns a named, operating Punggol facility with a documented technology programme.
The press release describes intended and emerging capabilities; it should not be used as evidence that every possible benefit has already been independently measured.
Why the 2025 opening date matters
Earlier NEA announcements described planned opening periods for the new centre. Large developments can have schedules that change during preparation.
The detailed launch information confirms actual operations began on 25 July 2025.
Readers researching a present-day dining option should use the realised opening, not copy a 2024 forecast that says the centre is still expected to open. Date labels are part of accurate local information.
Why the 40-stall arrangement creates varied demand
The launch annex identifies 34 cooked-food stalls and six selling drinks, juices or desserts.
Different stall categories can have different order preparation times and customer behaviour. A queue for a made-to-order dish may move differently from a drinks counter.
An analytics system can be useful because total crowd size alone does not describe where the delays occur. The exact queue for one stall still depends on its current operations.
Why the actual 576-seat figure matters
The final centre launch described 576 fixed seats across 121 fixed tables. Earlier government planning descriptions had spoken of more than 680 seats.
Those figures should not be silently blended. The launch annex is the more specific source for the number of fixed seats at the opening.
A past projection may be correct about an earlier proposal without being the best description of the completed arrangement. A trustworthy article names the source and date.
Why 121 tables do not mean 121 identical dining groups
Tables can have different capacities or seating arrangements. A count of tables is not the same as a count of seats, meals sold or people currently occupying the centre.
A diner may sit alone at one table while another table seats a family.
The operator needs to understand real usage patterns rather than infer current occupancy solely from furniture count. Even a fully available seat count does not guarantee a table suitable for every group at the desired moment.
What video analytics actually means
Video analytics uses software to derive information from video feeds for defined purposes. In a food centre, that may include estimates of crowd movement or conditions associated with a queue.
It does not necessarily mean the system recognises the names or identities of all the people seen in an image.
The published Kopitiam programme concerns operational insights such as footfall, queues and safety. Any more intrusive identity claim needs separate evidence and should not be invented.
Why a queue is more complicated than a line
Customers may stand in front of a stall, wait for a number, return after sitting down or form several short lines.
A camera view may reveal some of these movements while missing others, depending on placement and technical design.
This is why operational insights should be interpreted carefully. A computer’s estimate of queue length is not automatically the total number of pending orders in the kitchen.
Why footfall information can help
Footfall describes movement or visits through an area under the chosen counting definition.
An operator may use patterns to understand when an entrance or passage becomes especially busy and allocate appropriate cleaning or crowd-management attention.
But visits are not unique customers unless the counting method supports that distinction. One person passing the same camera twice can create a different count from one person making one purchase.
Why a busy corridor and a busy stall are different
People moving through a corridor may be heading to the MRT, a shop or an exit without buying food.
A stall queue indicates a more specific form of demand, while actual orders require another kind of information.
A good operational decision keeps these metrics separate. A large number of people walking past a stall cannot by itself prove its sales have increased.
Why a queue can grow even when staff work hard
A queue forms when demand arrives faster than it can be served over a period.
A stall may prepare meals carefully but still experience a rush of orders. The limiting step may be cooking time, payment, packing or a specialised menu item.
Understanding queue patterns can guide decisions, but it does not justify blaming a worker for every delay or assuming technology can remove the physical time required to prepare food safely.
Why waiting time and queue length differ
A line of ten people may move quickly at a counter processing simple orders or slowly where each dish requires longer preparation.
Queue length alone therefore does not establish a precise waiting time. Arrival rates and service rates matter.
An analytics display estimating the number of people should not be represented as an exact promise that every customer will collect their meal within a fixed number of minutes.
Why a rush hour can affect several stalls together
Students leaving classes and workers on lunch breaks may arrive at similar times.
A food centre in Punggol Digital District serves several nearby populations, creating potential periods of concentrated demand.
The actual peak periods need measurement. It would be misleading to announce a specific minute as the busiest time for every stall without current operator data.
Why a real-time alert is different from a forecast
An alert may report a condition detected recently, such as an area becoming crowded.
A forecast estimates what could happen later based on information and assumptions. Those are different tasks.
The published pilot describes real-time insights; it does not provide a public guarantee of accurate predictions for all future queues. Both types of output would need evaluation under actual operating conditions.
Why cleanliness is part of the analytics story
In a busy food centre, a table may need clearing while another area remains clean.
The operator’s press release says video analytics can support deployment of staff to manage cleanliness and crowd flow.
The technology helps identify where attention may be useful; authorised cleaners still perform the work. The goal is more responsive operations, not eliminating people from shared-space maintenance.
Why a spill may need rapid attention
Spilt liquids can create slip hazards, especially where customers carry trays or walk between tables.
The operator’s safety-monitoring objective includes identifying situations that may require intervention.
But a video alert cannot guarantee a floor becomes safe without staff assessment and proper cleaning. Visitors should report obvious hazards and avoid them rather than rely on an unseen automated system to respond immediately.
Why smoke or other hazards require careful handling
Some accounts of the Punggol Coast pilot mention detecting possible safety concerns such as smoke or spills.
Detection can provide an additional operational cue, but emergency procedures, human verification and appropriate response remain necessary.
A food centre’s video analytics should not be described as a substitute for approved fire detection, fire suppression or emergency services.
Why false positives matter
A system may flag a situation that turns out not to be a hazard, such as a visual pattern resembling a spill.
If staff are sent repeatedly to investigate non-events, the technology can create extra work rather than remove it.
A responsible pilot should study whether the alerts are accurate and useful in context. A computer-generated flag is not automatically the final determination of what happened.
Why missed hazards also matter
A camera may have limited coverage, an obstructed view or other constraints.
A system that misses an event cannot be treated as a universal guarantee of cleanliness or safety.
Human observation, routine cleaning and standard safety processes remain important even when analytics are installed. Technology should strengthen an operation rather than create false confidence.
Why stallholders may benefit from demand patterns
A stallholder must decide how many people to roster, when to prepare certain ingredients and how to manage orders.
The operator said aggregate customer patterns could help stallholders plan manpower and service more efficiently.
Those are intended uses of information, not a guarantee that data will solve labour shortages, eliminate food waste or increase sales at every business.
Why staffing decisions need more than a chart
A graph may show heavy demand at one hour, but staff availability, skills, rest and food-safety requirements still matter.
A stall may need a trained cook for a complex dish even if another worker is available nearby.
Analytics can inform decisions, while responsible employers and qualified staff must account for the real work and applicable employment rules.
Why a stall’s best staffing plan can change
Menu changes, holidays, university schedules and customer preferences may affect demand.
A staffing pattern that worked during one week may need adjustment during another.
The purpose of collecting useful operational information is to learn and adapt. It should not turn one observed peak into a rigid rule that ignores later evidence.
Why a video system cannot cook food faster by itself
A camera and algorithm do not alter the time needed to safely cook an item unless the resulting information leads to appropriate operational changes.
Some food preparation requires fixed steps, temperature control and hygiene procedures that cannot be skipped.
The success of a technology programme should therefore be evaluated through real service outcomes rather than assuming the presence of AI makes food preparation instantly faster.
Why the facility is still a hawker centre
A hawker centre provides stalls offering prepared meals and drinks with shared seating under its management arrangements.
Punggol Coast’s forty stalls combine established flavours with newer concepts, consistent with the operator’s launch description.
The AI pilot is an operational feature layered onto that familiar service. The basic social role—accessible everyday food and shared dining—remains central.
Why the operator matters
Kopitiam manages Punggol Coast Hawker Centre under the applicable NEA-appointed operator arrangement.
FairPrice Group said it funded the AI pilot and would use the centre as a benchmark for digital innovation.
This distinction clarifies who announced the technology and its intended operational role. It is not evidence that every NEA-operated hawker centre in Singapore uses the identical system.
Why public ownership and operations should not be conflated
A government-linked facility can be managed through an appointed operator with its own personnel and operational decisions.
NEA’s role in hawker-centre policy and an appointed operator’s management role are related but not identical.
A public enquiry about a specific spill, stall issue or operational notice should go to the appropriate responsible channel. The presence of AI does not merge all responsibilities into one government office.
Why camera placement creates trade-offs
A camera needs a useful view of the area it is intended to monitor, but it may also record people who are simply passing by.
Operational benefits should be balanced with legitimate privacy and security requirements.
The publicly available press release does not establish the system’s exact camera specifications or data retention arrangements. A responsible article should not invent those details.
Why data protection still matters
Visual analytics may involve information about people, whether or not the output ultimately uses aggregate counts.
A competent operator must consider the relevant privacy laws, policies and access controls for its actual system.
It would be misleading to promise that absolutely no personal information is captured or that everybody is identified. Those claims would require the system’s documented architecture and governing arrangements.
Why the press release does not prove facial recognition
The operator describes crowd mapping, queue management and safety monitoring.
These can sometimes be performed using forms of image analysis that do not identify individuals by name.
Nothing in the cited launch description warrants an assertion that Punggol Coast Hawker Centre recognises every diner’s face or follows their personal shopping history. Specific identity-related claims need separate trustworthy evidence.
Why an aggregate count is different from a personal profile
An aggregate count describes a group or total under a chosen method, such as estimated visitors passing an entrance during an hour.
A personal profile links information to a particular identifiable person.
The distinction matters when discussing technology responsibly. An article should explain exactly what a source confirms and should not infer the more intrusive capability from the presence of cameras alone.
Why technology needs human oversight
Staff know operational context that a camera may not capture, such as a temporary equipment fault or a change to a stall’s order process.
A digital alert can be a prompt to investigate, not a replacement for informed judgment.
The most helpful operational arrangement combines reliable information, authorised decision-making and practical intervention when something needs attention.
Why a false queue estimate can inconvenience diners
Imagine a display indicating a short queue at one stall while several customers are waiting for collection elsewhere.
The information might be technically accurate for the visible line but incomplete for the service experience.
This shows why the definition of a metric matters. A useful queue system needs to communicate what is counted rather than let a numerical estimate imply more certainty than it supports.
Why published opening hours still require checking
JTC’s 2025 annex lists the centre’s initial operating hours as 6am to 10pm.
That does not establish that every individual stall follows those hours or that there will be no later cleaning closure or operational adjustment.
A family should check current centre information for a specific visit, especially where a meal depends on one named stall. The technology pilot does not guarantee universal stall availability.
Why the centre can be busy for different reasons
PDD contains workplaces, SIT facilities and public attractions. Demand may differ between term time and holidays, weekdays and weekends, or morning and evening.
An analytics system can help the operator study those differences under actual conditions.
A local article should not claim a particular demographic group accounts for a fixed percentage of sales without source data. Broad context is not a substitute for measured patron characteristics.
Why the hawker centre is distinct from One Punggol Hawker Centre
Punggol has another major hawker centre at the One Punggol hub. It has its own operator, setting and service arrangements.
Punggol Coast Hawker Centre is the Level 2 centre within PDD, opened in July 2025.
The general Why Punggol Hawker Centres Share Tables but Have Different Stalls article covers the common hawker model. This page focuses on the Coast centre’s specific AI operational pilot.
Why the AI pilot is not the district’s entire Open Digital Platform
PDD separately operates a broader Open Digital Platform for selected district systems.
Kopitiam’s press release describes its own funded hawker-centre video analytics programme. The public sources do not establish that every camera feed is directly linked to the district-wide platform.
A responsible explanation keeps the two systems separate unless an official integration statement proves their relationship. Similar technology vocabulary does not mean the infrastructure is identical.
Why a multilingual AI kiosk is a separate feature
A technology supplier has described a separate Punggol Coast installation of an AI assistant called Kimberly for responding to some diner enquiries and providing navigation or availability information.
That supplier claim concerns a customer-facing interface, whereas the operator release focuses on analytics behind the scenes.
The features should not be merged into one imaginary system that can cook, recognise all visitors and manage every stall autonomously. Their roles and the evidence supporting them differ.
Why useful AI should be measured by operational outcomes
A system might produce an impressive dashboard but fail to change how quickly staff respond to a spill or how well queues are managed.
A sensible evaluation measures relevant outcomes, such as alert usefulness, staff response and customer experience under comparable conditions.
The operator’s intent is documented; audited effectiveness figures would need appropriate subsequent measurements. A launch announcement alone does not prove a fixed reduction in every wait time.
Why bigger does not automatically mean better
A centre with more seats or cameras is not automatically more comfortable or efficient.
The way seating, stalls, routes, ventilation and staff responsibilities are organised can matter as much as the raw capacity count.
Punggol Coast’s 576 fixed seats and forty stalls provide context for the operations problem, but the quality of the solution requires observation and fair evaluation.
Why seating availability can change quickly
A group may occupy one table for a long meal while many other diners arrive and leave.
The number of free seats at a moment can change rapidly, even if the total fixed capacity stays the same.
An analytics system may help estimate crowd patterns, but it cannot guarantee that an arriving family finds an adjacent table group suitable for everybody.
Why a queue alert should preserve safety
When an area becomes crowded, an operator may redirect suitable staff to help with flow or cleaning.
That response should preserve fire exits, step-free routes and ordinary customer movement rather than shift the crowd into another unsafe bottleneck.
Good crowd management is not just minimising one number. It balances efficiency with safety and access for different users.
Why the actual food matters more than the technology
People visit a hawker centre to eat, drink and spend time with others. Food quality, hygiene, price and service remain primary concerns.
The analytics programme is worthwhile if it helps support those activities without adding unnecessary inconvenience or surveillance.
An article can explain an innovative system while acknowledging that a successful hawker centre ultimately depends on stallholders and the dining experience.
A fictional queue-length calculation
Suppose ten customers arrive during a five-minute interval and staff complete eight orders in that same period. Under a simple single-queue model, the unserved backlog grows by two orders.
That classroom arithmetic is not an observation of Punggol Coast. It illustrates why a queue can lengthen even when staff keep working.
The actual system involves multiple stalls, collection numbers and varied order times, so a complete model needs more information.
A fictional camera-alert case
A hypothetical camera flags a shiny patch on the floor as a potential spill. An authorised employee inspects the location and finds it is simply a reflection.
The staff member records the false alert for system evaluation rather than treating the software output as unquestionable truth.
This illustrates why alerts need follow-up and why false positives are part of an honest accuracy assessment.
A fictional missed-hazard case
A small spill occurs behind a pillar outside the camera’s useful view. A visitor notices it first and reports the location.
The example demonstrates that technology and public cooperation complement one another.
A camera system should not discourage people from reporting hazards or following ordinary safety procedures.
A fictional staffing scenario
Analytics show a recurring increase in diners around noon. A manager considers staffing and cleaning coverage in response.
Before changing rosters, the manager checks actual operations, worker availability and lawful working arrangements.
The exercise illustrates that data can inform a decision but does not automatically make one decision correct.
A fictional seat-count interpretation
A learner divides 576 fixed seats by 121 fixed tables and obtains about 4.76 seats per table as a simple average.
That is mathematically correct but does not mean every physical table has exactly 4.76 seats or that all seats are always available.
The activity shows why averages describe a collection rather than every individual item within it.
A fictional privacy question
A student reads that video analytics measures footfall and concludes the operator must know every visitor’s identity.
The teacher separates a possible group count from a named identity record and asks for evidence of the latter.
The corrected explanation reports the operator’s published analytics functions without inventing facial recognition.
A fictional comparison of 2024 and 2025 plans
An old article predicts more than 680 seats at the planned Punggol Coast centre. A later launch annex identifies 576 fixed seats.
The learner notes the publication dates and distinguishes projected capacity from the completed venue’s fixed seating count.
This demonstrates why new facilities should be described using the most appropriate realised source rather than mixing figures from different stages.
Teaching Guide: why an AI hawker centre still needs people
Learning goal: explain how camera-based analytics can inform queue and safety management while preserving staff roles and data boundaries.
Activity one: draw a food centre with stalls, tables, entrance and a circulation path. Identify places where lines or spills may create problems.
Activity two: distinguish footfall, queue length, completed orders and actual seating availability. Activity three: use invented arrival and service rates to model a queue.
Activity four: introduce a false alarm and a missed hazard. Discuss appropriate human verification. Activity five: compare a group count with an identifiable personal profile.
Activity six: use JTC’s 2025 release to list the verified functions and the claims that remain unproved. Transfer test: analyse analytics proposed for a library or sports facility without assuming the same measures suit every environment.
Frequently asked questions
When did Punggol Coast Hawker Centre open? On 25 July 2025.
Where is it? At 84 Punggol Way, Level 2, within Punggol Digital District.
How many stalls does it have? The launch described 40, including 34 cooked-food and six drinks/juice/dessert stalls.
How many seats are documented? The detailed opening annex lists 576 fixed seats at 121 fixed tables.
Why does the operator use AI video analytics? To support footfall, queue, cleanliness and safety management.
Does the AI cook meals? No. Stallholders and staff remain central to food preparation and service.
Does the system identify every diner by face? The cited launch documents do not establish that claim.
Will there never be a queue? No. Technology cannot eliminate every peak period or food preparation time.
Is it the same as One Punggol Hawker Centre? No. They are separate food centres.
Can the operator use insights to plan staffing? The published programme identifies manpower and operational planning as an intended benefit.
Your Next Step
Read JTC’s 25 July 2025 operator announcement, the JTC detailed hawker-centre annex and Punggol Digital District’s hawker centre page. These support the date, location, stall count, seated capacity and announced analytics purposes.
The earlier What to Expect for Punggol 2027 | Coast Hawker 40 Stalls and Value Meals covers food and visitor choices. Why Punggol Hawker Centres Share Tables but Have Different Stalls covers the general hawker model.
The one idea to remember is that AI at the Coast hawker centre is intended to give people running the venue better information. Good operations still depend on fair decisions, trained staff, safe and clean facilities, and the quality of the food being served.


