
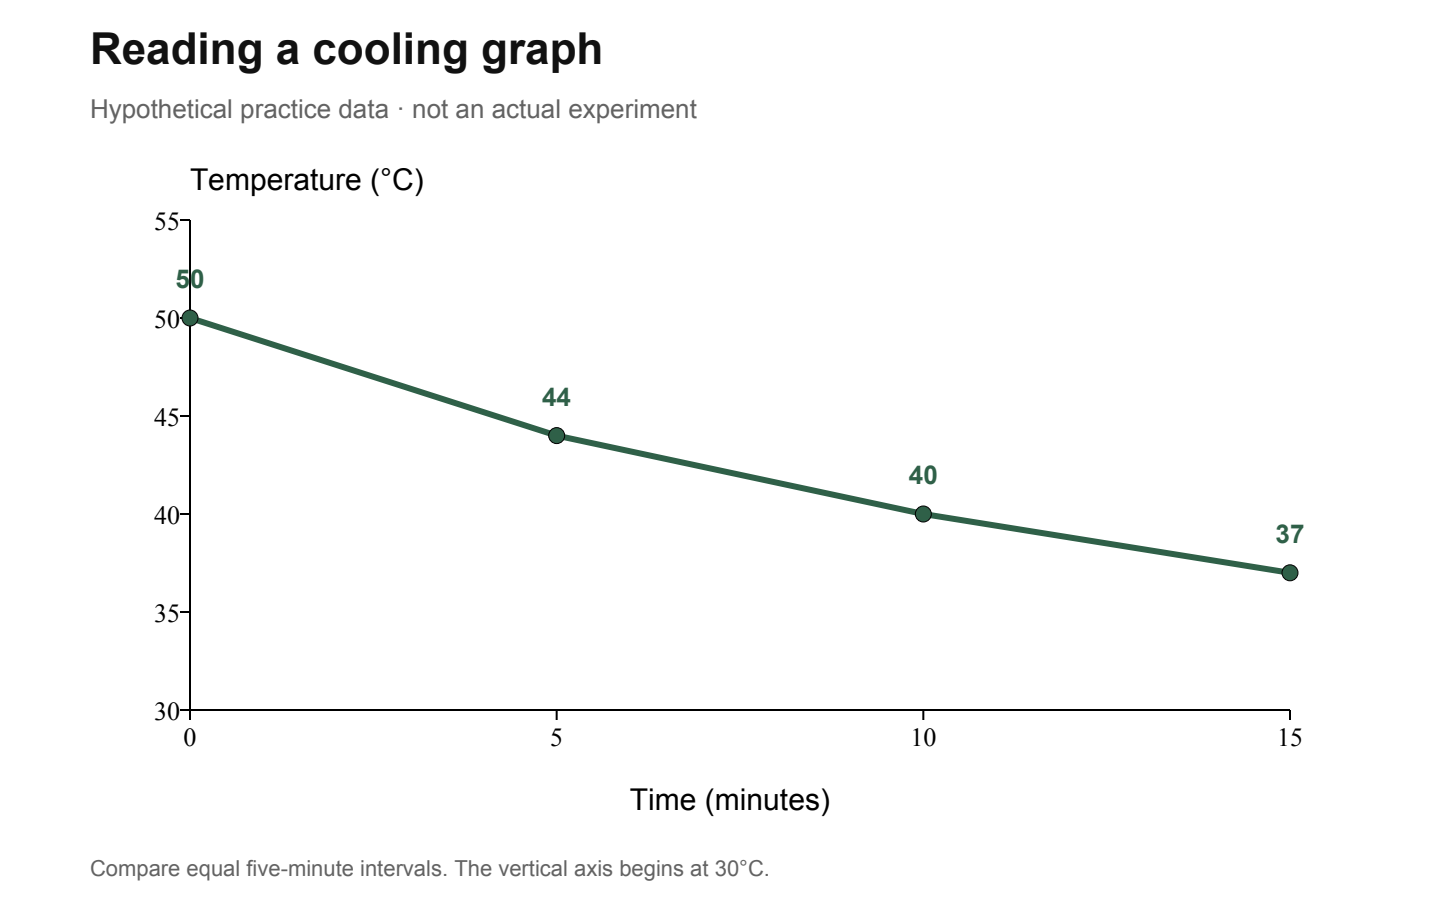
A Punggol student admitted through Posting Group 2 (PG2) can strengthen G2 Science by learning to read tables and graphs accurately, distinguish observations from explanations, identify variables and decide how far experimental evidence supports a conclusion. PG2 is a Secondary 1 admission group, while G2 is a particular subject level under Full Subject-Based Banding; the student’s actual Science class and school syllabus must be confirmed. A good Science answer does more than use the correct keywords. It shows why the evidence supports the scientific claim.
MOE’s lower-secondary G2/G3 Science syllabus emphasises scientific inquiry, interpreting data, communicating explanations and handling uncertainty with integrity. Students at Edgefield, Greendale, Punggol Secondary or Yusof Ishak Secondary may encounter those skills through lessons, school-approved practical activities and written work, although each school’s tasks differ. This guide focuses on analysing information rather than conducting physical experiments: families can use safe, clearly labelled fictional data to practise graphs, fair comparisons, accuracy, precision, sources of error, conclusions and independent explanation without recreating hazardous laboratory procedures at home.
- PG2 versus G2: school admission does not determine every individual’s Science level.
- Start with the question: identify whether the task asks you to describe, calculate, explain, compare or evaluate.
- Data tables: check units, headings, measurement conditions and missing information.
- Graphs: inspect axes, scale, points, trends and any misleading presentation.
- Variables: distinguish what is changed, what is measured and what should be controlled.
- Observations: state what the evidence actually records before inferring a cause.
- Repeats: understand consistency, precision, possible systematic errors and limits of inference.
- Ethics: never invent readings, conceal unusual results or collect unsafe evidence.
- Next action: describe one table and justify one conclusion independently.
Definition lock: subject level and scientific reasoning are separate from posting
Posting Group 2 is used in Singapore’s Secondary 1 posting system. G2 Science identifies the curriculum level of that subject when it is offered to the student. Under Full SBB, a learner may have different levels for individual subjects, so the label on an admission record cannot substitute for a school timetable. Parents should choose practice from the actual school syllabus rather than assume that every PG2 pupil studies one identical Science course.
Scientific reasoning, however, has a common foundation across levels: ask a clear question, gather appropriate evidence, interpret it honestly and communicate what follows. A pupil who learns to check units and avoid overclaiming develops habits valuable in every scientific topic. The difficulty of specific content may vary by syllabus, but reliable evidence remains central. This guide teaches those habits through paper-based examples rather than prescribing a laboratory experiment.

Why Science is more than a memory test
Some Science questions ask for knowledge of concepts, while others require interpreting unfamiliar data or applying those concepts to a new situation. Students who memorise complete paragraphs may do well on rehearsed prompts but struggle when a graph looks different or an experiment uses an unfamiliar context. The MOE G2/G3 lower-secondary framework explicitly values scientific inquiry and reasoned communication rather than facts in isolation.
A parent can help by asking what the result means before asking for the textbook explanation. If a temperature falls across several measurements, the observation is a fall. The reason may depend on heat transfer, measurement conditions or other factors. Do not immediately assume one cause. The student should connect the observation to relevant principles and recognise what is still unknown. That reasoning transfers more reliably than memorising an impressive definition.
Read the instruction word first
‘Describe’ and ‘explain’ are different commands. A description states features or trends shown by the material. An explanation gives relevant reasons using scientific ideas and evidence. ‘Calculate’ requires an appropriate mathematical method and units. ‘Compare’ asks for a relationship between the items, which may include similarities and differences. ‘Evaluate’ asks the learner to judge evidence, methods or limitations with reasons.
When a student writes a perfect explanation in response to a simple description task, time may be wasted and the answer may miss the required observation. Likewise, a detailed description of a trend will not satisfy a question that asks why it happens. Ask the child to underline the instruction word, identify the data needed and plan the answer. The school’s actual task and marks remain the authority for the expected depth.
The table heading is part of the answer
A data table may look easy to read, yet its meaning depends on headings and units. ‘Temperature’ without a unit is incomplete; 25 could mean different things depending on the scale. The student should read each column title and identify what is being changed or observed. If the table compares two conditions, check whether measurements were made at comparable times or using comparable methods.
At home, create a fictional table explicitly labelled as practice data. Ask the learner to state what each row represents before calculating an average. If a value is missing, write ‘not provided’ instead of inventing it. If the unit is unclear, explain why a firm numerical comparison may be impossible. Good scientific reading starts with the structure of the evidence, not with the most dramatic number in the table.
A worked example: compare repeated readings
Imagine a fictional exercise in which a timer records three intervals under Condition A: 12, 14 and 13 seconds. Under Condition B the intervals are 18, 17 and 19 seconds. The mean for A is 13 seconds, while the mean for B is 18 seconds. The range within each three-reading set is 2 seconds. A student can accurately say that the observed mean is higher for B in this supplied data.
These values are invented and do not represent an experiment at a Punggol school. The result alone cannot establish why one condition produced a longer interval or whether the difference would persist across many trials. The student should ask what the conditions were, how the intervals were measured and whether the method was comparable. Science starts to become meaningful when correct arithmetic is joined to a careful interpretation of what the numbers can prove.
Averages can conceal important variation
Two groups can have the same mean but different ranges. Suppose a fictional set is 10, 10 and 10, while another is 8, 10 and 12. Both average 10, but one is more spread out. A student who reports only the mean loses information about consistency. In some contexts, a median or a range is also helpful, although the choice of statistic depends on the question and the student’s syllabus.
Ask what the average is intended to communicate and whether unusual values deserve attention. Do not automatically erase an outlying reading to make the data neat. An unusual result may reflect error, an uncontrolled condition or a genuine event. The scientific task is to investigate responsibly, not alter evidence until it supports the hoped-for conclusion. Clear reporting preserves both central tendency and variation where relevant.
Make the graph axes intelligible
Before interpreting a graph, identify the horizontal and vertical axes and their units. Time may appear on the horizontal axis in a time-series graph, but not every graph uses that arrangement. If the horizontal axis lists categories, the shape of the display must be interpreted differently. Check the scale before reading point values; a graph labelled in steps of five cannot be read as though every grid line represents one unit.
Ask the learner to tell a one-sentence story of the graph using the correct quantities. For example, ‘The recorded temperature decreases as time increases over the supplied observations’ states an observable pattern. The statement should not add a mechanism unless other evidence or a relevant principle justifies it. This simple discipline prevents a student from confusing the geometry of the line with what the quantities actually mean.
Bar charts and line graphs answer different questions
A bar chart can compare categories, while a line graph is useful for a quantity recorded across ordered values such as time when the connecting relationship is meaningful. A student should not automatically join unrelated category bars with a line, because that may imply a continuous progression that the data do not support. Nor should a line be made smooth without evidence between the measurements.
A fictional dataset with three groups can be described in a bar chart using a zero baseline. A dataset recording the same quantity at regular time intervals may be represented as points connected appropriately. Ask why the chosen format helps answer the question. Chart selection is not a decorating skill; it is part of communicating evidence accurately. Good Science work makes the representation serve the measurements rather than reshape the measurements for visual effect.
A truncated axis can exaggerate differences
Imagine a bar chart comparing readings of 90 and 100 units. If the numerical axis begins at 89 rather than zero, the second bar may appear overwhelmingly larger even though the difference is ten units. The data remain the same, but the visual impression changes. Bar charts generally benefit from a zero baseline when comparing magnitudes, while other graph types may reasonably use a restricted range if it is clear and appropriate.
Teach the child to inspect the axis rather than accuse every nonzero graph of dishonesty. The right question is whether the scale allows readers to interpret the intended relationship without confusion. A student who recognises this can detect misleading visual presentations in news and schoolwork. Scientific honesty includes the way information is displayed, not only whether the table entries are copied correctly.
Read actual points rather than drawing conclusions from the picture
A line that slopes upward suggests an increase on the displayed axes, but the student should still read the numbers and units. A steep-looking line can represent a small absolute change if the scale is compressed. A nearly flat line might still contain a meaningful variation depending on measurement precision. The learner should identify specific points and calculate differences where required.
For a fictional temperature graph, record the observed start and end values before describing the trend. If the points are 20°C and 25°C, the measured difference is five degrees Celsius. That does not by itself say why the temperature changed. When asked for an explanation, the student should use the proper scientific context, not infer an entire mechanism from the line shape alone.
Rate of change needs both a numerator and a denominator
If a quantity changes by 12 units across 6 minutes, its average rate of change across that interval is 2 units per minute, subject to the units of the quantity. The calculation uses the change in measured quantity divided by the elapsed time, not merely one value divided by an arbitrary number. Ask the learner to label what is changing and the time period over which the change was observed.
The average rate does not prove the quantity changed uniformly at every instant. With sparse data, there may have been increases, pauses or fluctuations between readings. A student who states ‘an average of two units per minute over the observed interval’ is more precise than one who says the quantity must have changed by exactly two units during each minute. Distinguishing average from instantaneous behaviour is a useful scientific and mathematical habit.
What an independent variable does
The independent variable is the factor deliberately changed in a designed investigation. The dependent variable is the measured response. Controlled variables are other relevant conditions kept comparable. These words are often memorised as a sequence without understanding. The better approach is to ask what the investigator is changing, what result is being measured and what other factors could unfairly influence the comparison.
Use safe, paper-based scenarios for home practice. For example, a fictional school study could compare the clarity of two printed diagrams under otherwise similar viewing conditions. The independent variable might be the diagram design and the dependent variable a defined comprehension result. The task would still need suitable permissions if people were actually involved. Here it is simply a written example to practise reasoning, not a request to recruit participants.
Controlled variables make comparisons fairer
Suppose a fictional investigation changes both the size of the print and the time allowed to read it. If scores improve, which factor caused the difference? The design cannot easily isolate one from the other. A fair comparison tries to keep relevant conditions similar while varying the factor of interest. In real Science, perfect control may be difficult, and identifying uncontrolled factors is part of evaluating the result.
Ask students to name one possible confounding influence and explain how it could affect the conclusion. Avoid blanket phrases such as ‘the experiment is unfair’ without specifying why. The learner should connect the method weakness to the data’s interpretability. That connection is what turns vocabulary about variables into actual scientific reasoning.
Describe a limitation without dismissing all the evidence
An investigation may have a small sample, limited measurement range or uncertain instrument accuracy. Those limitations reduce how much can be concluded, but they do not necessarily make every observation worthless. A student should state the limitation and explain its consequence. For example, three readings from one condition give only a narrow picture of consistency across different times or settings. That is more informative than writing ‘the experiment was bad’.
Good evaluation balances what the evidence supports and what remains uncertain. If the table shows a consistent difference across its recorded trials, acknowledge the observed difference while noting that more data or better controls might be needed to infer a cause. The purpose is disciplined judgement rather than dramatic confidence or total scepticism.
Accuracy and precision are separate ideas
Accuracy concerns closeness to the true or accepted value, while precision concerns agreement among repeated measurements. A set of repeated readings can be tightly clustered but consistently displaced from a reference, perhaps because of a systematic error. Another set may be widely scattered yet average near a reference by chance. These distinctions help students evaluate measurement rather than treat every decimal place as proof of quality.
Use imaginary datasets with an explicit reference value. Ask whether the readings cluster together and whether that cluster is near the reference. Encourage the child to justify the judgement instead of writing ‘precise’ whenever a number has two decimal places. The number of displayed digits does not automatically establish how accurately an instrument was used.
Random and systematic errors lead to different questions
Random variation may cause repeated measurements to differ unpredictably, while a systematic error may shift readings in a consistent direction. The distinction should be taught through the actual school syllabus and suitable examples. A student may not be able to diagnose the exact cause from the numbers alone. Repeated readings can help describe variation, but they do not automatically reveal a hidden instrument problem without additional checks.
Ask what evidence would help identify the cause. Was the instrument calibrated correctly? Were conditions comparable? Was the reading procedure consistent? These are conceptual questions for discussion, not instructions for a teenager to recalibrate laboratory equipment without supervision. The scientific habit is to investigate the reliability of evidence while respecting the school’s safety rules.
Unexpected readings should be recorded honestly
An unusual result can feel like a mistake a student wants to erase. But changing a measurement to match a textbook prediction is data fabrication. The MOE Science framework explicitly values integrity in handling and communicating data. An odd reading may reflect error, an uncontrolled condition or a real process that needs further explanation. The first duty is to preserve what was recorded and identify uncertainty honestly.
A student can describe why a reading is surprising and what additional authorised tests would help evaluate it. They should not remove it from an average simply because it looks inconvenient unless the method provides a justified reason. At home, use fictional data to rehearse the argument. The purpose is to become comfortable with evidence that does not fit an initial expectation.
Correlation does not automatically establish causation
If two quantities increase together, a graph may display an association. That does not by itself prove that one caused the other. Both may be influenced by another factor, the relationship may be coincidental or the sample may be limited. This principle is valuable for reading claims about health, technology, environmental change and everyday life. Students should learn to ask what method could distinguish alternative explanations.
A fictional study might show that both sales of a product and the number of rainy days change across months. Without further evidence, the learner should not declare a causal mechanism. State the observed pattern and identify what information would be needed. The goal is not to make students distrust every graph; it is to teach the difference between a numerical relationship and a justified scientific explanation.
A causal explanation should have a coherent chain
A strong Science answer connects a condition to a process and then to an observable result. The chain must use correct concepts from the relevant syllabus rather than a collection of technical words. If a student writes ‘because energy changed’, ask what form of energy, which transfer or interaction and how that leads to the reported observation. Vague keywords are rarely enough to explain a mechanism.
Use one familiar textbook example and then a fresh situation where the same principle applies. A pupil who can adapt the explanation has learned more than one who repeats a paragraph verbatim. When the mechanism is unknown from the supplied data, the student should say what is uncertain. A good scientific explanation is as strong as the evidence and theory connecting its steps.
The difference between evidence and a model
A model simplifies some features of a real system to make an idea easier to understand. A diagram of particles, a graph of changing quantities or a computer simulation can be informative without reproducing every detail of reality. Students should identify what the model represents and what it omits. An animated demonstration may show a tidy outcome while real measurements contain variation or practical limitations.
Ask whether a statement comes from direct measurement, a model prediction or an accepted scientific explanation. These are related but distinct sources of knowledge. A student who confuses an animated particle picture with a microscopic recording may make inaccurate claims. Good Science learning uses models to think while keeping their limitations visible.
The graph and the explanation must agree
A learner may produce a correct graph and then write a conclusion inconsistent with it. For instance, the graph may show a quantity decreasing while the explanation asserts that it increases throughout the interval. Ask the student to point to the specific values supporting each claim. If they cannot, the sentence needs revision. This is an important editing method: check every reported trend against the original data before discussing causes.
The same applies to comparisons. If Condition B has a higher mean than Condition A in fictional values, the answer must not accidentally reverse the labels. Consistent notation helps prevent this mistake. Scientific writing is not a display of difficult words; it is a faithful account of evidence organised into a coherent explanation.
A Punggol setting can inspire a question without supplying the answer
Public parks, transport systems and waterways may prompt curiosity about temperature, energy, plant growth or environmental conditions. But ordinary visual observations do not establish water quality, biodiversity or the performance of infrastructure. A student should not claim a measured Punggol result simply because the place is familiar. Use verified published scientific information for factual local statements, or clearly label numbers as hypothetical practice data.
There is also no need to undertake unsupervised experiments to make the exercise local. A fictional data table inspired by an everyday question can teach axis reading and inference effectively. If the school assigns a genuine field investigation, follow its approved method, supervision and permissions. Students should not collect water, wildlife or personal information in an effort to produce dramatic graphs.
Scientific conclusions should include the scope
A conclusion answers the research question using the evidence collected. It should specify which conditions and interval it applies to where relevant. A table of three readings under two conditions may support a narrow comparison for those trials. It does not establish a universal law applying to every person, season or location. The student should learn to express the result accurately and include a significant limitation when the task calls for evaluation.
A useful sentence pattern is: ‘In the supplied results, the average for Condition B was higher than for Condition A; however, these values alone do not establish the cause.’ The wording is deliberately cautious because the example is fictional and underspecified. A stronger claim would require a better-described investigation. Honest limits make a conclusion more scientifically valuable, not weaker.
A fictional learner discovers a graph-scale error
Imagine a fictional student, Nisha, who reads a Science bar chart with a vertical scale of five units per division. She counts four grid spaces and writes a difference of four units. Her teacher asks her to read the axis labels and explain what each interval represents. Nisha realises that four spaces correspond to twenty units on that graph. She then tries a different chart using two-unit intervals.
The first incorrect step was scale interpretation rather than arithmetic. After the correction, the student can apply the same checking method to new data. This is an invented example, not a report from any named Punggol school. Its educational value is that the correction targets a transferable skill rather than requiring Nisha to repeat the same memorised graph.
Another fictional learner confuses explanation with observation
Imagine a fictional student, Haris, who sees data showing that a measured quantity declines over time. His first answer states a detailed causal mechanism that the prompt does not establish. The teacher asks which readings support that mechanism and which merely show the decline. Haris separates his response into the observed trend and a proposed explanation that would require additional conditions or knowledge.
When given a fresh graph, he practices identifying what can be stated directly and what needs further evidence. The improvement is not simply a higher level of caution; it is a more accurate logical structure. Students should learn to be confident where evidence is strong and careful where it is insufficient. This is an essential skill for science and everyday decision-making.
A correction notebook can record the reasoning failure
Do not require the student to copy every incorrect answer into a decorative notebook. Select recurring and important mistakes. Record the original task, the first wrong reasoning step, the corrected principle and a fresh problem solved without help. For a graph, the issue might be scale or units. For an investigation, it might be uncontrolled variables. For a conclusion, it might be a causal claim unsupported by the observations.
Revisit the corrected concept after a gap. If the learner still makes the same mistake on a new question, the understanding is not stable and the explanation should be reconsidered. If the learner identifies the issue independently, the correction has begun to transfer. The purpose of revision is not accumulating pages; it is developing a way to check scientific reasoning.
A two-week paper-based Science inquiry routine
During the first few sessions, practise reading tables with units and calculating simple differences or means. Next, convert suitable tables into labelled graphs and inspect scales. Then use imaginary investigations to identify independent, dependent and controlled variables. Later, ask the learner to describe trends, suggest relevant explanations and identify one limitation. End with a fresh unseen dataset and an independent written conclusion. Adjust the order to the actual school’s syllabus and timetable.
The tasks can be completed safely with paper and school-approved resources. Do not purchase hazardous experiment kits or ask a child to reproduce laboratory demonstrations at home. When a concept remains difficult, contact the Science teacher for a suitable explanation. A short, carefully chosen exercise is often more valuable than a large unrelated worksheet pack.
How to assess whether the student really understands
Ask three things after a practice exercise: what do the data directly show, why does the student think that pattern occurred and what evidence would help check the explanation? These questions reveal whether the learner can distinguish observation, theory and further investigation. A student who can answer them on a new question is developing genuine scientific literacy.
Do not score learning only by how quickly the teenager selects a multiple-choice answer. Speed may improve with familiarity even when reasoning remains weak. The stronger test is transfer: can the learner handle new axes, different values or another scientific context without being prompted toward the method? Targeted feedback should gradually reduce dependence on adults, teachers or tutors.
Sources, related guides and your next step
Use MOE’s Lower Secondary G2/G3 Science Syllabus for scientific inquiry, data handling, evidence and integrity. SEAB’s 2027 G2 syllabus index identifies the graduating SEC subject codes when relevant, but a Secondary 1 learner must follow their own current school programme. This article is about interpreting data, while the PG2 laboratory guide separately covers supervised practical safety.
For stronger mathematical scale reading, consult the PG2 G2 Mathematics graphs guide. Your next step is to choose one genuine school-assigned graph or a clearly fictional example. Ask the child to identify the axes and units, state the trend, explain only what the evidence supports and acknowledge a meaningful limitation.
Frequently asked questions about PG2 G2 Science data and fair-test reasoning
Does PG2 automatically fix a child’s Science level at G2?
No. Admission group and subject curriculum level are different; check the actual school offer.
What is the first step in a data-based Science question?
Identify the command word, read table or graph headings and check units before calculating or explaining.
How are accuracy and precision different?
Accuracy is closeness to a true or reference value; precision is agreement among repeated readings.
Can one graph show the cause of a trend?
Not necessarily. A pattern may require other measurements, relevant theory and a valid method before a causal explanation is justified.
Why should students repeat measurements?
Repeated readings can help assess consistency and reveal variation, although they do not automatically remove systematic error.
What is a controlled variable?
A relevant condition kept comparable while the independent variable is changed and the dependent response is measured.
Should students delete an unusual reading?
No. Preserve evidence and investigate whether there is a justified reason to exclude or interpret it differently.
Can parents invent a small table for practice?
Yes, provided the values are clearly labelled fictional and never presented as real experimental results.
Must families perform experiments at home?
No. Paper-based data analysis and teacher-approved resources can teach reasoning safely.
How does a student demonstrate a sound conclusion?
State a claim tied to specific data and relevant concepts, avoiding conclusions wider than the evidence permits.
Editorial note: Published 1 November 2026. All sample measurements, conditions and student stories are invented for teaching. The published graph is labelled hypothetical. Actual school practical work must follow authorised teacher instructions and safety requirements.


