
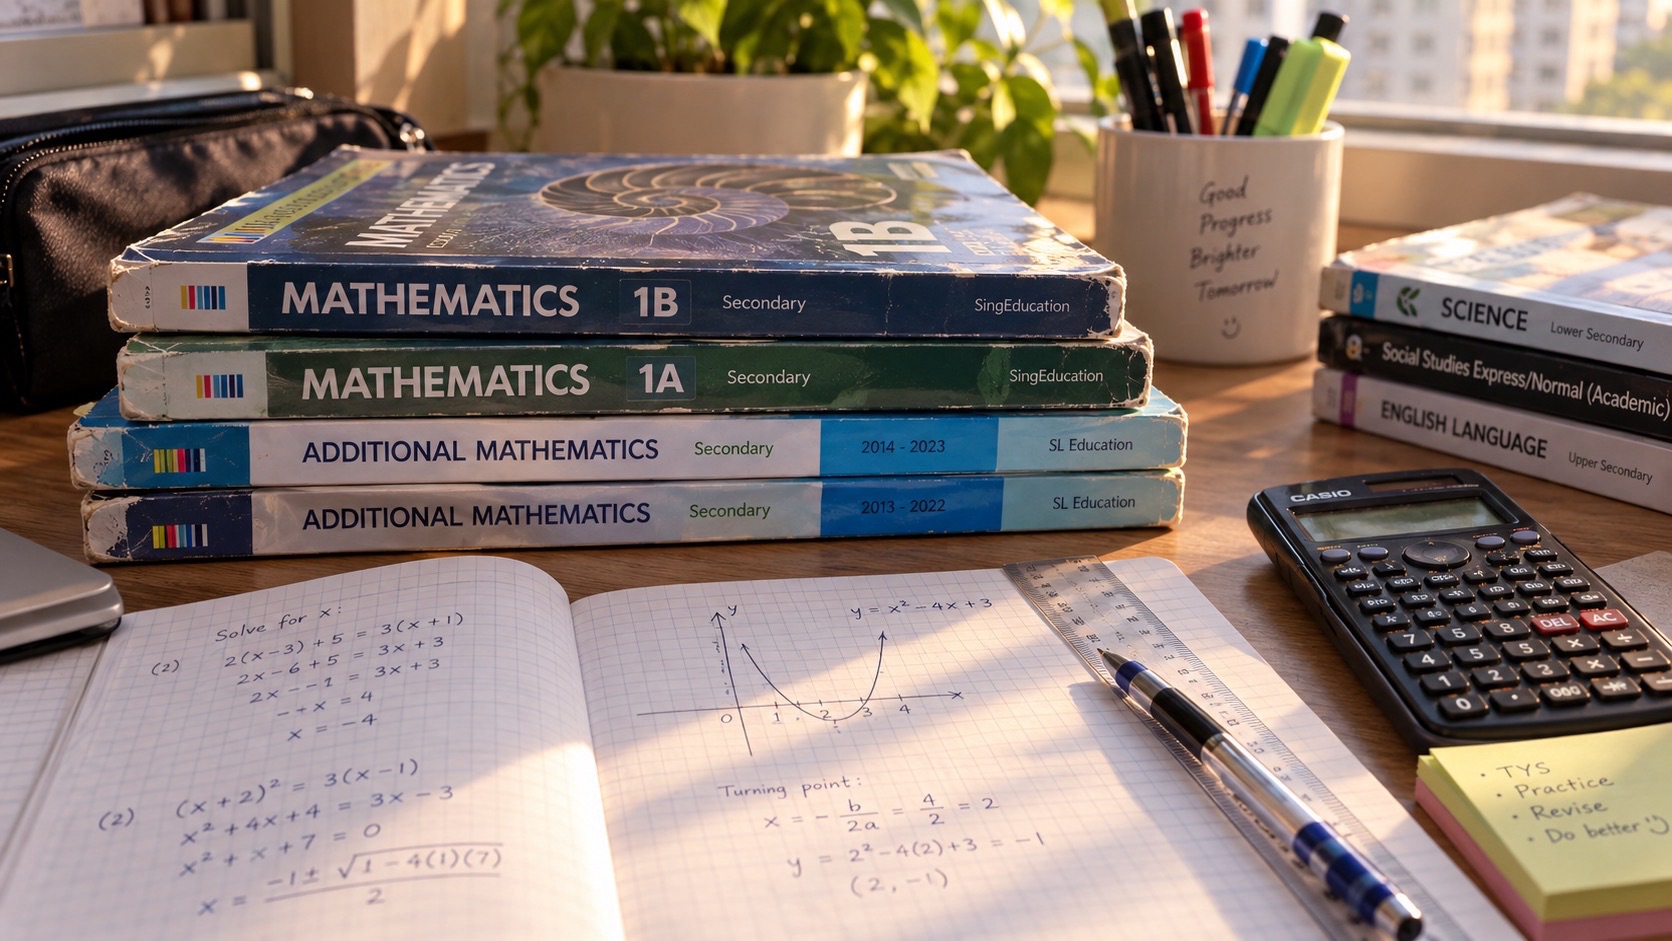
The answer first: Mathematical modelling in Punggol means using Singapore’s national Mathematics concepts to represent a real question, solve it, interpret the result and reflect on whether the assumptions are reliable. MOE places problem solving at the centre of its Mathematics framework. Children may start with counters, diagrams and bar models before progressing to graphs, functions, statistics and university-level simulations. A mathematically correct calculation is not useful if it answers the wrong question, refers to the wrong physical feature or presents a hypothetical result as fact.
This guide provides a complete route from Primary to University and uses carefully distinguished Punggol settings. For example, HDB describes the landscaped waterway as 4.2 km, while NParks describes a different 8.4 km Waterway park-connector route along both sides. Those figures cannot be substituted without defining what is actually being measured. Every original worked question below makes its input and meaning explicit.
Updated 21 October 2026. Real-world sources are separated from invented classroom quantities. Prices, event attendance, flow rates and sensor values in the worked examples are hypothetical. The official references establish the real public programme or geographic descriptions, not the fabricated teaching numbers.
The mathematical modelling cycle in four actions
- Formulate: define the question, quantities, assumptions and mathematical representation.
- Solve: carry out an appropriate calculation or use a suitable mathematical tool.
- Interpret: translate the mathematical result into the real question with correct units and domain.
- Reflect: check sensitivity, observation evidence and whether the model needs improvement.
- Local source caution: never confuse channel length, a park connector route and a specific journey.
- Level progression: concrete drawings in Primary, symbolic modelling in Secondary, advanced functions and evidence at University.
Fast contents: find the model or mistake
- 1. Why modelling belongs within Singapore Mathematics
- 2. The four steps formulating, solving, interpreting and reflecting
- 3. Different mathematical models describe different aspects
- 4. The Punggol Waterway channel is not its whole promenade
- 5. Route length is not the same as straight-line distance
- 6. Units are part of the model, not decoration
- 7. Estimates provide a range before precision
- 8. A scale factor changes lengths, areas and volumes differently
- 9. A budget model must show its reference quantities
- 10. Break-even points require integer context
- 11. Ratios are not actual headcounts
- 12. Change-of-reference problems need multiple stages
- 13. Water-flow models distinguish rate and accumulated volume
- 14. Average speed and instantaneous speed differ
- 15. Area and perimeter answer different physical questions
- 16. A bridge model should state structural assumptions
- 17. Data collection requires a precise question
- 18. Sampling bias is more important than a beautiful graph
- 19. Axes and keys determine data meaning
- 20. Mean and median describe different aspects of a dataset
- 21. Correlation does not establish a causal story
- 22. Error bars communicate uncertainty
- 23. Sensitivity analysis tests what assumptions matter most
- 24. Optimization needs a valid domain
- 25. Modelling with linear regression has limits
- 26. Models can be implemented in spreadsheets or code
- 27. A Primary pupil can model with drawings and objects
- 28. Secondary learners should state assumptions before equations
- 29. University models need validation beyond the calculation
- 30. An eight-week local mathematics investigation
Why models must connect the mathematical world with the real one
A model is an intentional abstraction. We simplify a real question to quantities we can calculate, yet must preserve the parts that matter to the decision. If the purpose is material area, a square-metre answer can be useful; if it is a safe structural design, a rectangle alone is insufficient. Students therefore need mathematical methods and the judgement to say what the methods do not establish.
1. Why modelling belongs within Singapore Mathematics
Model concept. MOE’s Mathematics framework puts problem solving at the centre, supported by concepts, skills, processes, metacognition and attitudes. Mathematical modelling connects that learning to real situations with quantities that may be incomplete or uncertain. It is not a fourth examination strand separate from all ordinary number, geometry and data work.
Original worked example or verified distinction. A family wants to estimate the cost of photocopying worksheets. The calculation requires a price per page, number of pages and any minimum charge. Only after defining those assumptions can a multiplication answer be meaningful. After the calculation, state precisely what has been counted, measured or predicted and whether the answer follows from assumptions.
The misconception. A pupil immediately multiplies two visible numbers without knowing whether one refers to pages, sets or dollars. The calculation may be arithmetically correct but answer a different question. A number produced by a valid algorithm can be the wrong answer if the original relationship was misunderstood.
Repair and independent transfer. Ask the learner to name the desired output, its unit, the inputs and a missing piece of information. Solve only after those decisions are written down. Retest with changed inputs or a revised question without showing the worked solution. The learner should choose the representation independently.
2. The four steps formulating, solving, interpreting and reflecting
Model concept. MOE’s syllabus explains modelling as formulating a real-world problem mathematically, solving the resulting model, interpreting the solution back in its original setting and reflecting on whether assumptions or simplifications should change. It is a cycle because interpretation may reveal a weakness that requires a revised model.
Original worked example or verified distinction. Estimate attendance at a fictional event: assume four sessions with twenty-five visitors each, giving 100 session attendances. If the same person can attend multiple sessions, that is not necessarily one hundred different people. Reflection identifies the missing distinction. After the calculation, state precisely what has been counted, measured or predicted and whether the answer follows from assumptions.
The misconception. A student labels the computed one hundred as unique visitors, even though the model only counts attendance instances. A number produced by a valid algorithm can be the wrong answer if the original relationship was misunderstood.
Repair and independent transfer. Write separate headings for the real question, model, calculation, interpretation and what to improve. Change the assumed average visitors per session and recompute. Retest with changed inputs or a revised question without showing the worked solution. The learner should choose the representation independently.
3. Different mathematical models describe different aspects
Model concept. A model is a purposeful simplification, not a flawless copy of the world. A diagram can describe an area, an equation a rate, a graph a trend and a probability distribution uncertainty. Model quality depends on whether the representation preserves the relationships needed for the specific decision.
Original worked example or verified distinction. A scaled plan of a playground is suitable for calculating approximate covered area. A budget table is more suitable for computing money spent, and a timetable is better for ordering events. No one representation answers every question. After the calculation, state precisely what has been counted, measured or predicted and whether the answer follows from assumptions.
The misconception. A learner uses a single rectangle formula to solve a transport scheduling question because a rectangle appeared earlier in class. The model is unrelated to the unknown. A number produced by a valid algorithm can be the wrong answer if the original relationship was misunderstood.
Repair and independent transfer. Ask what exactly should be predicted or compared, then choose the simplest model that retains necessary information. Describe which details it intentionally leaves out. Retest with changed inputs or a revised question without showing the worked solution. The learner should choose the representation independently.
4. The Punggol Waterway channel is not its whole promenade
Model concept. HDB describes a roughly 4.2 km landscaped Punggol Waterway, while NParks lists an 8.4 km Punggol Waterway park-connector route along both sides. These are different measured features, not two contradictory values for an identical object. URA also describes a distinct 26 km North-Eastern Riverine Loop.
Original worked example or verified distinction. A student uses 4.2 km as the channel length and 8.4 km as the stated track length, clearly labelling each. The numbers can be used in a modelling comparison without claiming every pair of actual start and end points gives precisely the same distance. After the calculation, state precisely what has been counted, measured or predicted and whether the answer follows from assumptions.
The misconception. A child averages 4.2 and 8.4 and calls the result the waterway’s official length. The error is not arithmetic; the sources describe different physical objects. A number produced by a valid algorithm can be the wrong answer if the original relationship was misunderstood.
Repair and independent transfer. Before calculating, record the exact feature, route, source date and unit. Use an official route reference instead of inventing an exact walking itinerary from channel length. Retest with changed inputs or a revised question without showing the worked solution. The learner should choose the representation independently.
5. Route length is not the same as straight-line distance
Model concept. Mathematical distance depends on the chosen geometry and route. A line drawn between two locations gives an as-the-crow-flies quantity, while a practical journey follows a path shaped by streets, bridges, crossings and access constraints.
Original worked example or verified distinction. On a fictional coordinate grid, points A=(0,0) and B=(3,4) have straight-line separation five grid units. A route travelling three units east then four north totals seven units. Both results describe different questions. After the calculation, state precisely what has been counted, measured or predicted and whether the answer follows from assumptions.
The misconception. The learner gives five as the distance actually walked, even though the scenario states a two-segment path. A second mistake reports seven as the Euclidean diagonal. A number produced by a valid algorithm can be the wrong answer if the original relationship was misunderstood.
Repair and independent transfer. Draw both the path and straight connection in distinct styles. Label whether the problem asks for route distance, displacement or direct separation. Retest with changed inputs or a revised question without showing the worked solution. The learner should choose the representation independently.
6. Units are part of the model, not decoration
Model concept. A number without its unit may be meaningless when it represents a physical quantity. Length is measured in linear units, area in square units, volume in cubic units and rates in one unit per another. Unit conversion should preserve the physical quantity.
Original worked example or verified distinction. A hypothetical route of 2.4 km is 2,400 m. At a modelled average speed of 1.2 m/s, travel duration is 2,400/1.2=2,000 seconds or 33 minutes 20 seconds under the simplified constant-speed assumption. After the calculation, state precisely what has been counted, measured or predicted and whether the answer follows from assumptions.
The misconception. A student divides 2.4 by 1.2 and reports two seconds, silently mixing kilometres and metres. A calculator cannot detect the mistake. A number produced by a valid algorithm can be the wrong answer if the original relationship was misunderstood.
Repair and independent transfer. Write input and output units before operations, convert to a common system, then multiply back to check the relation. Retest with changed inputs or a revised question without showing the worked solution. The learner should choose the representation independently.
7. Estimates provide a range before precision
Model concept. An estimate is useful for checking a model before exact arithmetic. It can expose a missing zero, a decimal conversion error or a physical impossibility. But an approximate result should not be presented as a measured fact with unwarranted decimal places.
Original worked example or verified distinction. If a hypothetical path is around 3 km and walking speed around 4 km/h, the journey is approximately three quarters of an hour, before accounting for stops and variation. Exact timing is not supported by such rounded assumptions. After the calculation, state precisely what has been counted, measured or predicted and whether the answer follows from assumptions.
The misconception. A pupil calculates a result to six decimals and writes it as a guaranteed arrival time, even though input distance and speed were rough estimates. A number produced by a valid algorithm can be the wrong answer if the original relationship was misunderstood.
Repair and independent transfer. State which inputs were measured and which were assumed. Round the output appropriately and explain sources of variation. Retest with changed inputs or a revised question without showing the worked solution. The learner should choose the representation independently.
8. A scale factor changes lengths, areas and volumes differently
Model concept. If a drawing is enlarged by a linear factor k, corresponding lengths multiply by k, areas by k² and volumes by k³. The exponent follows how many dimensions contribute to the measurement.
Original worked example or verified distinction. A rectangular poster is enlarged to double its width and height. Original 3 cm by 4 cm area is 12 cm²; enlarged 6 cm by 8 cm area is 48 cm², four times the original, not twice. After the calculation, state precisely what has been counted, measured or predicted and whether the answer follows from assumptions.
The misconception. A student multiplies the area by two because the problem says every length is doubled, confusing one dimension with two. A number produced by a valid algorithm can be the wrong answer if the original relationship was misunderstood.
Repair and independent transfer. Draw a grid rectangle and count unit squares before and after enlargement. Repeat with cubes for the cubic scaling idea. Retest with changed inputs or a revised question without showing the worked solution. The learner should choose the representation independently.
9. A budget model must show its reference quantities
Model concept. School outings and projects require costs per person, fixed costs and sometimes variable charges. A good budget keeps those categories separate, so changing the participant count has the expected mathematical effect. All prices in this exercise are fictional.
Original worked example or verified distinction. A club rents a room for S$80 and spends S$6 on materials per pupil. For fifteen pupils, total is 80+6×15=S$170. At twenty pupils, total is S$200, not S$220; the room cost remains fixed. After the calculation, state precisely what has been counted, measured or predicted and whether the answer follows from assumptions.
The misconception. The student multiplies the room charge by participant count or assumes materials are free because the fixed fee appears first. A number produced by a valid algorithm can be the wrong answer if the original relationship was misunderstood.
Repair and independent transfer. Define C(n)=80+6n and explain the constant and coefficient. Check the change C(20)−C(15)=S$30. Retest with changed inputs or a revised question without showing the worked solution. The learner should choose the representation independently.
10. Break-even points require integer context
Model concept. A mathematical equation may give a fractional break-even attendance count. But attendance is a whole-person quantity, so interpretation can require rounding up or comparing neighbouring integers.
Original worked example or verified distinction. A fictional event has fixed cost S$110, variable cost S$5 per attendee and revenue S$12 per attendee. Net is 7n−110. Solve net≥0: n≥110/7≈15.71, so the smallest whole attendee count that breaks even is sixteen. After the calculation, state precisely what has been counted, measured or predicted and whether the answer follows from assumptions.
The misconception. A pupil reports 15.71 people as a practical target or rounds down to fifteen and creates a loss. A number produced by a valid algorithm can be the wrong answer if the original relationship was misunderstood.
Repair and independent transfer. State domain n as nonnegative integers and test n=15 and n=16 in the original net equation. Retest with changed inputs or a revised question without showing the worked solution. The learner should choose the representation independently.
11. Ratios are not actual headcounts
Model concept. Ratio compares the relative sizes of quantities in a specified order and needs a known total or one actual part to produce a headcount. Mixing part-to-part ratios with fractions of a whole can create a convincing but incorrect model.
Original worked example or verified distinction. In a fictional club, boys:girls is 3:2 with 25 members. Five equal ratio parts mean five people each, giving fifteen boys and ten girls. Boys as a fraction of the whole is 15/25=3/5, not 3/2. After the calculation, state precisely what has been counted, measured or predicted and whether the answer follows from assumptions.
The misconception. A learner takes the ratio values as three boys and two girls even though the actual group has twenty-five members. A number produced by a valid algorithm can be the wrong answer if the original relationship was misunderstood.
Repair and independent transfer. Draw two labelled proportional bars and use a whole-of-five-parts calculation. Retest after changing the total to forty. Retest with changed inputs or a revised question without showing the worked solution. The learner should choose the representation independently.
12. Change-of-reference problems need multiple stages
Model concept. A fraction of a remainder or a percentage increase after a discount has a new base at each stage. Modelling these as sequential transformations protects against applying both operations to the starting amount.
Original worked example or verified distinction. Start with a fictitious S$200 project allowance. Spend 20%, S$40, leaving S$160. Then spend one quarter of that remainder, S$40, leaving S$120. The second quarter is not of the original S$200. After the calculation, state precisely what has been counted, measured or predicted and whether the answer follows from assumptions.
The misconception. A student applies one quarter to the original and subtracts S$50 at the second stage, producing an incorrect final amount. A number produced by a valid algorithm can be the wrong answer if the original relationship was misunderstood.
Repair and independent transfer. Use a before/after table for each transaction. Label the changing base and reconstruct the starting amount from all parts. Retest with changed inputs or a revised question without showing the worked solution. The learner should choose the representation independently.
13. Water-flow models distinguish rate and accumulated volume
Model concept. A flow rate measures volume per time; accumulated volume is the amount delivered across a period. When the rate varies, multiplying the final rate by the entire duration usually does not give the correct accumulated amount.
Original worked example or verified distinction. A synthetic flow model q(t)=2t litres per second runs for five seconds. Total delivered volume is the area under the rate graph, ∫ from 0 to 5 of 2t dt=25 litres. The final rate at five seconds is 10 litres per second. After the calculation, state precisely what has been counted, measured or predicted and whether the answer follows from assumptions.
The misconception. The learner computes 10×5=50 litres, treating the final rate as if it had been constant from the beginning. A number produced by a valid algorithm can be the wrong answer if the original relationship was misunderstood.
Repair and independent transfer. Sketch the triangular rate-time region and compare area half×5×10=25 with the integral. State which quantities are rates and which are totals. Retest with changed inputs or a revised question without showing the worked solution. The learner should choose the representation independently.
14. Average speed and instantaneous speed differ
Model concept. Total distance divided by total duration gives average speed. Instantaneous speed describes the magnitude of velocity at a particular time. Neither statement means the object moved at that speed every moment.
Original worked example or verified distinction. A fictional 12 km trip lasts forty minutes, or two thirds of an hour. Average speed is 12/(2/3)=18 km/h. The route might include both faster movement and stops while keeping that overall average. After the calculation, state precisely what has been counted, measured or predicted and whether the answer follows from assumptions.
The misconception. A student assumes eighteen is the exact speed throughout the trip, or divides by forty without converting minutes. A number produced by a valid algorithm can be the wrong answer if the original relationship was misunderstood.
Repair and independent transfer. Create a small distance-time table and compute average speed across two segments. Compare individual segment speeds with the combined journey’s average. Retest with changed inputs or a revised question without showing the worked solution. The learner should choose the representation independently.
15. Area and perimeter answer different physical questions
Model concept. Area measures space covered; perimeter measures the external boundary. Modelling material coverage versus fencing demands different quantities and units. A complicated outline should first be partitioned into known shapes without overlaps.
Original worked example or verified distinction. A 10 m by 6 m garden uses 60 square metres of material to cover it under an idealised model. A border along its outside needs 2(10+6)=32 metres. These two answers cannot be compared numerically as if their units match. After the calculation, state precisely what has been counted, measured or predicted and whether the answer follows from assumptions.
The misconception. A pupil uses sixty metres as fencing or thirty-two square metres as surface coverage. A correct operation for another question can still answer the wrong task. A number produced by a valid algorithm can be the wrong answer if the original relationship was misunderstood.
Repair and independent transfer. Shade the interior and trace the boundary. Ask for the unit before selecting a formula, then change the dimensions. Retest with changed inputs or a revised question without showing the worked solution. The learner should choose the representation independently.
16. A bridge model should state structural assumptions
Model concept. Mathematics can illustrate bridge angles and supports, but a classroom model is not a safety-certified engineering design. Real structures depend on loads, materials, regulations and site measurements that simple triangles omit.
Original worked example or verified distinction. A fictional right triangle has horizontal span 8 m and vertical rise 6 m. Its diagonal length is √(8²+6²)=10 m. This is a geometry result, not evidence the proposed span is structurally safe. After the calculation, state precisely what has been counted, measured or predicted and whether the answer follows from assumptions.
The misconception. A student calls ten metres a safe cable specification without identifying material strength, attachment forces or engineering requirements. A number produced by a valid algorithm can be the wrong answer if the original relationship was misunderstood.
Repair and independent transfer. Separate geometric measurements from actual safety criteria. Use a labelled sketch for the theorem and make explicit what cannot be concluded. Retest with changed inputs or a revised question without showing the worked solution. The learner should choose the representation independently.
17. Data collection requires a precise question
Model concept. Counting visitors, cyclists or birds depends on where, when and how observations are recorded. A count at one point during one short period does not automatically measure the whole population or daily total.
Original worked example or verified distinction. A fictional student records thirty cyclists in ten minutes at one checkpoint. Extrapolating 30×6=180 cyclists per hour assumes a stable rate for the entire hour, which was not observed. After the calculation, state precisely what has been counted, measured or predicted and whether the answer follows from assumptions.
The misconception. The learner calls one hundred eighty an actual count, not a modelled estimate. A number produced by a valid algorithm can be the wrong answer if the original relationship was misunderstood.
Repair and independent transfer. Record the observation window and collection method, and distinguish observed count from extrapolation. Repeat sampling at multiple intervals before considering a wider estimate. Retest with changed inputs or a revised question without showing the worked solution. The learner should choose the representation independently.
18. Sampling bias is more important than a beautiful graph
Model concept. A larger dataset may be misleading if collection systematically excludes relevant groups or times. Sampling design matters when making claims about all park users, households or students.
Original worked example or verified distinction. Surveying only cyclists about how residents travel to the waterfront will naturally overrepresent cycling. No accurate percentage calculation repairs the exclusion of walkers or transit users. After the calculation, state precisely what has been counted, measured or predicted and whether the answer follows from assumptions.
The misconception. A student plots hundreds of responses and claims the results describe all Punggol households, ignoring who was actually surveyed. A number produced by a valid algorithm can be the wrong answer if the original relationship was misunderstood.
Repair and independent transfer. Define the target population, sample frame and sampling limitations before graphing. Suggest an improved method with diverse collection points. Retest with changed inputs or a revised question without showing the worked solution. The learner should choose the representation independently.
19. Axes and keys determine data meaning
Model concept. In a graph, the scale is a mathematical mapping from physical marks to quantitative values. Ignoring units or a key can produce an answer that sounds precise but is wrong.
Original worked example or verified distinction. An example bar chart uses a vertical scale of five people per tick. A bar ending at the fourth tick represents twenty people, not four. A bar at the second tick represents ten, a difference of ten. After the calculation, state precisely what has been counted, measured or predicted and whether the answer follows from assumptions.
The misconception. The learner counts gridlines or assumes the visual height directly gives the number of people. A number produced by a valid algorithm can be the wrong answer if the original relationship was misunderstood.
Repair and independent transfer. Read title, axis units, tick intervals and legend aloud before comparing. Recreate a table of values from the graph as a check. Retest with changed inputs or a revised question without showing the worked solution. The learner should choose the representation independently.
20. Mean and median describe different aspects of a dataset
Model concept. Arithmetic mean is the sum divided by the number of observations; median is the middle ordered value. Outliers can change the mean more dramatically, so neither measure alone explains a whole distribution.
Original worked example or verified distinction. Hypothetical counts 4,5,5,6,20 have mean 40/5=8 and median five. The single value twenty pulls the mean upwards, but cannot by itself explain why that time window was different. After the calculation, state precisely what has been counted, measured or predicted and whether the answer follows from assumptions.
The misconception. A student removes the unusual value without explanation or concludes eight was a typical observed count. A number produced by a valid algorithm can be the wrong answer if the original relationship was misunderstood.
Repair and independent transfer. Draw a dot plot, report both centre measures and investigate data quality before removing observations. Retest with changed inputs or a revised question without showing the worked solution. The learner should choose the representation independently.
21. Correlation does not establish a causal story
Model concept. Two quantities may rise together because of a common cause, coincidence or a genuine relationship; a positive correlation alone does not establish direction or a causal mechanism. Models should distinguish prediction from intervention.
Original worked example or verified distinction. In a hypothetical sample, warm afternoons have both greater park visitation and higher cold-drink purchases. Temperature could influence both; higher drink sales alone do not prove that buying drinks causes more park visits. After the calculation, state precisely what has been counted, measured or predicted and whether the answer follows from assumptions.
The misconception. A pupil uses a scatterplot to assert a causal explanation beyond the evidence. A number produced by a valid algorithm can be the wrong answer if the original relationship was misunderstood.
Repair and independent transfer. State a plausible third variable and describe what additional study would be needed for a causal claim. Keep numerical association and explanations separate. Retest with changed inputs or a revised question without showing the worked solution. The learner should choose the representation independently.
22. Error bars communicate uncertainty
Model concept. A modelled mean or measurement often comes with uncertainty. Reporting a range clarifies that the measurement or estimate is not infinitely precise. Uncertainty needs a defined method and cannot be added merely for decoration.
Original worked example or verified distinction. Suppose a hypothetical route measurement is 2.0 km with stated uncertainty ±0.1 km. The represented interval is 1.9 to 2.1 km. This is not a guarantee that every future route configuration remains within it. After the calculation, state precisely what has been counted, measured or predicted and whether the answer follows from assumptions.
The misconception. A student treats the uncertainty as extra distance added only to the upper end, or compares the central values without noting overlapping ranges. A number produced by a valid algorithm can be the wrong answer if the original relationship was misunderstood.
Repair and independent transfer. Draw the interval on a number line and explain what the uncertainty describes before making a decision. Retest with changed inputs or a revised question without showing the worked solution. The learner should choose the representation independently.
23. Sensitivity analysis tests what assumptions matter most
Model concept. Rather than hiding uncertainty, a modeller can change one assumption at a time and observe how the conclusion responds. A decision is more robust when plausible input changes do not reverse it.
Original worked example or verified distinction. A fictional room has fixed cost S$100 and variable cost S$5 per person. At twenty participants total cost is S$200. If variable cost rises to S$7, total becomes S$240, a S$40 difference; if attendance drops to eighteen under the original rate, cost becomes S$190. After the calculation, state precisely what has been counted, measured or predicted and whether the answer follows from assumptions.
The misconception. A learner changes both inputs simultaneously but cannot tell which change caused the result. A number produced by a valid algorithm can be the wrong answer if the original relationship was misunderstood.
Repair and independent transfer. Compare one-input-at-a-time scenarios in a compact table and identify the parameter with the largest modelled effect. Retest with changed inputs or a revised question without showing the worked solution. The learner should choose the representation independently.
24. Optimization needs a valid domain
Model concept. An algebraic maximum or minimum may be outside the permitted range for a real decision. The domain includes practical constraints such as whole-person counts or nonnegative lengths.
Original worked example or verified distinction. A fictional rectangle has sides x and 10−x metres, with 0≤x≤10. Area is 10x−x² and reaches its maximum 25 m² at x=5. Negative x cannot represent a valid side. After the calculation, state precisely what has been counted, measured or predicted and whether the answer follows from assumptions.
The misconception. A student differentiates an expression correctly and accepts a negative length without checking the original interpretation. A number produced by a valid algorithm can be the wrong answer if the original relationship was misunderstood.
Repair and independent transfer. State variable, units and allowed range before calculus; evaluate stationary points and endpoints as needed. Retest with changed inputs or a revised question without showing the worked solution. The learner should choose the representation independently.
25. Modelling with linear regression has limits
Model concept. A fitted line can summarise observed relations and provide conditional predictions, but coefficients are estimates and extrapolation outside the observed range may be unreliable. Residuals indicate where the model and data disagree.
Original worked example or verified distinction. Three synthetic observations (0,1),(1,3),(2,5) are matched by y=2x+1. It predicts seven at x=3, but a new observed value twenty there would expose a large residual and potential model inadequacy. After the calculation, state precisely what has been counted, measured or predicted and whether the answer follows from assumptions.
The misconception. A pupil assumes perfect fit on the first three observations proves all future outputs follow the same rule. A number produced by a valid algorithm can be the wrong answer if the original relationship was misunderstood.
Repair and independent transfer. Keep training observations separate from an independent check and investigate residuals, scale and assumptions before asserting generality. Retest with changed inputs or a revised question without showing the worked solution. The learner should choose the representation independently.
26. Models can be implemented in spreadsheets or code
Model concept. Calculators, tables and Python can automate arithmetic, but they do not establish that the chosen relationships are true. Data entry, units and source definitions require human or programmatic validation.
Original worked example or verified distinction. A spreadsheet models cost as 80+6n. At n=15 it returns 170. Before filling 100 rows, check this small case by hand and verify that changing n by one increases the output by six. After the calculation, state precisely what has been counted, measured or predicted and whether the answer follows from assumptions.
The misconception. A formula copied with an incorrect absolute reference might keep a visually neat sheet while producing invalid values. A number produced by a valid algorithm can be the wrong answer if the original relationship was misunderstood.
Repair and independent transfer. Write an expected-output example, compare it with tool results, document formula cells and retest after modifying the model. Retest with changed inputs or a revised question without showing the worked solution. The learner should choose the representation independently.
27. A Primary pupil can model with drawings and objects
Model concept. Mathematical modelling need not start with algebra. Children can use blocks, bars, simple charts and measurements to show quantities and their relationships. The abstraction is increased only when the foundational representation is secure.
Original worked example or verified distinction. A Primary 2 learner arranges three groups of four counters to model twelve chairs in equal rows. A drawing, repeated addition and the number sentence 3×4=12 all express the same relationship. After the calculation, state precisely what has been counted, measured or predicted and whether the answer follows from assumptions.
The misconception. A child copies the multiplication sentence without showing which number is groups and which is chairs per group. A number produced by a valid algorithm can be the wrong answer if the original relationship was misunderstood.
Repair and independent transfer. Change from three rows of four to four rows of three and ask what changes in the story even though the total stays twelve. Retest with changed inputs or a revised question without showing the worked solution. The learner should choose the representation independently.
28. Secondary learners should state assumptions before equations
Model concept. A Secondary Mathematics model may use functions, ratios, gradients and geometric properties. It becomes powerful when symbols are defined and units and constraints are visible.
Original worked example or verified distinction. A club’s cost is C(n)=50+4n dollars for n members. C(12)=98 and the coefficient four has the meaning dollars per added member. The domain consists of nonnegative whole numbers. After the calculation, state precisely what has been counted, measured or predicted and whether the answer follows from assumptions.
The misconception. A pupil reports n=12.5 members after solving a boundary and does not round to a feasible integer under the inequality. A number produced by a valid algorithm can be the wrong answer if the original relationship was misunderstood.
Repair and independent transfer. Define every variable and domain first, solve the symbolic relation, then interpret the result back in the original wording. Retest with changed inputs or a revised question without showing the worked solution. The learner should choose the representation independently.
29. University models need validation beyond the calculation
Model concept. At university, modelling can involve sampling, multivariable functions, simulations and uncertainty. A correct derivative or fitted coefficient is not proof that the real system satisfies the simplifying assumptions.
Original worked example or verified distinction. A synthetic population model grows by a fixed factor of 1.1 each year. If starting quantity is one hundred, after two years it predicts 121, but the forecast relies on growth remaining exactly ten percent each year. After the calculation, state precisely what has been counted, measured or predicted and whether the answer follows from assumptions.
The misconception. Students may report the prediction as observed fact or extend the formula indefinitely without recognising changing conditions. A number produced by a valid algorithm can be the wrong answer if the original relationship was misunderstood.
Repair and independent transfer. State source, parameter estimation, assumptions, validation dataset and uncertainty. Compare forecast with new observations before revising the model. Retest with changed inputs or a revised question without showing the worked solution. The learner should choose the representation independently.
30. An eight-week local mathematics investigation
Model concept. A school project can study an accessible everyday question while using publicly appropriate or synthetic data. Good design starts with a narrow question, clear units and manageable observations. It finishes by reflecting on what could change the model.
Original worked example or verified distinction. An eight-week plan uses week one to define a question, week two to design data collection, weeks three and four to gather values, week five to model them, week six to interpret, week seven to check assumptions and week eight to report limitations. After the calculation, state precisely what has been counted, measured or predicted and whether the answer follows from assumptions.
The misconception. A student begins with a complex chart before establishing what was measured and discovers later that records are inconsistent or sensitive. A number produced by a valid algorithm can be the wrong answer if the original relationship was misunderstood.
Repair and independent transfer. Keep a simple workbook of questions, units, datasets, calculations and limitations. Use synthetic data when personal observations should not be shared. Retest with changed inputs or a revised question without showing the worked solution. The learner should choose the representation independently.
Three substantial Punggol modelling case studies
Case 1 — a waterway distance comparison done carefully
An article or map may display the 4.2 km Punggol landscaped waterway described by HDB and the 8.4 km Waterway park-connector route published by NParks. A student should not conclude that one source measured badly; they describe different things. To model a hypothetical exercise route, decide exactly what is being traversed, identify official access and route geometry, and avoid converting the channel length into an unsupported door-to-door ETA. If an illustrative walk uses 3 km at 4 km/h, the constant-speed duration would be 0.75 hour, or forty-five minutes; real stops, crowds, fitness and weather alter it. This is a classroom model, not a live route estimate.
Case 2 — a school event whose break-even answer is not fractional people
A fictional Mathematics club pays S$110 for a venue and S$5 per attendee for materials. Each attendee pays S$12. Net outcome is N=12n−110−5n=7n−110. The inequality N≥0 requires n≥110/7≈15.71, but n counts whole people, so the smallest feasible count is sixteen. At fifteen, net is −S$5; at sixteen, net is +S$2. A student who reports 15.71 attendees has solved the continuous algebra but not the real-world integer constraint. If the variable charge changes, the threshold must be recalculated; this is sensitivity analysis.
Case 3 — a correct mean that tells an incomplete crowd story
Fictional ten-minute counts of cyclists at a checkpoint are 8,9,10,11,32. The sum is seventy and mean is fourteen cyclists per ten-minute period, while the median is ten. The unusually high thirty-two elevates the mean. It could reflect a group event or sampling inconsistency, but the numbers alone do not identify the cause. Multiplying the mean by six gives an illustrative hourly estimate of eighty-four under a stable sampling-rate assumption; it is not eighty-four actually observed cyclists. A responsible report shows the raw records, intervals, median, assumption, and what further sampling would improve the estimate.
Six-stage modelling project plan for home or classroom
Stage 1 — define an answerable question
Choose a narrow observation or fictional scenario. State what quantity is being estimated and what counts as a valid observation. Avoid personal data unless permitted.
Stage 2 — identify trustworthy data
Use official public figures for real places and label all classroom invented quantities as hypothetical. Record units and source dates, especially where two similar location names refer to different features.
Stage 3 — construct a simple baseline
Draw a table, diagram or equation that captures the required relationship. Hand-check at least one small input and make a rough size estimate.
Stage 4 — solve and interpret
Compute carefully, state units and any domain restrictions, then turn the answer into a full sentence addressing the original question.
Stage 5 — test assumptions
Change one uncertain input at a time and identify whether the result changes meaningfully. Compare a modelled prediction with independently collected observations where appropriate.
Stage 6 — explain the limitations
Finish with what was established, what remains uncertain, which data would improve the result and a changed independent follow-up question.
Frequently asked modelling questions
Is mathematical modelling a separate compulsory primary paper?
No. It is part of MOE’s wider mathematical problem-solving framework; the assessed scope depends on the actual subject and level. Before acting on the result, distinguish verified real-world data from assumptions and hypothetical practice figures.
What are the core steps?
Formulate a representation, solve its mathematical problem, interpret the answer in context and reflect on assumptions and possible improvements. Before acting on the result, distinguish verified real-world data from assumptions and hypothetical practice figures.
Is Punggol Waterway 4.2 or 8.4 kilometres?
HDB describes a 4.2 km landscaped waterway; NParks describes an 8.4 km park-connector route along both sides. They refer to different features. Before acting on the result, distinguish verified real-world data from assumptions and hypothetical practice figures.
Can a student model current park transport without official data?
They can create a clearly hypothetical scenario, but cannot present invented schedules, route lengths, prices or observed crowds as actual current conditions. Before acting on the result, distinguish verified real-world data from assumptions and hypothetical practice figures.
Should Primary students use algebra for every model?
No. Objects, drawings, bars and simple tables often express the relationship more clearly. Algebra can follow once meaning is secure. Before acting on the result, distinguish verified real-world data from assumptions and hypothetical practice figures.
What is the difference between a modelled estimate and a measurement?
A measurement is an observation under a method. A modelled estimate is calculated from assumptions and input data; it can be checked against observations. Before acting on the result, distinguish verified real-world data from assumptions and hypothetical practice figures.
Why are units so important?
They identify what the output means and reveal invalid combinations, such as dividing kilometres by metres per second without conversion. Before acting on the result, distinguish verified real-world data from assumptions and hypothetical practice figures.
Can a graph prove cause and effect?
No. A graph may show association but causal conclusions require additional evidence and assumptions. Before acting on the result, distinguish verified real-world data from assumptions and hypothetical practice figures.
What is the first thing to do with a difficult word problem?
Name the requested unknown, identify relevant quantities and choose a representation before doing arithmetic. Before acting on the result, distinguish verified real-world data from assumptions and hypothetical practice figures.
Can a calculator fix a flawed modelling assumption?
No. It only computes from the supplied formulas and inputs, which may be conceptually incorrect. Before acting on the result, distinguish verified real-world data from assumptions and hypothetical practice figures.
Why do school topics reappear at university?
Fractions, functions, geometry, data and algebra provide the foundations for more sophisticated mathematical models, proof and computational analysis. Before acting on the result, distinguish verified real-world data from assumptions and hypothetical practice figures.
How should parents measure improvement?
Compare original work with a changed independent question and ask whether the student can explain the model, units and checking method. Before acting on the result, distinguish verified real-world data from assumptions and hypothetical practice figures.
Should students use personal location data for a project?
Only with appropriate consent and privacy safeguards. Synthetic or public aggregate data can teach the mathematical concept without exposing private routines. Before acting on the result, distinguish verified real-world data from assumptions and hypothetical practice figures.
Official Mathematics framework and Punggol sources
These official links support the curriculum and verified geography. All sample budgets, flow rates, attendance and other teaching figures are explicitly invented for the problem-solving illustrations.
- MOE Primary Mathematics syllabus updated October 2025
- HDB Punggol Town Design Guide and waterway description
- NParks Punggol Waterway Park Connector route
- NParks Punggol Waterway Park nature walk
- URA North-East 26 km Riverine Loop context
- SEAB 2027 SEC Mathematics subject-level syllabuses
- Immutable Clementi Mathematics foundation
Related Punggol Mathematics education guides
- P1–6 Maths national route
- Olympiads, enrichment and proof
- Data Science, statistics and AI Mathematics
- Financial Mathematics and budgeting
The strongest mathematical modeller can explain what is real, what was simplified, how the calculation was performed and how a future observation might prove the model inadequate. That skill grows from Primary counters to university statistics and engineering.


