
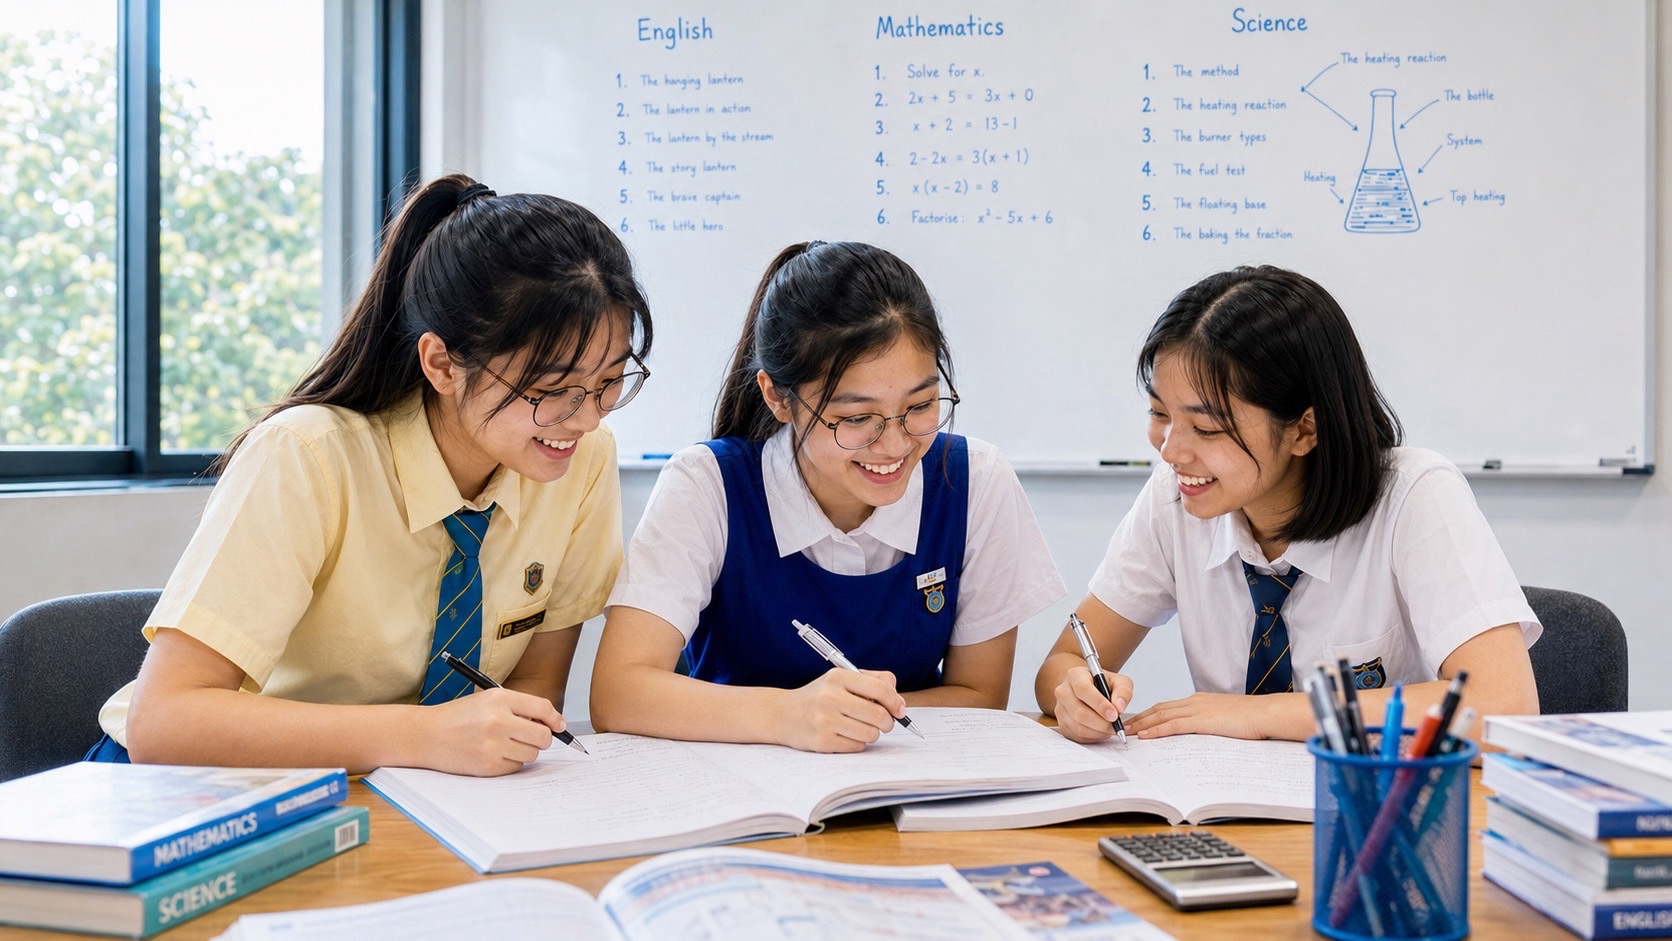
Secondary 2 Mathematics tuition in Punggol for students learning to read and construct pie charts and bar charts where these representations appear in their school Mathematics programme.
The difficult part is not drawing coloured sectors or bars. It is keeping frequency, fraction, percentage and angle connected to the same dataset.
At eduKate Punggol, our premium 3-pax tutorials teach students to move between these representations deliberately rather than memorise separate chart procedures.
This guide supports our main Punggol Secondary 2 Mathematics Tutor hub and our broader data, statistics, graphs and probability guide.
Class size is limited to three students. Lessons are normally around 90 minutes weekly, with worked examples, data interpretation, chart construction and school-paper alignment.
Arrange a parent–student consultation with eduKate Singapore
Chat with eduKateSG on WhatsApp
Visit the eduKateSG Facebook page
Bar Charts and Pie Charts Show Data Differently
A bar chart compares categories using bar heights or lengths. A pie chart divides one whole into sectors.
The whole pie represents 360° and 100% of the data.
The two charts may describe the same dataset, but they emphasise different visual relationships.
Worked Example 1: Frequency to Pie-Chart Angle
A class survey records 12 students choosing football, 8 basketball, 6 badminton and 4 swimming.
Total = 12 + 8 + 6 + 4 = 30 students.
Football sector angle = 12/30 × 360° = 144°.
Basketball = 8/30 × 360° = 96°.
Badminton = 6/30 × 360° = 72°.
Swimming = 4/30 × 360° = 48°.
Check: 144 + 96 + 72 + 48 = 360°.
Worked Example 2: Percentage to Sector Angle
Suppose 35% of respondents choose option A.
Sector angle = 35% of 360° = 0.35 × 360° = 126°.
The percentage and the angle are two ways of describing the same share of the whole.
Worked Example 3: Sector Angle Back to Frequency
A pie chart represents 80 students. One sector is 135°.
Fraction of whole = 135/360 = 3/8.
Frequency = 3/8 × 80 = 30 students.
The chart angle is not the frequency itself. It must first be interpreted as a proportion of 360°.
Bar Charts Need a Scale Check Before Reading
A bar height of 6 grid squares does not necessarily mean frequency 6.
If each grid interval represents 5 people, six intervals represent 30 people.
Students should read the vertical-axis scale before comparing bars.
Worked Example 4: Read a Bar Chart Scale
Suppose a bar chart axis is marked 0, 10, 20, 30, 40 with one smaller grid line halfway between each labelled mark.
Each small interval represents 5.
A bar ending on the grid line between 20 and 30 represents 25.
This is why scale reading belongs before calculation.
Constructing a Pie Chart Requires a Complete Check
After calculating sector angles, the angles should total 360°.
If they do not, at least one frequency, fraction or rounding step needs review.
Where angles are not whole numbers, follow the school’s expected accuracy and avoid premature rounding that makes the total drift unnecessarily.
Comparing Categories: Frequency and Percentage Answer Different Questions
A category can have the same frequency in two groups but a different percentage if the group totals differ.
For example, 10 students out of 20 is 50%, while 10 students out of 40 is 25%.
When comparing groups of different sizes, percentage can sometimes be more informative than raw frequency.
Five Common Chart Errors
- using category frequency directly as a pie-chart angle;
- forgetting the total frequency before converting to a percentage or angle;
- misreading the bar-chart scale;
- rounding sector angles so early that the final total becomes inconsistent;
- comparing raw frequencies across groups without noticing different group sizes.
Why a 3-Pax Class Helps
One student may understand percentages but misread the axis scale. Another may calculate sector angles correctly and draw them inaccurately. A third may read both charts correctly but make a weak comparison statement.
In a three-student class, the tutor can see whether the issue is data, proportion, construction or interpretation.
An Illustrative 90-Minute Lesson
- Retrieve fractions and percentages of a whole.
- Read a bar-chart scale.
- Convert frequency to percentage.
- Convert frequency to sector angle.
- Construct a small pie chart.
- Reverse one sector angle back to frequency.
- Finish with a comparison question using two representations.
Try Four Questions
- A category contains 15 of 60 students. What percentage is this?
- What pie-chart angle represents 25%?
- A 90° sector represents 12 students. How many students are represented by the whole pie?
- A bar chart uses 2 units per grid interval. A bar is 7 intervals high. What value does it represent?
Answers: (1) 25%. (2) 90°. (3) 48 students. (4) 14.
What Progress Should Look Like
- The total frequency is found before percentage or angle conversion.
- 360° and 100% are treated as the same whole.
- Bar-chart scales are read accurately.
- Sector angles are checked against 360°.
- Percentages and frequencies are compared appropriately.
- The student can translate the same dataset between table, bar chart and pie chart.
Full Subject-Based Banding and School Scope
Students may take Mathematics at G1, G2 or G3 subject levels, and schools may sequence statistical representations differently.
Use the student’s actual school programme to decide which chart forms are current. The durable habit is to preserve the relationship between frequency, fraction, percentage and angle.
Class Details
Format: Premium 3-pax small-group tutorials
Level: Secondary 2 Mathematics
Duration: normally around 90 minutes weekly
Location: 83 Punggol Central, Singapore 828761
Teaching approach: data reading, proportion, chart scales, construction, interpretation, guided and independent practice and school-paper alignment.
When Tuition May Not Be Necessary
If your child is already learning independently, retaining earlier work and performing consistently, extra tuition may not be necessary. Tuition is most useful when it solves a visible bottleneck.
What Parents Can Bring to the Consultation
- recent statistics worksheets;
- a marked school paper;
- pie-chart angle calculations;
- bar-chart scale questions;
- the school’s current topic sequence.
Frequently Asked Questions
Why does a pie chart use 360°?
A complete circle contains 360°, so each sector angle represents the same fraction of 360° as the category represents of the total data.
Should students compare frequencies or percentages?
It depends on the question. Percentages can be more useful when the total group sizes differ.
Why check all sector angles add to 360°?
Because the sectors together represent the whole dataset.
Can a bar chart start above zero?
Some charts can use truncated axes, but students should read the scale carefully because visual differences can look exaggerated. Follow the school question exactly.
Helpful Reading for Punggol Parents
- Punggol Secondary 2 Mathematics Tutor
- Data, Statistics, Graphs and Probability
- Mean and Frequency Tables
- Scatter Graphs and Correlation
- Punggol Mathematics Article Index
Arrange a Parent–Student Consultation
Bring the chart question that caused difficulty. We can usually see whether the weak link is proportion, scale reading, construction or interpretation.
Properly taught kids shine a bright light into the future.


