
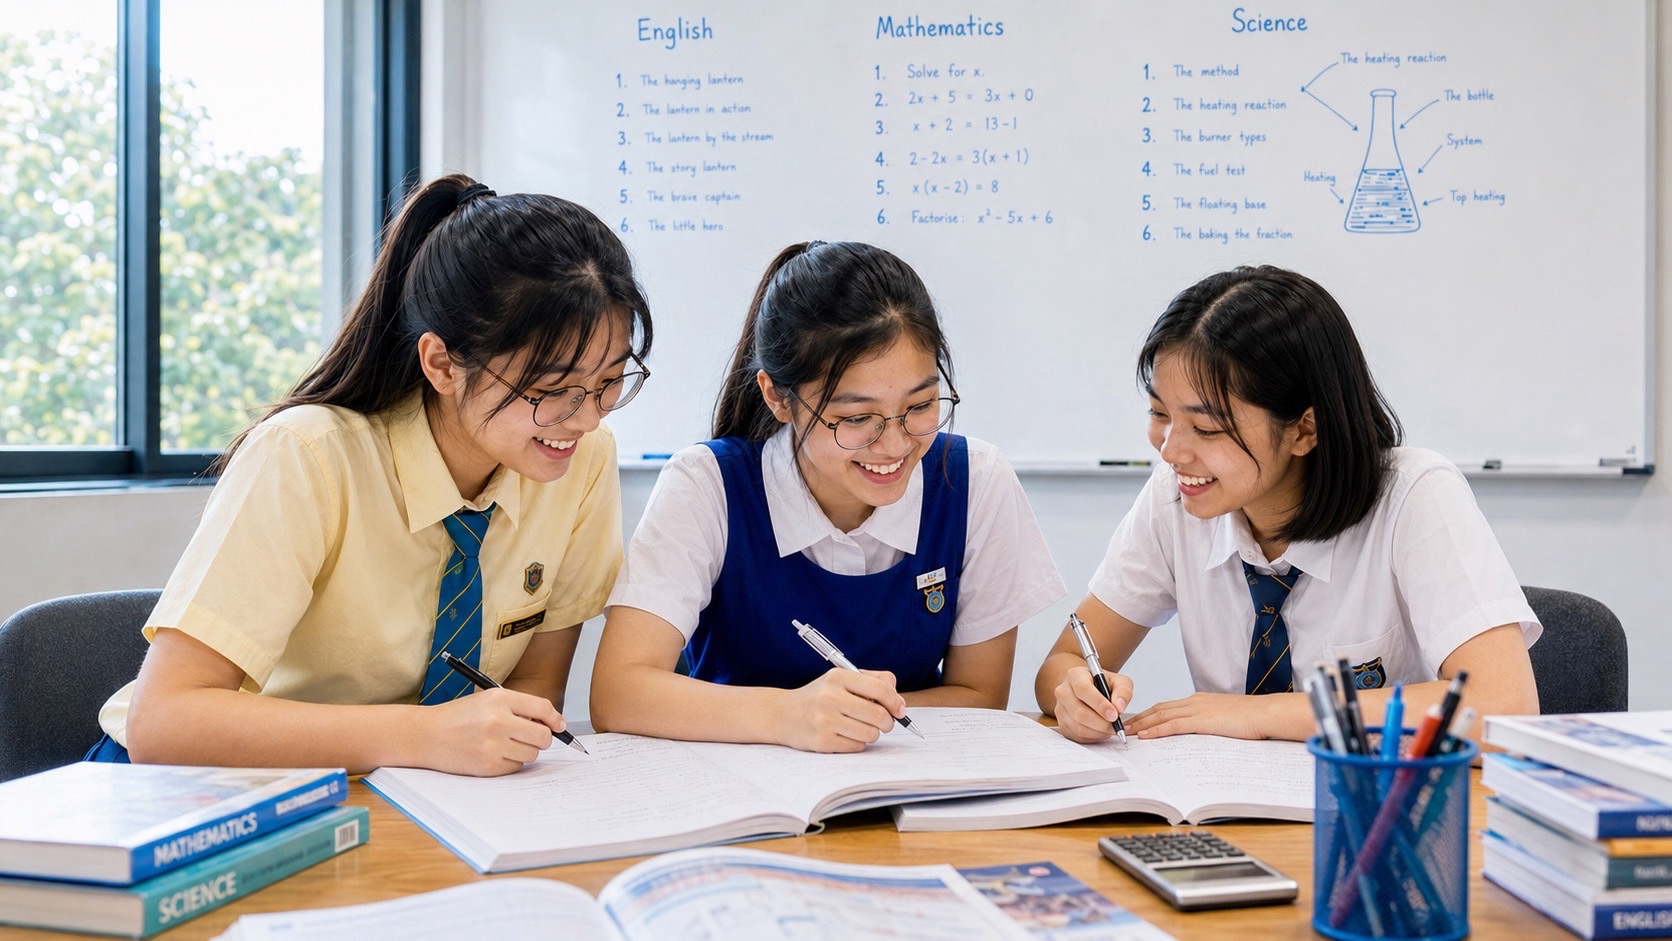
Secondary 2 Mathematics tuition in Punggol for students who lose marks not because they cannot draw a line, but because they misread scales, intercepts, coordinates or what the graph is actually saying.
Graph questions are often lost in the first few seconds.
The student assumes each grid square means one unit, swaps coordinates, reads the wrong axis or identifies an intercept without connecting it to the original situation.
At eduKate Punggol, our premium 3-pax tutorials make that reading process visible before the calculation begins.
This article sits underneath the broader Linear Graphs, Gradient and Coordinates guide and supports the main Punggol Secondary 2 Mathematics Tutor hub.
Class size is limited to three students. Lessons are about 1.5 hours weekly, with direct tutor observation, guided practice, mixed questions and support around school assessments.
Arrange a parent–student consultation with eduKate Singapore
Chat with eduKateSG on WhatsApp
Visit the eduKateSG Facebook page
The First Graph Skill Is Reading, Not Plotting
Students often think graph work begins when the pencil touches the grid.
It begins earlier.
- What quantity is on the horizontal axis?
- What quantity is on the vertical axis?
- What are the units?
- What does each interval represent?
- Does the axis begin at zero?
- Which points are exact and which require estimation?
A student who skips these questions can perform perfect algebra and still read the graph incorrectly.
Scale Errors Are Small on the Page and Large in the Score
One of the simplest graph traps is a changing scale.
A learner who assumes every grid line increases by one may turn a correct point into the wrong coordinate before any real Mathematics begins.
We train a fixed routine: read two labelled values, count the intervals between them, determine the value of one interval, and only then read the point.
This takes seconds and protects the rest of the solution.
Coordinates Are Ordered for a Reason
The point (3, 5) does not mean the same thing as (5, 3).
Students should read coordinates as horizontal movement first, vertical movement second.
In an applied graph, that order also carries meaning. A point may represent 3 hours and 5 kilometres, or 3 items and $5, depending on the axes.
We repeatedly ask the learner to translate a point into a sentence. That makes the coordinate meaningful rather than decorative.
An Intercept Is More Than Where a Line Crosses an Axis
Students can often identify a y-intercept visually without understanding why it matters.
In a real context, the y-intercept may represent:
- a starting fee;
- an initial distance;
- a quantity present before any change;
- a fixed component in a linear relationship.
The x-intercept can similarly represent when a quantity becomes zero or when a condition is met.
Interpretation turns a graph feature into Mathematics.
Use the Equation to Check the Graph
Graph reading should not be isolated from algebra.
If an equation describes the line, the student can use it to check a coordinate or predict the intercept.
If the graph rises while the algebra suggests a negative gradient, something is wrong.
If a point appears inconsistent with the equation, the student has a reason to recheck the scale or plotting.
This two-way checking habit is powerful because one representation can audit the other.
Use the Graph to Check the Equation
The reverse is equally useful.
A graph can expose whether an algebraic answer is plausible.
If two lines are supposed to intersect at a certain point, the graph gives a visual check. If a relationship should be increasing but the calculated gradient is negative, the representation has caught a mistake.
This is why we want students to move between equation, table and graph rather than treating each as a separate chapter.
Five Common Secondary 2 Graph-Reading Errors
1. The scale is assumed
The student reads grid squares instead of values.
2. x and y are reversed
The coordinate is read in the wrong order.
3. The intercept is named but not interpreted
The child sees the point but cannot explain what it means.
4. A steep line is confused with a high starting value
Gradient and intercept are mixed conceptually.
5. A visual estimate is treated as exact
The learner gives unnecessary precision or ignores that the graph only supports an approximate reading.
Why a 3-Pax Class Helps
Graph errors often happen before the final written answer.
A tutor needs to see how the student approaches the axes, scale and key points.
In a class of three, each student can be asked to read the same graph aloud. Their differences become immediately visible.
- One student notices the scale.
- One notices the intercept.
- One notices that the units have changed.
The tutor can build those observations into one complete reading routine while correcting each student’s individual blind spot.
A 1.5-Hour Graph Accuracy Lesson
- Short coordinate and scale retrieval.
- Read a graph without doing any calculation.
- Translate selected points into sentences.
- Identify intercepts and explain their meaning.
- Calculate or interpret gradient.
- Use an equation to verify a point.
- Change the scale while preserving the same relationship.
- Finish with a mixed application where the student must choose between graph, table and equation.
The final goal is not prettier graph paper.
It is stronger mathematical reading.
How to Train Accuracy Without Making Graph Work Slow
The reading routine becomes faster with repetition.
Students do not need to write a paragraph before every graph. They need a short internal checklist that becomes automatic:
- axes;
- units;
- scale;
- key points;
- relationship;
- reasonableness.
Once these checks are habitual, they usually save time because the student avoids repairing misread values later.
Move From Reading to Transfer
After scale and coordinate control are stable, the graph should appear in less predictable forms.
- a table must be converted into a graph;
- an equation must be matched to a line;
- a context must be interpreted from gradient and intercept;
- two graphs must be compared;
- a missing value must be estimated visually and checked algebraically.
This connects directly to our Secondary 2 transfer guide for unfamiliar questions.
What Progress Should Look Like
- The student checks the scale before reading values.
- Coordinates are read in the correct order.
- Intercepts are explained in context.
- Gradient is distinguished from starting value.
- Graph estimates are labelled appropriately.
- The learner uses algebra to verify graphical information.
- Changed graph formats cause less hesitation.
- School-test graph errors become less repetitive.
Secondary 2 Mathematics Under Full Subject-Based Banding
Students may take Mathematics at G1, G2 or G3 subject levels.
The graph-reading routines remain useful across subject levels, while the depth and complexity of the questions are matched to the learner’s actual course and school sequence.
When Should Parents Pay Attention?
- The child draws graphs neatly but loses interpretation marks.
- Scale errors repeat across several papers.
- The student confuses gradient with intercept.
- Coordinates are often reversed.
- Graph questions are skipped even when the underlying algebra is familiar.
- The learner cannot explain what a point means in the original context.
These are signs that the problem is not “drawing graphs”. It is reading mathematical representations.
Class Details
Format: Premium 3-pax small-group tutorials
Level: Secondary 2 Mathematics
Subject support: matched to the student’s current Mathematics subject level and school programme
Duration: 1.5 hours weekly
Location: 83 Punggol Central, Singapore 828761
Teaching approach:
- first-principles explanation;
- scale and coordinate discipline;
- equation–table–graph connection;
- guided and independent practice;
- representation switching;
- school-paper analysis; and
- carefully paced extension.
What Parents Can Bring to the Consultation
- recent school papers with graph questions;
- marked worksheets;
- examples of scale-reading mistakes;
- teacher comments;
- the school’s current topic sequence;
- questions the student could plot but not interpret.
The actual school work tells us whether the issue is scale, coordinate reading, gradient, intercepts, algebra or transfer.
Frequently Asked Questions
Why does my child keep misreading graph scales?
Because the eye recognises the grid before the brain checks the labels. A fixed scale-reading routine trains the student to reverse that order.
Should every graph begin at zero?
No. Students must check the displayed scale and axis labels rather than assume the origin is shown.
Why is the y-intercept important?
It often represents the value of y when x is zero, which can have a meaningful interpretation such as a starting amount or fixed cost.
Can algebra help with graph accuracy?
Yes. Equations and graphs can check one another. Moving between the two representations is a strong way to detect errors.
What should be stable before Secondary 3?
The student should read scales and coordinates reliably, understand gradient and intercepts, and connect graphs to algebra without needing a worked example beside every question.
Helpful Reading for Punggol Parents
- Punggol Secondary 2 Mathematics Tutor | 3-Student Small-Group Tutorials
- Linear Graphs, Gradient and Coordinates
- Repair Algebra Before Secondary 3
- Train Transfer for Unfamiliar Questions
- Turn School Test Papers Into a Repair Plan
- Punggol Mathematics Article Index
Arrange a Parent–Student Consultation
Bring a few graph questions your child found difficult. We can usually see quickly whether the real bottleneck is scale, coordinates, interpretation, algebra or method selection.
Properly taught kids shine a bright light into the future.


