
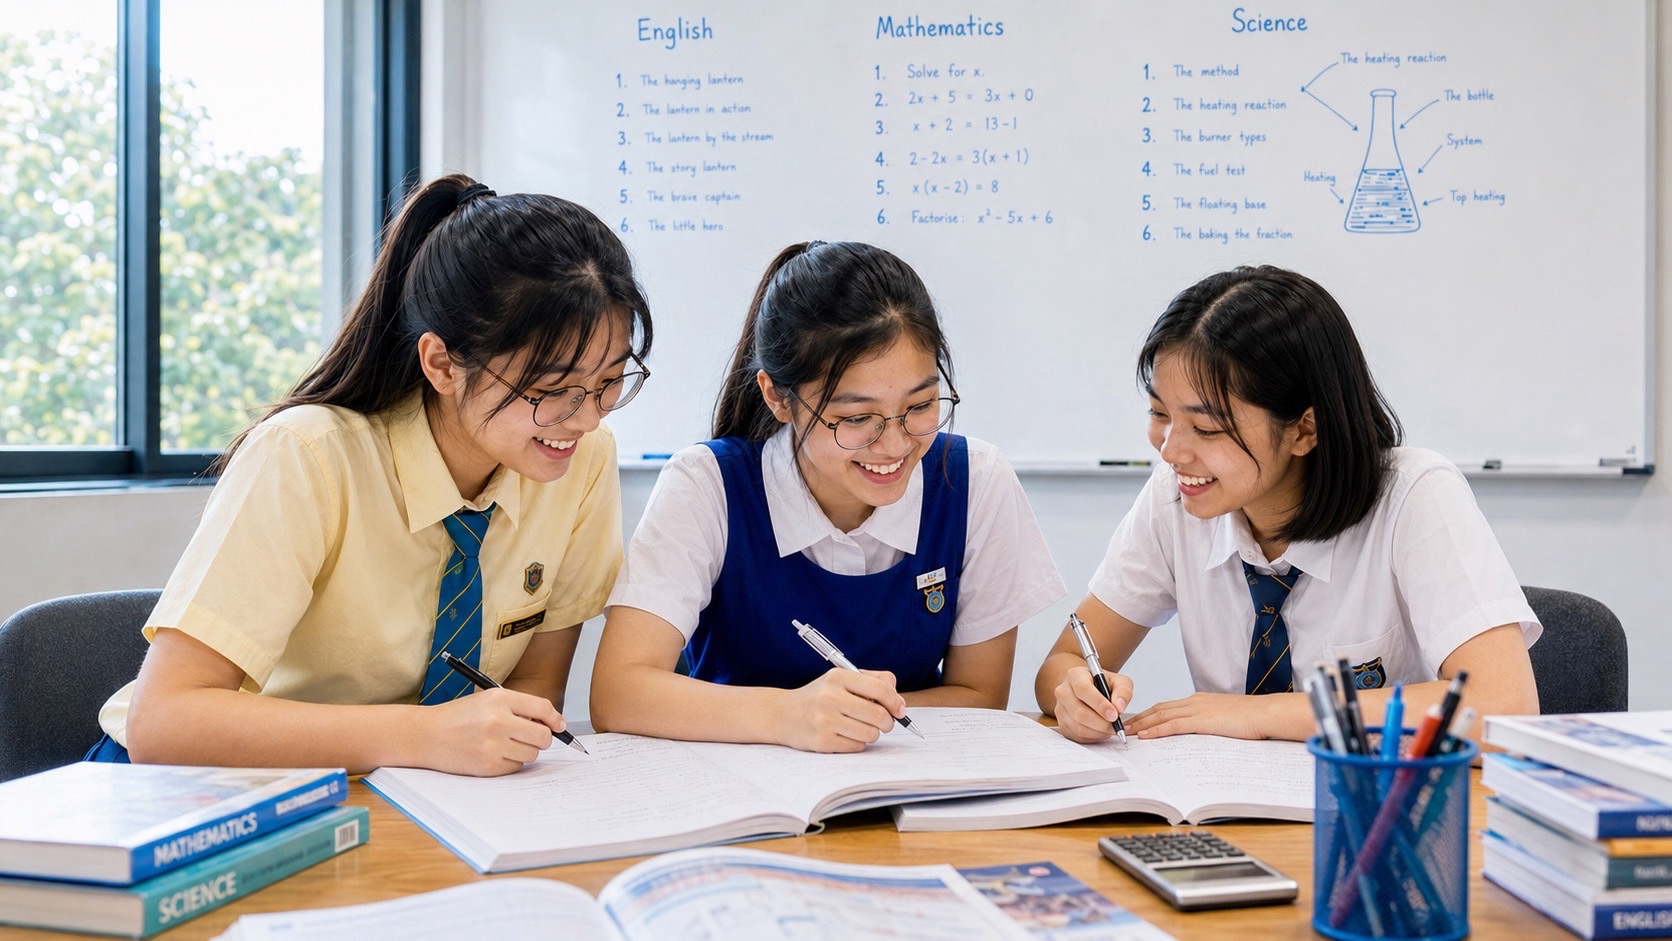
Secondary 2 Mathematics tuition in Punggol for students learning theoretical probability, experimental probability and relative frequency where these ideas appear in their school Mathematics programme.
The key distinction is simple.
Theoretical probability comes from a mathematical model of possible outcomes. Experimental probability comes from observed results.
At eduKate Punggol, our premium 3-pax tutorials make students compare the model with the data instead of treating every probability fraction as the same kind of number.
This guide supports our main Punggol Secondary 2 Mathematics Tutor hub, the Secondary 2 data and probability guide, and the worked guide to probability tree diagrams.
Class size is limited to three students. Lessons are normally around 90 minutes weekly, with sample spaces, experiments, interpretation and school-paper alignment.
Arrange a parent–student consultation with eduKate Singapore
Chat with eduKateSG on WhatsApp
Theoretical Probability Begins With a Model
For equally likely outcomes:
P(event) = number of favourable outcomes ÷ total number of possible outcomes.
The phrase equally likely matters. We should not use this formula blindly when the outcomes have different probabilities.
Worked Example 1: A Fair Die
A fair six-sided die is rolled. Find the probability of rolling a number greater than 4.
The possible outcomes are 1, 2, 3, 4, 5, 6.
Favourable outcomes are 5 and 6.
P(number > 4) = 2/6 = 1/3.
The model says each face is equally likely.
Experimental Probability Comes From Observed Frequency
Experimental probability, also called relative frequency in this context, is:
number of times the event occurred ÷ total number of trials.
It describes what happened in the experiment.
Worked Example 2: Coin Toss Data
A coin is tossed 120 times and lands heads 68 times.
Experimental probability of heads = 68/120 = 17/30 ≈ 0.567.
If the coin is modelled as fair, the theoretical probability of heads is 0.5.
The experimental result does not have to equal 0.5 exactly.
Why Experimental Probability Can Differ From Theory
Random experiments vary.
A fair coin does not promise exactly five heads in every ten tosses.
Over a larger number of independent trials under stable conditions, relative frequency often becomes closer to the underlying probability, but no finite experiment is guaranteed to match it exactly.
This is an important statistical idea: probability predicts long-run behaviour, not a fixed short-run pattern.
Worked Example 3: Estimate Future Frequency
In 200 trials, an event has experimental probability 0.35. If conditions remain reasonably similar, estimate how many times the event might occur in the next 500 trials.
Estimated frequency = 0.35 × 500 = 175.
This is an estimate, not a guarantee. The actual count can differ.
Complements Provide a Fast Check
For any event A:
P(not A) = 1 − P(A).
If the probability of rain is modelled as 0.3, the probability of no rain is 0.7, provided those are the complete complementary outcomes under the model.
Probabilities for a complete set of mutually exclusive outcomes should sum to 1.
Worked Example 4: Use the Complement
A bag contains 5 red, 3 blue and 2 green counters, and one counter is chosen at random.
P(red) = 5/10 = 0.5.
P(not red) = 1 − 0.5 = 0.5.
Direct counting gives the same result: 5 non-red counters out of 10.
Experimental Data Can Reveal a Question About the Model
Suppose a spinner is claimed to have four equal sectors, so the theoretical probability of landing on red is 1/4.
If red appears 8 times in 100 spins, the experimental probability is 0.08, far from 0.25.
That does not automatically prove the spinner is unfair. But it gives a reason to investigate the number of trials, the mechanism and whether the model assumptions are appropriate.
Probability is partly about comparing evidence with a model.
Do Not Treat Relative Frequency as a Certainty
If a basketball player has made 70% of recent free throws, that does not mean the next ten attempts must contain exactly seven successes.
The observed proportion is information about past performance and may be used as an estimate under suitable assumptions. It is not a fixed schedule for future outcomes.
Five Common Probability Errors
- assuming outcomes are equally likely without justification;
- using favourable over total when the sample space is incomplete;
- confusing experimental probability with theoretical probability;
- treating an estimated future frequency as guaranteed;
- giving a probability below 0 or above 1 without noticing the impossibility.
Why a 3-Pax Class Helps
One student may build the sample space wrongly. Another may understand theory but calculate relative frequency incorrectly. A third may do both correctly and overstate what an experiment proves.
In a class of three, the tutor can ask each learner whether the number came from a model, an experiment or an estimate.
An Illustrative 90-Minute Lesson
- Build a simple equally likely sample space.
- Calculate theoretical probability.
- Run or analyse a small experiment.
- Compute relative frequency.
- Compare experimental and theoretical values.
- Use a complement.
- Estimate future frequency and state the uncertainty.
- Finish with one model-versus-data interpretation question.
Try Four Questions
- A fair die is rolled. Find P(even).
- A spinner lands blue 42 times in 120 spins. Find the experimental probability of blue.
- An event has estimated probability 0.18. Estimate its frequency in 600 trials.
- If P(A) = 0.37, find P(not A).
Answers: (1) 3/6 = 1/2. (2) 42/120 = 0.35. (3) 108. (4) 0.63.
What Progress Should Look Like
- The student identifies whether a probability is theoretical or experimental.
- Equally likely assumptions are stated rather than assumed blindly.
- Relative frequency uses the correct trial total.
- Estimated future frequency is described as an estimate.
- Complements are used accurately.
- Probability answers are checked to stay between 0 and 1.
Full Subject-Based Banding and School Scope
Students may take Mathematics at G1, G2 or G3 subject levels, and schools can sequence probability differently.
Use the student’s actual school programme to decide whether relative frequency, tree diagrams or more complex events are current. The central habits are complete sample spaces, correct denominators and careful interpretation.
Class Details
Format: Premium 3-pax small-group tutorials
Level: Secondary 2 Mathematics
Duration: normally around 90 minutes weekly
Location: 83 Punggol Central, Singapore 828761
Teaching approach: sample-space construction, experimental data, relative frequency, interpretation, worked examples, guided and independent practice and school-paper alignment.
What Parents Can Bring to the Consultation
- recent probability worksheets;
- a marked school paper;
- sample-space questions the student found confusing;
- experimental-frequency questions;
- the school’s current topic sequence.
Frequently Asked Questions
Why doesn’t experimental probability equal theoretical probability exactly?
Random variation means finite experiments can differ from the theoretical model. Larger samples often give more stable relative frequencies, but exact equality is not guaranteed.
Can experimental probability predict the future?
It can be used as an estimate when conditions are reasonably stable, but it does not guarantee an exact future count.
Why must probability be between 0 and 1?
Zero represents impossibility and one represents certainty within the model. Values outside that interval cannot represent valid probabilities.
When is tuition useful?
When the student can calculate fractions but repeatedly confuses the sample space, the experimental denominator or what a probability statement actually means.
Helpful Reading and Next Step
Continue with probability tree diagrams, data, statistics, graphs and probability, and mean and frequency tables.
The objective is a student who knows whether a probability came from a model, an experiment or an estimate—and can explain the difference. Discuss your child’s current Mathematics work with eduKate Punggol.


