
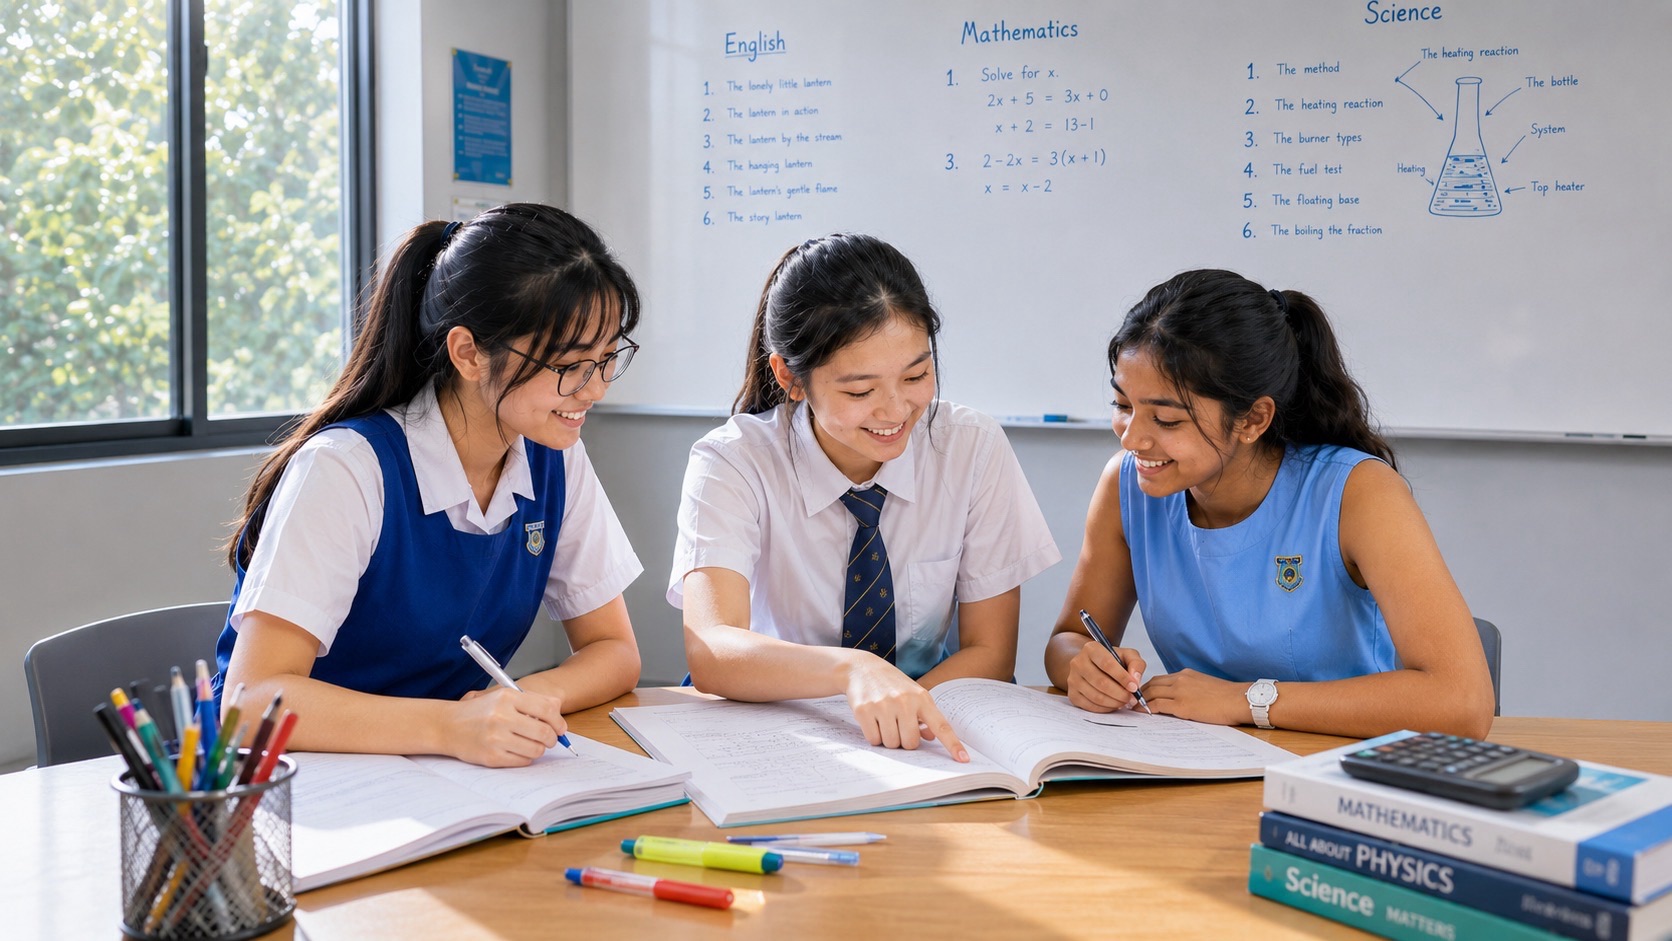
Your child may understand the topic in a textbook but lose marks when an examination question includes a graph, table, diagram, map or unfamiliar visual. They may read the question but overlook a label, confuse the units or describe a pattern without explaining what it means. Parents sometimes respond by asking for more content revision, even though the difficulty may be interpreting information.
Visual and data-based questions require students to read the information accurately, identify relationships and connect the evidence to the relevant subject knowledge. Practise these steps with the actual types of visuals used in the child’s subjects. Do not assume that looking at more diagrams is enough; the child should explain what the information shows and how it supports an answer.
- Read the title, labels, axes, keys, units and captions before interpreting a visual.
- Identify what information is given and what the question asks.
- Describe a trend or relationship accurately before explaining it.
- Use evidence from the graph, table or diagram to support the response.
- Connect the evidence to the relevant scientific, mathematical or humanities concept.
- Check that the conclusion does not go beyond what the data can show.
This guide is for parents in Punggol and Sengkang supporting students whose assessments include visual or data-based information. The exact skills vary by subject, but careful reading and evidence-based reasoning are broadly useful.
1. Start with the labels before the pattern
Students sometimes jump straight to a conclusion without checking what the visual represents. Teach the child to read the title, axes, categories, units, legend and captions. A graph showing distance over time is not the same as one showing speed over time. A table of percentages cannot be read as though it shows raw numbers.
Ask the child to state what each axis or column represents. This small step can prevent a large misunderstanding.
2. Identify the information the question needs
Not every detail in a diagram or table is relevant to every question. Ask what the instruction requires: identify a value, compare two categories, describe a trend, infer a relationship or explain a result. The child should select evidence that answers the task.
For example, a question may ask for the greatest increase rather than the highest final value. A student who only looks for the largest number may answer incorrectly. Reading the instruction first helps avoid this confusion.
3. Describe what is visible before explaining why
Students often mix observations and explanations. A description states what the graph or table shows. An explanation connects that observation to a concept or cause. Practise these separately, then combine them when the question asks for both.
For Science, the child may first state the observed change and then explain it using the relevant scientific idea. In Geography or Humanities, the student may describe a pattern in a map or data set before explaining possible reasons, using evidence and subject knowledge.
4. Use figures accurately
When a question requires a value, teach the child to read the correct scale and include the appropriate units. If they need to compare two values, check that both are taken from the correct categories or time points. Avoid estimating more precisely than the visual allows.
In Mathematics, the student may need to calculate from information shown. In Science, they may need to interpret measurements or experimental data. The child should show the relevant method where required and check whether the answer is reasonable.
5. Connect the visual to what has been taught
A diagram or data set rarely stands alone. Students need to connect it to subject knowledge. Ask: Which concept does this information relate to? What evidence supports the explanation? Is there another possible interpretation? What can the data show, and what can it not show?
This develops more careful reasoning than memorising a sentence such as “as one increases, the other increases”. The relationship must be supported by the actual information.
6. Practise with different visual formats
Use school materials and suitable practice for graphs, tables, labelled diagrams, maps, flow charts and experimental results. Do not introduce every format at once. Start with one type that appears in the child’s subject and practise the reading routine.
Once the child is comfortable, change the context and the layout. The aim is for the student to apply the same reading principles to a new visual rather than memorise one familiar diagram.
7. Avoid drawing conclusions beyond the evidence
A graph may show that two quantities changed together, but that does not automatically prove that one caused the other. A small data set may suggest a pattern without proving that it always occurs. Teach the child to make claims that are supported by the information and to recognise limits where relevant.
A visual-question routine
- Read the title and identify what the visual represents.
- Check the labels, units, scale and categories.
- Read the question and identify the task.
- Find the relevant data or feature.
- Describe the evidence accurately.
- Explain the evidence using subject knowledge where required.
- Check that the conclusion stays within what the information supports.
Questions parents commonly ask
Should my child memorise common graph descriptions?
Reusable language can help, but the child must interpret the actual data. A memorised phrase may be wrong when the graph shows a different pattern.
What if my child can describe a graph but cannot explain it?
Review the underlying subject concept. The student may know how to read the visual but not understand the principle that explains the pattern.
Can we practise using newspaper charts?
Yes, as supplementary reading, provided the chart is clear and suitable. Check its source, definitions and units, and remember that school assessment questions may use different formats.
Should the child estimate values when the scale is unclear?
Follow the question instructions and read the scale carefully. Do not invent precision that the visual does not support. Ask the teacher how such responses are expected to be handled in the relevant subject.
Further guidance
- Prepare for English, Mathematics and Science Examinations
- Respond to an Unfamiliar Examination Question
- Turn the Exam Syllabus into Clear Study Targets
Prepared for parents in Punggol and Sengkang. Information checked on 21 November 2026. Use examples and assessment requirements that match the child’s current subject and syllabus.
