
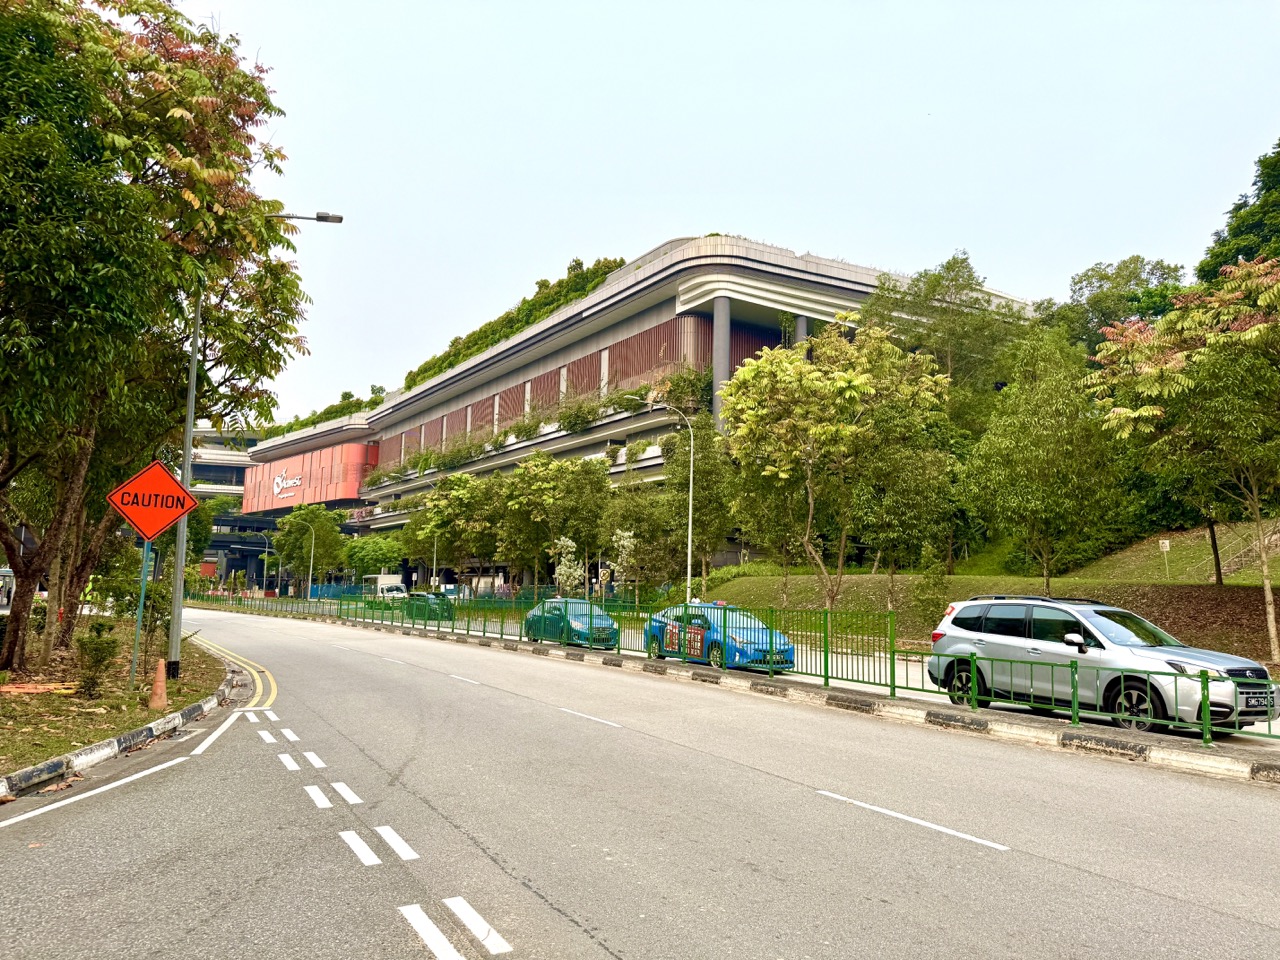
ActiveSG Punggol Sport Centre at 11 Sentul Crescent helps families understand Reliability Engineering, the discipline of making equipment and systems perform their intended function consistently over time under stated conditions. A court light, exercise machine, score display or booking information service may be important to a visitor’s experience, but none should be assumed infallible merely because a venue is new. Reliability engineers ask how a failure is defined, how frequently it might occur, how faults are detected, what maintenance is appropriate and whether a backup can reduce a loss of service. The centre began selected operations on 27 October 2026, with its formal opening planned for 22 November 2026. No current equipment fault, failure rate or inspection result at Punggol is alleged here. Use SportSG’s official closure information and MyActiveSG+ for real operating conditions.
The US National Institute of Standards and Technology’s Engineering Statistics Handbook explains reliability functions, failure rates, repairable systems, redundancy, maintenance and lifetime models. Its bathtub-curve lesson describes a familiar pattern of early, approximately constant and wear-out failure rates in some product populations, while its parallel reliability model shows how redundancy can help under specific independence assumptions. These are engineering concepts, not measured statistics for the Punggol Sport Centre. Students should distinguish reliability from availability, recognise the difference between a component that can be repaired and a one-time item, and avoid mistaking a probability model for a promise of zero incidents. This guide uses transparent fictional numerical models, preventive-maintenance reasoning, public safety boundaries and a four-week learning plan.
- Setting: ActiveSG Punggol Sport Centre, 11 Sentul Crescent; no facility reliability audit was conducted.
- Reliability: probability of performing the defined required function for a duration under specified conditions.
- Failure: a defined loss of required function, not simply dissatisfaction with an unrelated feature.
- Availability: proportion or probability of being operational when needed under the chosen definition.
- Maintainability: ability to restore or maintain required function through appropriate procedures.
- Failure rate: a quantity whose interpretation depends on the lifetime model and population.
- MTBF: mean time between failures under a relevant repairable-system model; not a warranty.
- MTTR: an average time related to restoration, defined carefully in the chosen context.
- Series and parallel models: reliability changes according to how component failures affect the whole system.
- Preventive maintenance: inspections and interventions should follow manufacturer and professional requirements, not arbitrary visitor adjustments.
- Safety boundary: no equipment stress tests, maintenance-room access, resets of public systems or unapproved fault injections.
- Learning: NIST concepts, worked examples, fictional failure modes, common errors, FAQ and a four-week programme.
Definition lock: reliability needs a function and a time
Reliability concerns a system meeting a stated requirement for a specified duration and environment. Saying a sports machine is “reliable” without defining the task, period or conditions is vague. A light might be required to illuminate a particular area within approved parameters, while a scoreboard might be required to display correct information when authorised. These are distinct functions and failure definitions. A student should start by writing what success means before calculating a percentage. Reliability does not imply that every component will last forever. Real assessment relies on appropriately collected data and qualified engineering judgement.
Why this differs from Materials Science
Materials Science investigates how composition and structure affect strength, fatigue, toughness and other properties. Reliability Engineering asks whether an entire component or system continues to meet its required function over time under defined conditions. Material fatigue can contribute to equipment failure, but a system may also fail because of software, sensor faults, power supply or maintenance errors. A strong material does not guarantee a reliable product, and a system can have backup components that maintain service even when one part fails. This article therefore focuses on failure probabilities, service availability and the design of dependable systems rather than comparing composite racket ingredients.
Why this differs from Project Management
Project Management plans a finite deliverable through tasks, milestones, responsibilities and risks. Reliability Engineering studies functioning and failure over use, often across long operating lifetimes and repeated maintenance cycles. A project can finish on schedule yet deliver an unreliable product. Conversely, a reliable piece of equipment may require carefully planned maintenance, which becomes part of operational management. Students should not equate completing a checklist with proving reliability. The result depends on the defined function and suitable evidence. This is a separate technical topic from how a school group organises a one-page sports information project.

Start by defining the failure mode
A failure mode describes how an item could cease to meet a required function. For an invented electronic display, “screen shows no information” and “screen shows incorrect information” are two different modes. Their causes and consequences may differ. A sports light failing to illuminate is not identical to the entire building losing power. Students should avoid diagnosing an actual Punggol device without evidence. Use clearly labelled fictional cases and ask what a user observes, what the required function was and which professionals would need to investigate. Precise failure definitions support meaningful measurement and safer response.
Failure is not always total destruction
A component may remain physically intact yet not meet its specified accuracy, output or safety requirement. A timer reading the wrong interval could be functionally failed even though its screen lights up. A racket may look attractive yet be unsuitable after structural damage. Students should distinguish appearance from required performance. A product may also function partly but outside acceptable tolerances. Reliability work needs an explicit criterion for success. Without a defined threshold, counting failures becomes arbitrary. No visitor should intentionally use questionable equipment until it breaks merely to decide which technical condition applies.
Define operating conditions before comparing devices
Temperature, humidity, load, duration and maintenance influence how an item performs. Comparing two pieces of equipment without describing these conditions may produce misleading conclusions. A hypothetical battery device used outdoors in heavy rain has a different exposure from one used within a suitable dry indoor environment. Students should avoid claiming that the Sport Centre’s real equipment experiences a particular hazard unless supported by data. A reliability specification normally identifies the relevant operating envelope. The same component can behave differently outside it, so the context must accompany any lifetime estimate.
Reliability is a probability under a model
For a non-repairable item with failure time T, the reliability function is R(t)=P(T>t) under the usual continuous-time definition. It represents the probability that the item has not failed by duration t, given the model and conditions. It is not automatically the percentage of currently open public facilities. The result depends on population data and assumptions. A student can work with an invented component and a clearly stated distribution without measuring actual machines. Learning what the mathematical symbol means is more useful than repeating a precise percentage with no source.
Unreliability complements reliability
If R(t)=P(T>t), the cumulative probability of failure by t is F(t)=1−R(t) under the associated lifetime model. If a hypothetical component has R(100 hours)=0.90, its modelled probability of failure by one hundred hours is 0.10. These are complementary event probabilities for that defined lifetime question. They should not be applied to a repairable system without considering how the model treats repairs and repeated failures. Students must name the time and population. A bare statement that equipment is ninety percent reliable is incomplete without the target function and period.
Hazard rate describes conditional failure tendency
The hazard rate h(t) is a conditional instantaneous failure-rate concept for a lifetime distribution. It is not simply the total number of failures divided by all historical devices in every context. NIST’s reliability handbook distinguishes hazard functions from repair rates for repairable systems. A student can understand that a product’s failure risk among those surviving to a given age may change with time. Hazard may increase with wear or follow a different pattern depending on the item. A single “average failure rate” cannot always describe the whole lifecycle accurately. This is why engineers select and validate a suitable model.
The bathtub curve is a common conceptual pattern
A bathtub-shaped hazard pattern has three broad regions: initially elevated or decreasing early failure risk, a relatively steady middle region and a later wear-out region. NIST discusses this observed pattern across several product categories. It is not a universal law for every component, nor proof that a newly opened sport centre must be in a high-risk phase. The curve describes a population model rather than predicting a specific item’s exact failure date. Students should draw the qualitative shape and label its axes. The aim is learning how failure mechanisms can vary through life, not making unsupported accusations about real equipment.
Early failures may have several causes
Some early failures arise from manufacturing, installation or initial-use issues, but the cause depends on the particular system. A higher observed early failure rate in a population does not establish negligence at a named venue. Reliability engineers investigate data, production and environment before drawing conclusions. A student can compare two fictional batches with different early outcomes and ask what evidence would reveal the mechanism. Testing can be important, but an ordinary visitor has no authority to stress-test public equipment. A model is useful when it points toward appropriate professional questions rather than assigning blame from one incident.
Wear-out is not always a fixed birthday
A product may degrade through use, exposure or accumulated load. Wear-out does not imply every identical item fails at exactly the same age. Manufacturing variability, service conditions and maintenance can influence lifetime distributions. NIST’s handbook discusses several lifetime models because different patterns can occur. A student should not assume that every pair of sports shoes or every electronic sensor has a universal safe lifespan measured in months alone. Manufacturer instructions and current condition matter. The purpose is understanding why reliability changes over time, not creating an arbitrary mandatory replacement calendar.
Constant hazard is an assumption, not a fact
The exponential lifetime model uses a constant hazard rate λ. Under this assumption, R(t)=e^(−λt). It is mathematically convenient, but it may not fit early defects, ageing or other changes in failure behaviour. Students should label the assumption prominently. A model’s simplicity is a reason to learn it, not proof that every real device experiences constant failure risk. NIST explains both exponential and other lifetime distributions for different contexts. The correct engineering choice requires suitable evidence. Do not infer a real Punggol lighting failure rate from the exponential equation alone.
Worked exponential reliability example
Suppose a fictional non-repairable component has a constant hazard λ=0.001 per hour. Its modelled reliability at one hundred hours is R(100)=e^(−0.1), approximately 0.9048. The probability of failure by that time is about 0.0952. These are invented inputs and results. No actual sports equipment was evaluated. Students should identify which number is the hazard and which is the survival probability, then check that a longer duration would produce lower reliability under the chosen exponential model. The calculation explains conditional mathematical structure, not a warranty for real equipment.
Mean lifetime depends on the distribution
For a non-repairable exponential failure-time model with constant λ, the mean lifetime is 1/λ. With the fictional λ=0.001 per hour, the mean is one thousand hours. This does not mean the component will definitely last one thousand hours. Some instances may fail sooner and others later. A mean is a distribution property, not a predicted expiration date for one identified unit. Students should not treat a supplier’s advertised mean value as a guarantee or use it to ignore visible equipment damage. The model must fit the intended population and conditions.
Repairable systems require a different view
A gym machine or public facility component may be repaired after a failure, then return to service. Its repeated failure process is different from the single lifetime of a non-repairable part. NIST describes repair rate or Rate of Occurrence of Failures (ROCOF) for suitable repairable-system models. Students should not merge the concepts without explaining the distinction. A machine being temporarily unavailable for maintenance does not necessarily mean it has reached end of life. A professional may decide between service, component replacement and other action. Visitors should use official reporting channels, not attempt repairs.
MTBF is not a guarantee of uptime
Mean Time Between Failures, or MTBF, describes average operating time between failure events under an appropriate repairable-system definition and assumptions. It does not promise that no failures will occur before the stated average. NIST’s constant-repair-rate model discusses estimating MTBF from total operation time and observed failures. A child should distinguish the mean from a minimum, maximum or warranty term. Two systems with the same average may have different failure patterns under other models. The definition and dataset matter, and actual estimates require trustworthy records rather than one person’s memory.
A fictional MTBF calculation
Imagine a purely educational repairable machine model with ten thousand hours of observed operation and five recorded failures under the chosen procedure. The estimated MTBF is 10,000/5=2,000 operating hours. This is not the MTBF of any ActiveSG equipment. The estimate depends on how operating hours and failures were defined, and a small sample can carry substantial uncertainty. Students can calculate the quotient, then ask which records would have to exist to support a real claim. A number is only as reliable as the event definitions and observations behind it.
MTTR measures restoration time
Mean Time To Repair or Restore, abbreviated MTTR, may describe an average duration for recovery after defined failures, depending on the organisation’s terminology. The exact starting and ending conditions must be stated. Does it include waiting for a specialist, obtaining parts or only hands-on technical work? Different definitions can produce different averages. Students should avoid comparing two MTTR figures without knowing the measurement boundaries. A public closure may involve planned work rather than a failure, so it cannot automatically be counted as fault recovery. The lesson is precise time measurement, not estimating staff performance from public rumours.
Availability differs from reliability
Reliability concerns sustained correct operation over a duration without the relevant failure. Availability concerns whether a system is operational when needed under the defined model, accounting for restoration. A repairable item may fail occasionally yet have high availability if it is restored quickly, while another may fail rarely but take a long time to restore. The two properties are related but not interchangeable. Students should consider what an ordinary visitor cares about at a particular session and what a maintenance engineer measures over time. Neither concept proves real Sport Centre facilities are available without current operator information.
A simple availability formula
Under a simplified steady-state repairable-system model, availability can be expressed as A=MTBF/(MTBF+MTTR), when the definitions and model conditions make this appropriate. Suppose fictional MTBF is 200 hours and MTTR is 2 hours. Then A=200/202≈0.9901, or about 99.01%. This is not the percentage of Punggol courts open or a live service-level promise. A student should identify the units in numerator and denominator and recognise that scheduled maintenance, multiple failure types and other operational conditions may require more detailed availability models.
Scheduled maintenance and unexpected failure differ
A sports venue may close a facility for a planned inspection or repair according to published schedules. That does not automatically indicate an unexpected breakdown. An engineer distinguishes preventive maintenance, corrective repair and operational decisions. For a family, the practical step is to consult SportSG’s official closure page before travelling. Students should not infer failure rates or technical causes from an announcement alone. The reliability lesson is to classify events accurately rather than treat every unavailable hour as proof that equipment was defective.
Series systems need all required components
A series reliability model represents a system that succeeds only if every required component succeeds under the defined assumptions. If two independent hypothetical components each have reliability 0.9 over the relevant period, series-system reliability is 0.9×0.9=0.81. This illustrates how combining required parts can reduce the overall probability of uninterrupted functioning. The independence assumption matters; correlated failures require other treatment. A student should not assume a public building’s actual lighting, booking and access devices form one simple series circuit. The model is abstract and only valid when its success definition fits the situation.
Parallel redundancy can support resilience
Under a parallel reliability model, a system succeeds if at least one of several alternative components operates. For two independent components with reliabilities R1 and R2, system reliability is 1−(1−R1)(1−R2). If each has reliability 0.9, the result is 0.99. This does not mean any two pieces of equipment can safely serve as interchangeable backups. Components must genuinely provide the required function, independence may fail and switching mechanisms can create additional constraints. NIST explicitly states the assumptions for parallel redundancy. Students should learn why the model helps while recognising its engineering boundaries.
Independence is not always realistic

Two backup devices may share the same power source, network, room or environmental exposure. If one common event disables both, the simple independent-parallel calculation overstates resilience. A paper diagram can show two boxes connected to the same fictional supply and identify the common dependency. This is a central reliability insight: adding a second component is not enough if one shared failure defeats both. Do not assert that actual Punggol systems have such weaknesses. The educational question is which dependencies need examination in a professional design and how independence assumptions affect the result.
Redundancy and spare capacity are different ideas
Having two devices with a switchable backup may provide redundancy, while having additional capacity can help handle higher load even when no component has failed. The distinction depends on the success criterion. A spare sports racket might let a family continue a casual game if one becomes unusable, but it does not replace a certified safety system or guarantee a court is bookable. Students should identify the intended failure and the function of the backup. An item labelled spare is not automatically an effective redundant component unless it can satisfy the requirement when needed.
A backup needs its own maintenance
An unused spare can deteriorate, lose power or become incompatible with an updated system. Reliability cannot be assumed simply because a second device sits in a cupboard. A professional maintenance plan may include inspection, appropriate testing, inventory and replacement records. Children should not test public backup electrical or emergency systems. In a fictional school project, draw a backup lamp and list what would need checking before relying on it. The lesson is that redundancy has lifecycle costs and failure modes of its own. Real safety-critical backup design requires qualified standards and official approval.
A fault tree works backward from an unwanted outcome
Fault Tree Analysis begins with a defined top event, such as a fictional information screen being unavailable during a planned lesson, then identifies combinations of events that might contribute. An OR gate represents an outcome caused by any of several inputs, while an AND gate represents the need for multiple conditions to occur. The diagram must be based on an appropriate system understanding; it cannot establish actual Punggol faults from outside. Students can draw a simple conceptual tree using invented component names. The goal is learning causal logic and dependencies, not guessing the reasons for real maintenance or provoking failures.
OR and AND events use different probability rules
Under suitable independence assumptions, the probability of at least one of two events is P(A or B)=P(A)+P(B)−P(A)P(B). For two independent events each with probability 0.1, the combined probability is 0.19. The probability of both is 0.01. Students must not interchange OR and AND simply because the event boxes look similar. Without independence, a different joint probability is needed. These are abstract exercises and not risk estimates for actual facility equipment. A fault tree’s numerical output can be misleading if the event dependencies or base probabilities are guessed.
Failure Modes and Effects Analysis starts with function
Failure Modes and Effects Analysis, often abbreviated FMEA, systematically identifies possible ways a process or component could fail and examines their consequences, causes, controls and priorities. It is a structured reasoning method, not a tool for diagnosing faults from one photograph. A fictional school club might list what happens if its presentation projector is unavailable: the group could use a prepared printed backup. Actual engineering FMEA should be performed with appropriate expertise and system records. Students can use a small table to distinguish function, mode, effect and mitigation without assigning fabricated professional safety ratings.
Severity is not the same as frequency
A hypothetical failure may have a serious consequence but be unlikely, or occur frequently with only minor disruption. Severity and occurrence describe different dimensions of risk. A student should not combine them into one adjective such as “bad” without explanation. Detection is another separate consideration: some issues are noticed quickly, while others may remain hidden until their effects matter. FMEA approaches sometimes score these factors, but the scales and action priorities require careful definition. A simple classroom can use qualitative descriptions rather than pretending to possess calibrated risk statistics.
An RPN number has important limits
Traditional FMEA methods may multiply severity, occurrence and detection rankings to produce a Risk Priority Number. But the number depends on arbitrary ordinal scales, and distinct combinations can produce the same product while representing different consequences. A high severity should not be dismissed solely because another ranking is low. Modern professional approaches may use action priorities and additional analysis. Students can learn that the table organises questions, not that a multiplication automatically determines public safety. Real venue risk decisions belong to qualified personnel and approved processes, not a student spreadsheet.
Detectability affects the response
A visible cracked racket handle and an intermittent internal electronics fault may be detected through different methods. Inspection procedures must suit the equipment and safety implications. A visitor can report an observable concern, but should not dismantle the item or conduct a live electrical test. Engineering detection may involve sensors, self-tests, documented inspections or professional diagnostic instruments. A classroom FMEA can identify which symptom might alert a user and which condition would require specialist investigation. It is not appropriate to create faults deliberately to observe how the actual Sport Centre responds.
Reliability testing needs an authorised environment
Professionals may use carefully designed lifecycle, accelerated or environmental tests to evaluate products under controlled conditions. An amateur who repeatedly overloads equipment until it fails may produce misleading data and create hazards. Children should not conduct destructive stress tests on gym machines, lights, helmets or public electronics. A paper dataset can teach failure distributions without any physical experiment. The aim is understanding which evidence would be required and why the conditions matter. Real tests need compatible apparatus, appropriate standards, safety provisions and competent supervision. An extreme demonstration is not automatically more scientific.
Censored data still contribute information
In reliability analysis, some units have not failed by the end of a study. Their observation periods can still provide information about survival, even though the exact failure times are unknown. Such data are called right-censored under a common study design. Treating every surviving unit as a failure at the study endpoint would distort the analysis. Students can draw five fictional devices, with some failure times and others observed only until a cutoff, then discuss the difference. Formal survival analysis goes beyond simple averages, but the conceptual insight is accessible: absence of an observed failure is not the same as proof of infinite lifetime.
Small samples create uncertainty
If a student observes only two fictional machines over a short period and neither fails, the result does not establish a universal failure probability of zero. Longer observation or additional data may be needed for meaningful estimates, and equipment may face different operating conditions. NIST’s reliability guidance discusses the limitations of missing failures and sparse datasets. Avoid turning a new building’s appearance or a short positive visit into a numerical uptime claim. A student can report “no failure observed during this defined sample” without exaggerating it to “every device is perfectly reliable.” The difference supports trustworthy scientific communication.
Repair quality needs verification
Restoring equipment to service is not simply replacing a part and assuming the requirement is met. Professional work may need suitable testing, inspection, documentation and authorisation before the equipment is made available again. A visitor should not use a faulted machine because an improvised repair seems good enough. In a fictional example, a sports timer that receives a new battery still needs appropriate functional verification, especially if timing accuracy matters. This illustrates why maintainability and quality assurance connect. Actual public systems require their own standards and qualified sign-off, not a blog checklist.
Preventive and corrective maintenance have different triggers
Preventive maintenance is planned to reduce risk or manage condition before a defined failure, while corrective maintenance responds after a fault has occurred. Neither term means a particular device must always be replaced on a rigid calendar. The appropriate strategy depends on wear, consequences, manufacturer requirements and data. SportSG publishes scheduled facility closures, which users can check without presuming each closure follows a breakdown. Students can draw a timeline with fictional inspections and one unexpected fault, then categorise the events. The educational task is interpreting maintenance types, not second-guessing a venue’s internal programme.
Condition-based maintenance uses observations
Condition-based maintenance relies on relevant measurements or indicators of equipment state rather than a fixed time interval alone. A professional system might monitor temperature, vibration, current or wear, depending on the device. But those measurements need sensors, thresholds and validated interpretations. A student should not attach sensors to public equipment or assume any unusual sound identifies a specific fault. The classroom can model a fictional indicator changing over time and ask when an authorised inspection would be appropriate. The lesson concerns data-informed decision-making with uncertainty, not remote diagnosis of Punggol machinery.
Predictive maintenance is not magic foresight
A prediction model can estimate the chance of a future issue based on suitable observations and assumptions. It cannot guarantee precisely when every component will fail. Poor data, changing use and unrepresentative conditions can undermine a prediction. Students should distinguish a probabilistic estimate from a certain event date and be wary of exaggerated AI claims. A school exercise can compare an invented simple trend with another scenario where the trend changes. Actual public maintenance decisions should not rely on an unsupported student model. The purpose is to understand the evidence and uncertainty behind predictive methods.
Design for graceful degradation
Graceful degradation means a system may retain useful reduced functionality when part of it fails, rather than cease all operation. A fictional information display might fall back to a basic text message if an optional image feature is unavailable. The design has to ensure remaining information stays accurate and safe. This is different from allowing a defective safety system to remain in use. Students should distinguish optional convenience from essential functions that require stopping or proper isolation. A paper screen mock-up can illustrate the principle without interacting with the real SportSG service or modifying public electronics.
A safe shutdown can be the correct result
Not every failure should be hidden from users through redundancy. When critical protective conditions cannot be met, stopping an activity or taking equipment out of service may be the responsible response. A model that maximises uptime at the expense of safety would be poorly specified. Students should understand that a temporary closure may demonstrate appropriate risk control rather than an embarrassing reliability failure. For an actual concern, follow venue staff and official closure information. Reliability Engineering supports dependable safe operation, not continued use at all costs. The function’s safety requirements belong in the definition of success.
Availability cannot be read from an opening celebration
A public opening announcement confirms that an event is planned and describes facilities. It does not provide historical failure records, repair times or guaranteed live access for every feature. A visitor should check the authenticated booking service and closure notices. Students should not invent statistics such as “99.9% Punggol uptime” from promotional materials or a single visit. An accurate article can explain how such a number would be calculated under a defined method, while declining to claim it is the real result. Source discipline is essential when mathematical formulas make unsupported figures look convincing.
An original series-versus-parallel example
A fictional practice session needs both a working portable scoreboard and a separate battery-powered timer. If independent reliability for the relevant session is 0.95 for each and both are required, series-model reliability is 0.9025. If either of two truly interchangeable independent timers could satisfy one timing function and each has reliability 0.95, the parallel-model result is 1−(0.05)²=0.9975. These are invented numbers, not actual product guarantees. A student should explain why the success criteria differ and why the same formula cannot be used for both situations.
An original common-cause failure case
Imagine two fictional backup displays powered by one fictional supply. If the supply fails, both displays stop, despite their individual backup relationship. The assumption of independent failures is then false. A student can draw two boxes feeding from a common source and explain why the simple parallel reliability result may overestimate availability. They need not inspect a real power distribution system to understand the lesson. Real public engineering designs require professional analysis and protections. The value of the toy example is revealing a hidden dependency before somebody trusts an impressive calculated number.
An original maintenance-log case
A fictional school group tracks a practice timer using invented operating hours, dates and faults. Over ten thousand operating hours and five defined failures, the estimated MTBF is two thousand hours under the assumed model. The class then notices one record counted a planned battery change as a failure, even though the timer had not stopped meeting its required function. They revise the classification and discuss how the statistic changes. The case shows why data definitions and quality matter. No actual user or public equipment record is being collected or audited.
An original fault-reporting case
A fictional visitor sees a damaged handle on a gym machine. They should not conduct a load test, glue it or assume the machine is safe because it remains powered. The responsible response is to stop using the questionable item and notify venue staff through appropriate channels. The article does not claim such a fault exists at Punggol. This case teaches a distinction: recognising a possible safety issue is different from determining its technical cause or performing a repair. A visitor’s report can help professionals, while unauthorised intervention can create further risk.
Reliability and sustainability can interact
A longer-lived product may reduce premature replacement, but maintaining it safely can require parts, labour, energy and appropriate end-of-life handling. A product that becomes unsafe should not remain in use solely to avoid waste. Reliability Engineering can contribute to lifecycle decisions by estimating failures and maintenance needs, while environmental assessment considers broader material and energy consequences. Students should not assume the mathematically most reliable option has the smallest total environmental footprint. The disciplines answer different questions and require separate evidence. Good decisions account for both without making unsupported carbon-saving claims.
A four-week Reliability Engineering learning plan
Week one: define required functions, failure events, reliability and availability. Week two: study exponential-model reliability, mean lifetime and the difference between repairable and non-repairable items using fictional calculations. Week three: compare series, parallel and common-cause diagrams, and learn why independence matters. Week four: construct a simple classroom failure-mode table, identify safe maintenance and reporting boundaries, and review the limitations of each model. No public equipment testing or data scraping is necessary. The goal is accurate reasoning about dependability and service over time, not professional certification of a facility.
Common Reliability Engineering mistakes
MTBF is not a guaranteed minimum lifetime. Reliability and availability are not the same. An exponential constant-hazard model does not fit every product age or failure mechanism. Redundant components may share a single point of failure. A maintenance closure is not automatically an unexpected breakdown. No observed failure in a tiny sample does not prove zero risk. A neat FMEA score cannot substitute for expert safety judgement. And a new public building does not provide published reliability statistics merely by being new. State the function, time, assumptions, population and evidence before reporting a number.
Frequently asked questions

What is reliability? The probability of meeting a specified function over a defined period under stated conditions.
Is reliability the same as availability? No. Availability considers whether a repairable system is operational when needed.
What does MTBF mean? Mean Time Between Failures under an appropriate repairable-system model; it is not a warranty.
What does MTTR mean? A defined average time related to repair or restoration, with its measurement boundary stated.
Can two backup components make a system more reliable? They can under suitable conditions, but independence and common causes matter.
What is the bathtub curve? A common conceptual lifetime pattern with early, stable and wear-out failure-rate regions.
Is preventive maintenance proof of a previous breakdown? No. Planned care and corrective responses are distinct.
Does an FMEA number decide public safety on its own? No. It is a planning aid subject to method limits and professional judgement.
Did this article inspect the reliability of Punggol equipment? No. All numerical estimates and examples are independent fiction for learning.
Where should visitors check actual facility closures? SportSG’s official facility closure notices and authenticated booking service.
Official sources and next step
Study NIST’s Assessing Product Reliability handbook, the bathtub-curve explanation, parallel and redundant reliability models, and repairable-system rates. For actual conditions use SportSG’s facility closure notices, its Punggol opening announcement, and MyActiveSG+. Related eduKate Punggol articles explain Materials Science, Systems Thinking and Project Management.
Your next step: draw a fictional system requiring two components and calculate series reliability from two invented probabilities. Then redraw it with genuine independent backups and explain why a shared power source changes the assumptions.
Editorial note: Independent Reliability Engineering education prepared 14 November 2026. No actual Punggol equipment failure, maintenance plan, uptime record, repair time or safety certification was accessed or reported.
Continue with the connected guide: ActiveSG Punggol 2027/2028 | Opening Status, Facilities and Visitor Guide. Use its linked index to compare the related questions and choose your next reading.


