
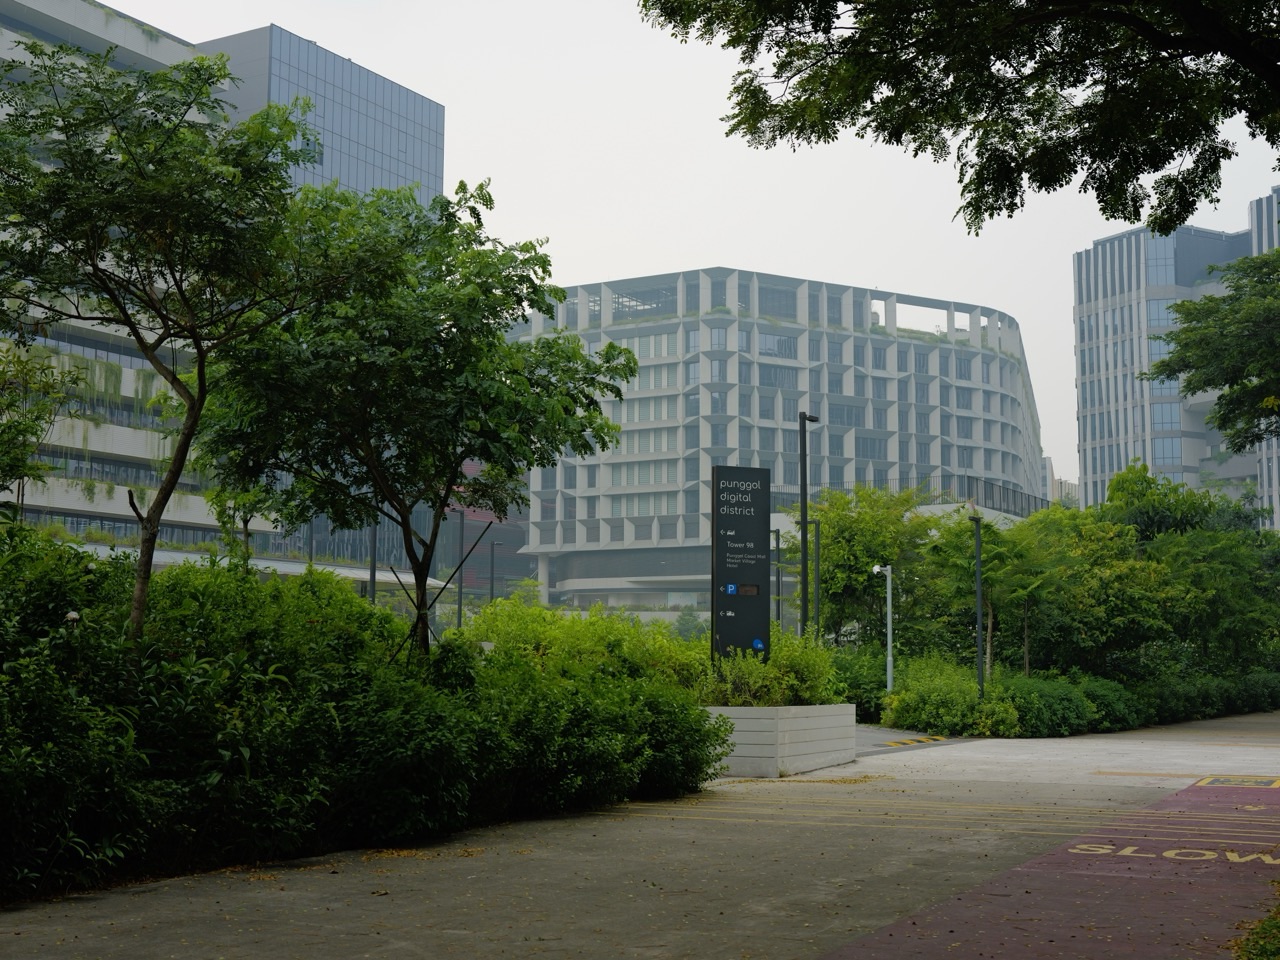
Quick answer: Punggol Digital District uses an Open Digital Platform (ODP), developed by JTC and GovTech, to connect approved systems and support virtual models of district operations. Its digital twin can help authorised organisations visualise data, simulate conditions and test a solution before using it in the physical district. For Punggol students, the educational opportunity is to learn about measurement, interfaces, simulations, privacy and responsible computing. It is not permission to access real building controls, private sensor streams or operational security systems.
JTC’s official 9 July 2026 announcement says the ODP integrates real-time data from more than 20,000 sensors and related systems. Panasonic was announced as an early partner in testing smart-facility solutions. The number demonstrates the scale of deployed sensing infrastructure; it does not mean 20,000 live readings are downloadable by the general public or that proposed results have already been achieved.
GovTech’s Smart City Tech description highlights district integration, virtual testbeds and resource optimisation. The JTC ODP explainer shows why building technologies often cannot communicate without translation between protocols. Students can learn the concepts using school-approved fictional data, open public information or properly authorised teaching material without interfering with infrastructure.
What is a digital twin—and what is merely a 3D picture?
A digital twin is a digital representation of selected aspects of a physical system, linked to appropriate data and modelling processes for monitoring, analysis or simulation. Its value comes from answering a defined question. A static architectural drawing can be visually realistic without containing current system behaviour. Conversely, a simple graph can help an engineer understand a process without looking like a video game.
A twin does not know everything about a town. It can omit people, temporary conditions, broken sensors, maintenance history or other relevant factors. A careful researcher therefore asks which measurements were used, how recent they are, what assumptions the model makes and whether its output has been checked against independent observations.
A school can create a toy version on paper: a fictional building with rooms, a simple timetable and imaginary temperatures. That exercise teaches the idea of a representation and how it might change when data change. It must never be presented as the live state of Punggol Digital District.
Three meanings of ‘open’ that should never be confused
An open platform can mean interoperable architecture with documented interfaces for approved users. Open data means information explicitly published for general reuse under a licence or defined conditions. Open public access means a place or service has permissions for visitors. These are distinct. The word ‘Open’ in ODP does not create permission to download private data or command doors, lifts, gantries and security infrastructure.
A computer-science student should distinguish technical possibility from authorisation. A system might respond to a network request even when the user lacks permission. School tasks must remain within recognised educational environments. Do not scan district devices, attempt credential access, impersonate a tenant or use personal information collected from bystanders.
Why Punggol’s different systems need a common language
Cooling equipment, security systems, lifts and logistics can use different software and data formats. JTC describes Open Standard Multiprotocol Middleware as a translation layer that helps connect these components. The underlying issue is one of meaning: two systems may use different units, names, timings and conventions, even when they appear to be talking about similar quantities.
A classroom analogy compares one imaginary sensor recording Fahrenheit and another program expecting Celsius. If the receiver treats the number 86°F as 86°C, the interpretation is wrong. The correct conversion is (86 − 32) × 5/9 = 30°C. The value is an invented example, not a statement about the actual sensors installed in Punggol.
A robust interface must record more than a bare number. It may require the unit, timestamp, sensor identity, allowed range, quality status and a meaningful error state. These are foundational computing concepts that can be taught through a simple spreadsheet long before anyone accesses a real software API.
First data-science lesson: every reading needs context
Suppose a fictional classroom dataset has temperatures of 29°C, 30°C, 32°C and 33°C at four different points. The average is (29 + 30 + 32 + 33)/4 = 31°C. That calculation does not establish that every point was 31°C, nor that the whole district has that temperature.
Ask whether the sensors were at the same height, in the shade, at the same moment and calibrated consistently. A dataset of thousands of biased measurements may still lead to an unreliable conclusion. Data quality and sampling design matter alongside quantity.
Second lesson: simulation is an intermediate step, not deployment
JTC describes using the ODP’s digital twin to try solutions virtually before applying them in an authorised real environment. A successful virtual test can identify problems or support planning, but real-world reliability depends on additional evidence, operations, safety checks and permissions. A student should not interpret an attractive simulated animation as proof of live capability.
This is the core skill the Punggol district can teach: distinguish what has been announced, modelled, observed and validated. Every one of those words indicates a different strength of claim.
Project 1 — clean a fictional sensor dataset before drawing a graph
A teacher gives students 24 invented temperature readings, one for each hour of an imaginary day. Several entries use the text ’29 degrees’, one row is blank and one time stamp appears twice. Before calculating the average, learners must decide how to standardise units, handle missing data and investigate duplicates. A polished graph made from inconsistent records can be misleading.
A simple data dictionary should define temperature as degrees Celsius, time as local 24-hour time and status as valid, missing or needing review. Do not replace every missing value with zero, as zero degrees would be a plausible but false observation. Keep a change log recording which rows were edited and why.
The students may then create a line chart, label the axes and describe one supported trend. They should never claim the invented values are sourced from PDD’s sensors. Correct provenance matters because a reader cannot judge evidence without knowing how it was created.
Project 2 — compare two energy-use scenarios
Imagine a fictional machine drawing 5 kW for four hours in Model A and three hours in Model B. Under the simplifying assumption of constant power, Model A consumes 20 kWh and Model B consumes 15 kWh. The arithmetic reduction is 5 kWh, or 25% of Model A’s use. This is a classroom exercise, not a claimed measured saving at Punggol Digital District.
Before concluding B is better, ask whether the machine delivered the same useful service. Perhaps B produced less work or had to operate later. A sound energy-efficiency comparison needs a denominator linked to useful output or equivalent operating conditions.
The next task is to calculate energy per imaginary unit of output. If A delivered ten acceptable units, its intensity is 2 kWh per unit. If B delivered only six, its intensity is 2.5 kWh per unit, despite lower total consumption. Students learn why a smaller total can conceal poorer efficiency.
Project 3 — a fictitious parking-space occupancy model
Create a paper model with 30 imaginary parking spaces. In one simulated time interval, 21 are occupied, producing an occupancy proportion of 21/30 = 70%. Later, 27 are occupied, or 90%. This does not tell the class why use changed or predict exactly what will happen tomorrow.
Ask what a real system would need before making a decision: entry and exit records, validation of counting sensors, authorised access and measures to protect private information. A student can explain occupancy without collecting vehicle plates, recording drivers or approaching a real gantry.
A presentation should distinguish a static capacity limit from a changing occupancy count. The model’s simplicity is useful because it makes those two concepts visible.
Project 4 — determine whether a queue simulation is fair
A fictional service desk handles one person every three minutes. If six people arrive at the beginning of a simulated interval and no one leaves the queue, the sixth person waits longer than the first. Now compare the same total of six arrivals spread over 18 minutes. Although the number of visitors is unchanged, the pattern of arrivals influences waiting.
A learner can model both scenarios with coloured paper counters. They should write down the arrival schedule, initial queue, processing rule and any assumption that service times are identical. Real queues have interruptions, priority needs and variability, so the classroom output is a limited illustration.
This experiment connects Mathematics, computing and human experience. It also shows why an apparently correct average cannot describe every user’s wait.
Project 5 — a data interface that translates units correctly
Have students build a two-column imaginary sensor table: raw reading and converted reading. Add a third column for unit metadata and a fourth for validation status. Insert invalid examples such as a missing unit or a text string where a number is required. The program or spreadsheet should flag invalid entries rather than invent conversions.
An older learner may write pseudocode that says: if unit equals Celsius, keep the reading; if Fahrenheit, convert; otherwise, mark it unverified and request review. This is a practical introduction to defensive programming without touching the ODP.
A test is successful when the program handles incorrect inputs as well as ordinary ones. A teacher should reward controlled failure and useful error messages rather than only a smooth best-case demonstration.
Project 6 — a privacy-preserving footfall chart
Suppose a school wants to show how busy a fictitious building entrance is across six half-hour intervals. Use invented counts rather than photographs or device tracking. A bar chart can communicate the overall pattern without identifying any person. Ask whether individual faces, names or precise movement histories would help answer the stated educational question. Usually they would not.
This introduces data minimisation: collect only what is necessary for the task, for an authorised purpose. Even aggregated data require care when the group is very small or the context could reveal individuals indirectly.
The project should not be confused with an actual occupancy-measurement service at PDD. Students must clearly label their chart ‘simulated classroom data’.
Project 7 — test a digital twin’s ‘what if’ claim
A student creates a fictional digital model in which opening a second service counter halves waiting time. The class then introduces an uneven arrival pattern and different service durations. Does the result still hold? If not, the model’s assumption was too strong.
This is the heart of useful simulation: a proposed intervention is tested under several credible conditions rather than only the example where it performs well. Record each test case and explain which conclusions survived.
The student’s report should avoid stating that PDD’s real twin works in the same way or uses the same simplified rules. It is an independent school exercise inspired by the existence of a genuine platform.
Project 8 — model a smart-building decision with a manual override
In a fictional classroom, an automated light is set to switch off when a room is empty. Introduce cases where the occupancy sensor incorrectly reports an empty room while a person remains inside. How should the fictional design deal with uncertain readings, accessibility and safe human intervention? A classroom flowchart can explore the options without wiring any actual equipment.
Students should learn that automation must be safe and accountable. A cost-saving rule is not automatically appropriate when it creates an unsafe or inaccessible environment. Actual building controls require responsible operators and standards.
Project 9 — a map whose uncertainty is visible
Create an imaginary town map with a location marker that may be accurate only within a few metres. The learner draws a circle of uncertainty around the estimated position and explains why a virtual robot should not treat the centre point as a perfect location. This is a gentle introduction to measurement uncertainty and spatial modelling.
A secondary student may calculate distances between two hypothetical coordinates, then explain what that arithmetic excludes. A measured distance in a model does not guarantee an unobstructed real-world path.
Project 10 — assess an AI recommendation rather than praising it
Give a simulated algorithm twenty fictional test cases of whether an empty room should be cooled. Suppose its recommendations agree with the teacher’s reference in 17 cases. The observed agreement is 17/20 = 85%. That number alone does not establish readiness for live deployment, especially if the remaining three errors occur when people need cooling or safe ventilation.
Ask learners to describe the false decisions, their consequences and how an authorised human supervisor should remain involved. A large accuracy percentage can conceal unacceptable failure modes. Real equipment needs much stronger evaluation.
The result must be labelled teacher-generated and explicitly separated from the claims or performance of any JTC or Panasonic service.
The first question: what problem would the digital twin solve?
Before students create a model, they should describe the real decision that the model is intended to support. A digital representation of a building may look impressive without answering any practical question. For example, a facilities team might want to understand whether a particular room is using more electricity than expected. A useful model would need a time interval, a definition of expected usage and a way to compare observations fairly. A 3D image alone would not provide those elements. In a classroom, students can begin with a fictional library room rather than a real Punggol Digital District building. They can ask whether turning lights off after closing time would reduce consumption, then specify which measurements would be needed. This makes the project a lesson in problem definition, not a competition to draw the most elaborate virtual campus.
Create a data dictionary before collecting numbers
Every column in a dataset needs a meaning. A beginner’s data dictionary might specify timestamp in Singapore time, room temperature in degrees Celsius, energy consumption in kilowatt-hours and occupancy as an estimated count. Students should distinguish an instantaneous power reading in kilowatts from energy accumulated over an interval in kilowatt-hours. Mixing the two produces misleading charts even when every spreadsheet formula works. The dictionary should also describe whether missing values are permitted, what zero means and which source supplied the information. If the numbers are fictional, label them as synthetic. Do not copy screenshots of a real facility dashboard and present them as open public data. A good data dictionary is a form of communication between people, software and future readers who were not present when the dataset was created.
A fictional sensor failure worth finding
Imagine a classroom temperature dataset that reads 25.1, 25.4, 25.2, 251.0 and 25.3 degrees Celsius at five successive times. The fourth entry is suspicious, but students should not silently replace it with 25.1 just because that would make the graph smoother. First they should flag it, check whether a decimal point was misplaced and decide what the record can legitimately support. In a synthetic exercise, the teacher can provide an answer key stating that the fourth value was a deliberate data-entry error. In real monitoring, the correct value may remain unknown. Students can mark it missing, explain why and compare the chart with and without that point. The lesson is that data cleaning requires judgement and documentation. An attractive graph cannot compensate for unacknowledged uncertainty in the underlying observations.
Why timestamps are part of the measurement
A sensor reading without a timestamp is often much less useful. A temperature of 29 degrees Celsius might be normal at one time and unexpected at another. A queue of 30 people may be significant before an event but ordinary at the end of a lunch period. Students should record the time zone, whether intervals are regular and whether the value represents an instant or an average. For example, a ten-minute mean occupancy count is not interchangeable with a snapshot taken at the final minute. A simulated building can use timestamps such as 09:00, 09:10 and 09:20 in Singapore time. If a row is missing, the gap should remain visible. Filling it with an invented value without a label would create a false history. These habits matter in environmental monitoring, transport planning, sports science and school experiments alike.
A small energy experiment with defensible assumptions
Give students a fictional room that uses 4 kilowatt-hours of electricity during a specified two-hour period. Ask them to compare a proposed scenario using 3.2 kilowatt-hours over the same period. The difference is 0.8 kilowatt-hours, or 20 percent of the original value. This is an arithmetic comparison, not proof that a particular Punggol building can achieve a 20 percent saving. A real prediction would need evidence about equipment, occupancy, weather, controls and operational constraints. Students can write two conclusions: ‘In the synthetic scenario, the reduction is 20 percent’ and ‘Actual savings would need measured validation.’ This distinction protects readers from confusing a teaching model with an engineering guarantee. It also introduces a useful rule: the comparison is only meaningful when the boundaries and time periods match.
Separate simulation from a decision to operate equipment
A simulation can suggest what might happen if a cooling schedule changes, but a student project should never be connected to real building controls. The classroom version can use an isolated spreadsheet, diagram or local model with fictional values. It should not request credentials, bypass security, scrape a live operational dashboard or issue commands to equipment. In an actual facility, safety, cybersecurity, maintenance, accessibility and authorised approval all matter. The digital twin is part of a decision process, not a licence for autonomous changes. This distinction is important when enthusiastic learners see promotional descriptions of smart districts. The public can learn how systems interact without obtaining operational access. A strong project explicitly states which actions are simulated, which assumptions are hypothetical and which decisions require accountable human authority.
Privacy starts before the first chart
A footfall chart may seem harmless, but its inputs could become sensitive if they identify individuals or reveal movement patterns. Students should use invented counts or appropriately aggregated public information, never photographs of identifiable strangers or location histories collected without consent. Even an aggregate can become revealing when a category contains only one or two people. A classroom project can use broad time bands and synthetic totals to demonstrate the concept. Explain that ‘open platform’ does not mean every data stream is available to the public. System interoperability, developer interfaces, commercial access and public open data are different ideas with different permission models. A student should be able to explain why a dashboard may display a trend without exposing the records that produced it. Protecting people is part of technical quality, not an optional final paragraph.
The difference between a digital twin and a forecast
A digital twin may combine a representation of an asset, relevant data and models that support monitoring or analysis. A forecast predicts a possible future value under stated assumptions. These ideas can overlap, but they are not synonyms. A virtual map showing current building geometry is not automatically a forecast, and a spreadsheet projecting electricity usage is not automatically a digital twin. Students should identify which components their project actually contains. If the project uses no live measurements, describe it as a static model or simulation rather than claiming continuous synchronisation with the physical world. If a prediction is based on three invented observations, its precision is educational, not operational. Careful labels help learners communicate without exaggeration and make their work more credible to teachers, parents and potential industry mentors.
How to compare two models fairly
Suppose two fictional methods estimate the number of people arriving at a service counter. Model A predicts 18, 24 and 30 arrivals for three periods; Model B predicts 20, 22 and 28. The observed fictional counts are 19, 23 and 29. Both models have errors, and students can calculate absolute error for each period before comparing totals or averages. They should also ask whether three observations are enough to select a model for real deployment. Usually they are not. A fair test needs a clear target, a consistent metric and data not used to construct the predictions. It should also consider whether a model performs poorly during unusual busy periods. A chart that looks close to the observations is not a complete evaluation. This exercise introduces validation and the risk of overconfidence without requiring access to proprietary district data.
What to do when the model and observation disagree
Disagreement is not automatically a software bug. The measurement could be faulty, the model assumptions could be incomplete or the physical situation could have changed. Students can create a simple troubleshooting tree: verify the timestamp, verify the unit, inspect missing values, check the model’s input assumptions and document unresolved differences. For example, an occupancy model may predict a quiet afternoon while a fictional school event creates an unexpected surge. The model should be revised only after the cause is investigated, not edited to make the historical chart look perfect. This is a practical introduction to model drift and feedback loops. The same reasoning appears in education: a learner predicts a test result, compares it with the actual answer and repairs the specific misunderstanding instead of merely repeating the final answer.
A presentation format that makes the project trustworthy
A student report can fit on five slides or a short document. Begin with the decision question. Show a labelled diagram of the fictional system and its data sources. Present one cleaned table with units and timestamps. Compare two scenarios or models and state the limitations. Finish with a recommendation about what should be tested next, not a claim that the model has transformed Punggol. Include a sentence saying whether the data is synthetic, public or collected with permission. If students used a real source about Punggol Digital District, cite the official JTC or GovTech page and distinguish the source’s claims from their own interpretation. This structure gives parents and teachers a way to assess reasoning, evidence and communication rather than judging the project by animation quality alone.
A progression from primary school to university
Younger pupils can count fictional arrivals at a model bus stop and make a picture graph. Upper-primary pupils can compare simple energy totals and percentages. Lower-secondary students can organise a table, interpret graphs and describe variables. Upper-secondary students can investigate functions, rates and experimental limitations. Polytechnic learners can build a basic database or dashboard with synthetic data, while university learners can explore model validation, uncertainty, governance and system architecture. These are examples of age-appropriate projects, not claims that a particular course requires them. A good educator chooses the smallest task that reveals a genuine reasoning step. The aim is not to force every student to learn industrial software; it is to teach transferable habits of measurement, verification and responsible explanation.
What Punggol families should take away
Punggol Digital District provides a local reason to ask how modern buildings, services and digital systems exchange information. Families do not need access to a live operational platform to learn from that idea. A kitchen-table dataset can teach units, missing values, uncertainty, privacy and the difference between a simulation and an authorised action. Students should be proud of a modest, well-explained model rather than make claims that they have replicated JTC’s infrastructure. Parents can ask three useful questions: What did you measure or assume? How did you test your conclusion? What would make you change your mind? Those questions turn a fashionable technology topic into durable learning. They also help readers understand public descriptions of smart districts without mistaking promotional language for an independently verified outcome.


