
G2 standalone Geography K226 requires students to undertake ten weeks of extended fieldwork as part of their learning, and assesses geographical-methods understanding through a compulsory 25-mark fieldwork question in Paper 1 of the 2027 Singapore-Cambridge Secondary Education Certificate (SEC). Paper 1 lasts one hour 45 minutes, carries 50 marks and accounts for 50% of Geography. Question 1 applies Topic 1.3 Geographical Methods and may use a fieldwork scenario drawn from any syllabus cluster. Question 2 is the compulsory 25-mark Tourism question, including a six-mark judgement-and-decision-making task. The ten-week school investigation is not a separate nationally weighted coursework paper: K226’s published examination weighting is divided equally between its two written papers.
For Punggol students, Geography fieldwork means asking a measurable question about people and places, collecting relevant evidence safely, interpreting patterns and evaluating how trustworthy the findings are. It is not simply a photo walk along Punggol Waterway, and a conclusion should not be invented before the data exist. Parents should confirm whether the child takes standalone Geography K226 or combined Humanities Geography K229, which has different paper structures and bite-sized fieldwork. A practical starting point is a teacher-approved inquiry question, an honest explanation of what would need measuring and an assessment of the method’s likely weaknesses. Understanding those choices is what transfers to an unfamiliar national examination scenario.
- Official SEC 2027 standalone G2 Geography code K226; different from combined Humanities Geography K229.
- Paper 1: 1 hour 45 minutes, 50 marks, 50%; two compulsory 25-mark questions.
- Paper 1 Q1 is Geographical Methods/Fieldwork Topic 1.3; the scenario can draw on any K226 syllabus cluster.
- Paper 1 Q2 covers Tourism, with one six-mark AO3 judgement-and-decision-making question.
- Paper 2: 1 hour 45 minutes, 50 marks, 50%; Q1 Everyday Life Topics 1.1–1.2, Q2 Climate, 25 marks each.
- Students undertake extended school fieldwork over ten weeks as a learning experience, not a separate 10-week national coursework percentage.
- Geographical inquiry begins with a scoped question and a testable hypothesis about one or two relevant variables.
- Primary methods include convenience, quota, simple random and stratified random sampling, closed-ended surveys and mental maps.
- Analysis can use counts, percentages, mean, median, mode, plots, maps, graphs and careful qualitative interpretation.
- Research quality requires discussion of sampling bias, reliability, validity, ethics, practical limitations and risk management.
- An approved calculator may be used in the two written papers, but cannot decide whether the inquiry was well designed.
- Start with one factual observation, distinguish it from an inference and choose a safer, testable next question.
Definition lock: ten-week fieldwork is learning, not another exam paper
The K226 syllabus explicitly requires extended fieldwork over ten weeks, allowing students to investigate an aspect of Geography in depth. This hands-on experience builds the skills tested in written scenarios. It should not be confused with a separately weighted project submission worth a percentage of the national grade. The published scheme assesses two 50-mark written papers, each worth half the result. Schools decide the detailed fieldwork activities and supervision within the syllabus, so a parent should ask the teacher for the actual course plan.
That distinction protects students from unnecessary work. A pupil may need to reflect carefully on a school field investigation while separately practising the written fieldwork question. Producing a glossy home project does not replace either requirement, and collecting more photographs does not automatically demonstrate better enquiry. The intended achievement is a defensible question, relevant information and the ability to evaluate findings without pretending they are more reliable than the method allows.
K226 and K229 are different courses
Standalone K226 covers three clusters: Geography in Everyday Life, Tourism and Climate. Its Paper 1 fieldwork and Tourism questions are both compulsory; Paper 2 tests Everyday Life concepts and Climate. Combined Humanities K229 instead pairs Geography with Social Studies and offers a different optional Climate-or-Tectonics structure. A workbook meant for one may include worthwhile skills but omit or misrepresent the other’s national requirements. The subject code matters more than the general title Geography.
Ask the school which code the child will take and what upper-secondary option is actually offered for the cohort. National publication of a syllabus does not guarantee that every Punggol secondary school offers it to every eligible student. Parents also need to separate Posting Group 2 for Secondary 1 admission from G2 as the subject level. Confusing those terms can lead to the wrong revision materials and an unrealistic timetable.
Paper 1 Question 1: fieldwork for twenty-five marks
The first compulsory question of K226 Paper 1 is based on Topic 1.3, Geographical Methods, and is worth twenty-five marks. The syllabus makes an important point: the fieldwork context may or may not come from any of the clusters studied. This means a student must learn transferable method rather than memorise a single location or completed project. A question may ask how data were collected, what a chart reveals or why an investigation’s conclusion requires caution.
Practice should mix unfamiliar scenarios with familiar techniques. Show the teenager a fictional survey about visitors to a public space, then a second example about a tourism-related issue. The same questions remain valuable: what was measured, whose experience was captured, which evidence supports the pattern and what could have affected the result? The subject matter changes while the reasoning method stays useful.
Paper 1 Question 2: Tourism remains compulsory
The other Paper 1 question covers Cluster 2, Tourism, and also carries twenty-five marks. It includes a six-mark question assessing AO3 Judgement and Decision-Making, marked through generic level descriptors. A teenager cannot replace Tourism by answering more on fieldwork. Similarly, the fieldwork question cannot be ignored because the child prefers memorising case studies about tourism destinations. The paper is designed to test both investigation skills and the content of tourism activity, development and sustainability.
Develop a balanced revision schedule. One session might practise drawing a conclusion from survey data; another might explain why tourism develops or evaluate an approach to managing visitor impacts. Then connect them: how could fieldwork investigate a real or hypothetical tourism question? This produces coherent geographical thinking instead of two unrelated sets of notes.
Paper 2 has a distinct compulsory structure
Paper 2 also lasts one hour forty-five minutes and carries fifty marks. Question 1 is on Geography in Everyday Life Topics 1.1 and 1.2, and Question 2 is on Climate. Each is worth twenty-five marks. The Climate question includes a six-mark AO3 judgement task. Neither paper has an optional question choice in the published K226 structure. Students preparing with the K229 format may mistakenly expect to select between Climate and Tectonics; that choice does not apply here.
Parents can use a one-page assessment map to distinguish the four compulsory questions across the two papers. The same geographical reasoning skills travel between them, but the content coverage is not identical. A good learner understands both why an investigation is credible and how a climate or tourism decision can be evaluated against practical criteria.
The first step: turn curiosity into a research question
A question such as ‘Is Punggol nice?’ is too broad for reliable fieldwork because nice is undefined and people may mean different things by it. A better question identifies a specific place, group, variable and time period. For example, a teacher-approved inquiry might ask how reported thermal comfort differs between a shaded and unshaded path during comparable observation periods. Even this proposal requires permissions, safety checks and an appropriate method before it becomes real fieldwork.
Ask the teenager what the study is trying to discover and what answer would count as evidence. If the question cannot be tested with available resources, narrow it rather than invent results. Good geography is not only about knowing a place; it is about making clear, proportionate claims that a reader can examine.
Hypotheses: a prediction is not a finding
The syllabus expects a measurable hypothesis about one or two relevant variables. A hypothesis is a statement to be tested, not the conclusion already reached. If the learner writes ‘more people enjoy the park because it is beautiful’ before any observations, the statement may lack measurable variables and mixes preference with assumed cause. It should be translated into something that data can reasonably support or challenge.
Use a fictional dataset to test a hypothesis, then ask whether the result confirms or contradicts the initial expectation. Both outcomes can teach something. A contradictory result is not a failure to be hidden; it invites careful consideration of assumptions, measurement and context. A well-designed study is valuable because the evidence, not the pupil’s preferred story, guides its conclusion.
Scope: a street is not automatically an entire town
Fieldwork needs a defined study area and suitable period. Observing one section of a waterway path cannot establish how every Punggol resident behaves across the whole estate. Likewise, a survey conducted only after school may miss adults or commuters who use the place at other times. Scope determines what claims the findings can support. The study should be modest enough to conduct safely and meaningful enough to answer the question.
Ask the student to mark the observation area on a simple map and state the planned time window. Who or what falls outside the sample? Which limitations are practical rather than conceptual? These questions improve transparency and prevent the common mistake of treating a narrow local observation as a population-wide survey.
Primary versus secondary data
Primary data are collected directly for a specific investigation, for example through authorised counts or surveys. Secondary data are information already gathered and published by another organisation, such as an appropriate official statistic. Neither category is automatically better. Primary data can be directly tailored to the question but limited in scale; secondary data may be broader but use a different definition or time period. The best choice depends on the study’s aim.
Give the learner two examples: a fictional observation log at a park and a publicly released transport report. Ask what each can answer. If the observations are recent but cover only one afternoon, they should not be presented as a long-term trend. Conversely, a credible official report still needs to be read for its exact geography and date.
Quantitative data: what can actually be counted?
Quantitative information includes counts, measurements, ratings and other numerical records. A question about how many cyclists pass a location can be measured through an appropriately designed count, while a question about satisfaction requires careful definition of how responses are recorded. Data collection should specify units and conditions. Counting one type of activity while ignoring another can create a distorted comparison.
Use a hypothetical count table rather than collecting real road-user data without teacher approval. Ask whether the observations cover equal time intervals and comparable locations. If one count runs for twenty minutes and another for forty, raw totals are not directly comparable. A sound conclusion accounts for that difference before claiming one place is busier.
Qualitative data: meaning and experience
Qualitative information can describe how people experience or interpret a place, often through appropriate interviews and open-ended responses. The richness of such evidence is different from a simple count. A quotation from one person may clarify a feeling or practical difficulty but does not automatically represent the whole community. Students should understand why perspective matters and what the method cannot prove.
Present two fictional comments about a shared space and ask what each reveals about the speaker’s experience. Then ask what would be needed to know how common those experiences are. This exercise shows how qualitative and quantitative evidence can complement one another without pretending they are interchangeable.
Convenience sampling: easy access creates limitations
Convenience sampling selects people or observations because they are easy to reach. It can be practical for a small school enquiry but may systematically exclude others. Interviewing only classmates about a community facility tells us about those pupils, not everyone who uses it. The limitation is not automatically removed by asking more classmates from the same group. Students should explain the sampling bias in relation to the research question.
Use a fictional survey in which twenty pupils from one class answer a question. Who is represented and who is missing? If the goal is the class’s experience, convenience sampling may be appropriate. If the claim concerns a whole town, the method is inadequate. A good explanation connects the limitation to the desired conclusion rather than simply repeating ‘sample too small’.
Quota sampling: deliberate groups, but not random selection
Quota sampling aims to include particular groups according to specified categories. It can improve diversity of responses compared with interviewing only whoever happens to walk past, but participants within quotas may still be chosen non-randomly. The student should distinguish the intended coverage from the actual selection mechanism. A quota is not a guarantee that every group member has an equal chance of inclusion.
Imagine an authorised fictional survey with places reserved for morning and afternoon visitors. Ask whether the resulting data represent the entire day’s usage and which other groups or time periods could be absent. Then compare with a random method. Explaining the trade-off shows that the pupil understands sampling design rather than only naming a technique.
Simple random sampling: a selection rule matters
Simple random sampling gives eligible members of a defined population an equal chance of selection through an appropriate random procedure. That requires a clear population or sampling frame. Asking randomly encountered people at a busy entrance may not be equivalent if some users never pass that entrance. Students should evaluate the real selection process, not assume the word random validates every method.
Use a fictional list of thirty coded participants and demonstrate how a teacher-approved random selection could choose ten. Then ask which population those ten represent. If the list excludes evening visitors, the result cannot directly describe them. This teaches that randomness helps within a frame but does not repair a flawed frame automatically.
Stratified sampling: representation across meaningful groups
Stratified random sampling divides a population into relevant groups and selects randomly within them. It can help ensure coverage of categories that a simple random sample might underrepresent in a small study. The categories must be defined appropriately, however, and any reported overall conclusion should consider how the strata correspond to the population. Students should not assume the same sample count per group is always representative.
Create a hypothetical school study with two year-level groups of different sizes. Ask how a proportionate stratified sample might be allocated and why. Then consider what would happen if one group were oversampled. This makes the method a deliberate design choice rather than a difficult term to memorise for the examination.
Closed-ended surveys: write one clear question at a time
Closed-ended questionnaires allow respondents to choose among predefined answers. The syllabus includes rating, frequency and ranking scales. A poorly worded question can produce data that are easy to count but hard to interpret. For example, asking whether a place is safe and beautiful combines two concerns into one response. The student cannot know which concern the participant answered.
Give the learner an original survey item and ask how to make it more specific and neutral. Then check whether the available options cover reasonable answers, including where appropriate a response for uncertainty. A good survey respects participants and produces evidence relevant to the research question; it does not try to force the outcome the investigator wants.
Rating scales, frequency scales and ranking scales
These scales capture different kinds of response. A rating scale can indicate degree of agreement or perceived quality; a frequency scale records how often an activity occurs; a ranking scale asks for an ordered preference. Mixing them up can create an interpretation error. A ranking of three options does not by itself show how strongly the respondent feels about the first compared with the second.
Provide fictional answers from three participants and ask what can be concluded from each type of scale. If one respondent ranks a facility first, that does not reveal an exact numerical measure of satisfaction. Students should learn the limits of data formats before choosing charts or calculating summaries.
Mental maps: what a person remembers about a place
A mental map represents someone’s perception and experience of an area. It may emphasise familiar routes, personally important features or locations associated with strong feelings. Such a map is not a precise survey of distance or land use. Its value lies in revealing sense of place and the way individuals organise spatial information. Different people’s maps can be meaningfully different without either being simply wrong.
Ask a child to sketch a fictional or familiar safe route from memory, then compare it with a base map. Which features are prominent, missing or distorted? What could an interview reveal about those choices? Actual research with other people should follow school permission and privacy rules. The aim is to understand perception, not collect classmates’ home addresses.
Semi-structured interviews: ask what a map means
The syllabus includes semi-structured interviews with open-ended questions to explore the features and labels placed on mental maps. Such interviews allow follow-up questions while retaining a clear research focus. The interviewer should not lead participants toward a preferred explanation. A question like ‘Why do you love the library so much?’ already assumes a positive feeling that may not be present.
Practise revising it to ‘What does this library mean to you, if anything?’ Then ask a neutral follow-up about why it was included on the map. The learner should understand the difference between recording a perspective and shaping it through leading questions. Ethical, careful interviews build more trustworthy qualitative evidence.
Collecting quantitative before qualitative evidence
The geographical-methods syllabus allows a sequence in which quantitative data reveal a pattern and subsequent qualitative work explores its possible reasons. For instance, a fictional count might show that one route is used more frequently than another, but numbers alone cannot establish why. A later appropriate interview could investigate user preferences or constraints. The two methods serve related but different purposes.
Ask which initial pattern requires explanation and what open-ended question could clarify it. Avoid inventing a cause before the interviews. A study can report that a relationship was observed while acknowledging that other factors may also explain it. The strength of mixed methods comes from the complementary evidence, not merely using two different-looking charts.

Collecting qualitative before quantitative evidence
The reverse sequence is also within the course’s inquiry framework. Open-ended responses may suggest an issue worth measuring across a broader sample. For example, several fictional comments about shade along a route could inspire a survey of how frequently different users mention thermal comfort. The first stage generates a focused hypothesis; the second examines how widespread the reported concern might be.
Ask the teenager how one interview finding could be turned into a measurable, neutral question. Then discuss whether the proposed population and sampling method are appropriate. This teaches purposeful method sequencing rather than a rule that every investigation must always start with numbers.
Counts and percentages: identify the denominator
A percentage describes a part of a clearly defined total. If fifteen out of twenty surveyed pupils prefer an option, that is seventy-five per cent of the sample, not necessarily of all school pupils or residents. Students can make the arithmetic correctly and still overstate the conclusion. The important methodological habit is naming whose responses were measured and under what conditions.
Use a fictional table of thirty participants and calculate the percentage selecting one answer. Then ask whether it is defensible to write ‘seventy per cent of Punggol agrees’. Unless the sampling supports that population claim, it is not. This distinction is essential for reliable interpretation and prevents misleading generalisations.
Mean, median and mode: not all averages tell the same story
The syllabus includes mean, median and mode for suitable numerical survey responses. The mean uses the total divided by the count, the median identifies the middle value of an ordered set and the mode is the most frequent response. These summaries answer different questions. One extreme observation may affect the mean substantially while leaving the median comparatively stable.
Take the fictional ratings 2, 3, 3, 4, 8. The mean is 4, the median is 3 and the mode is 3. Ask why they differ and which might best represent a stated inquiry. The exercise is not a claim about real participants; it demonstrates that choosing a measure requires reasoning rather than simply calculating everything.
Scatter plots and correlations: relationships are not causes
A scatter plot can show whether two measured variables tend to increase or decrease together. A line of best fit may summarise a pattern, but correlation does not automatically prove causation. A third factor, restricted sample or measurement error may influence both. The student should identify the axes and units before describing the association and avoid suggesting a mechanism the data cannot establish.
Use fictional paired observations of shade coverage and reported comfort, labelled clearly as illustrative. Ask whether any apparent correlation exists, then list other plausible influences such as time of day and individual activity. The correct conclusion can be cautious without being useless. Good geographical analysis states what is supported and what still needs investigation.
Map presentation: title, scale, orientation and legend
Maps used in inquiry should communicate what was observed and where, using appropriate titles, orientation, scales, legends and data sources. A symbol without a legend may be unintelligible; a map without scale may support location descriptions but not precise distance comparisons. Students need to select the right representation for the question rather than simply decorate a map with colours.
Ask the teenager to review a fictional dot map and identify what a reader could misunderstand. Then improve the legend or labels. This teaches graphical communication while maintaining data accuracy. A beautiful-looking map containing unsupported locations is still poor geographical evidence.
Charts: select the form that fits the data
Bar charts can compare categories, line graphs can depict ordered changes and pie charts may represent parts of an appropriate whole. The exact choice depends on the variables and the claim. A pie chart for unrelated totals may be misleading, while a time-series bar chart can sometimes work if the labels are clear. The student should be able to justify the selected display.
Give the learner an invented dataset of visitor counts over several days and a separate dataset of preferred facilities. Which graph suits each and why? Then check whether axes and units are labelled. The purpose is to reveal relationships accurately, not to show how many chart types a spreadsheet can create.
Reliability: would the method produce consistent findings?
Reliability concerns the consistency of a method or its results under appropriate repeated conditions. A count taken at different times may vary naturally even if the observer is accurate, so the context matters. Repeating an unclear question does not necessarily create reliable information, and different observers may interpret categories differently. Students should identify what source of inconsistency could affect the specific investigation.
Ask how a school-approved observation protocol might ensure two observers classify the same activity in a comparable way. Would clear definitions and repeated comparable sessions help? Explain the mechanism. A generic conclusion that all data are unreliable because the sample is small is less useful than identifying a plausible error source and its impact.
Validity: are we measuring the intended question?
Validity asks whether the chosen method actually measures what the research question claims to investigate. Counting how many people pass a location may not reveal how satisfied they feel about it. A perfectly repeated count can be reliable but invalid for a satisfaction question. Students need to separate these two qualities and avoid treating them as interchangeable words.
Give the teenager a hypothetical inquiry about perceived safety and a method that records only visitor numbers. Ask why that measurement does not answer the stated question. Then propose an appropriate, ethical method that could better address perceptions. This is one of the most transferable skills in the national fieldwork scenario.
Bias: which voices were not collected?
Survey and interview findings can be affected by who was available, who chose to participate and how questions were phrased. A fieldwork conclusion may underrepresent users who are absent at a particular time or uncomfortable responding. Students should identify those limitations proportionately. The fact that a dataset has weaknesses does not make every observation worthless; it affects what can be inferred from the available evidence.
Ask the pupil to name the likely missing group in a fictional lunchtime survey and explain how that might alter the reported preferences. Then choose an improvement appropriate to school resources and ethics. A specific sampling correction is stronger than a generic sentence saying ‘use more respondents’.
Safety: curiosity must not create a hazard
Fieldwork can expose students to weather, traffic, uneven surfaces and crowded public areas. The syllabus expects methods to be adapted to manage risks and avoid harm to people and nature. A valid research question does not justify unsafe observation or collection of private data. Students should follow the school’s risk assessment and supervision rather than improvise independent roadside counts or intrusive interviews.
At home, parents can help by discussing a hypothetical safe route and the risks involved in an observation. The candidate should not approach strangers, operate devices near roads or enter restricted places solely to complete a practice activity. Data can be analysed using fictional or officially published sources when direct collection is inappropriate.
Ethics and privacy in research
Responsible geographical inquiry respects consent, participants’ dignity and the confidentiality of identifiable information. A questionnaire that asks for home addresses or private travel routines may collect more data than the research purpose requires. Photographs of people in a public place can also raise privacy concerns when used in published work. Teachers should guide permitted methods and handling of records.
Ask the learner which personal information is genuinely necessary to answer a hypothetical question. If none, do not collect it. Use anonymised or fictional datasets for home practice. Ethical restraint improves the quality of research because it encourages clarity about what is being measured and why.
Punggol Waterway as a learning setting, not a national case prediction
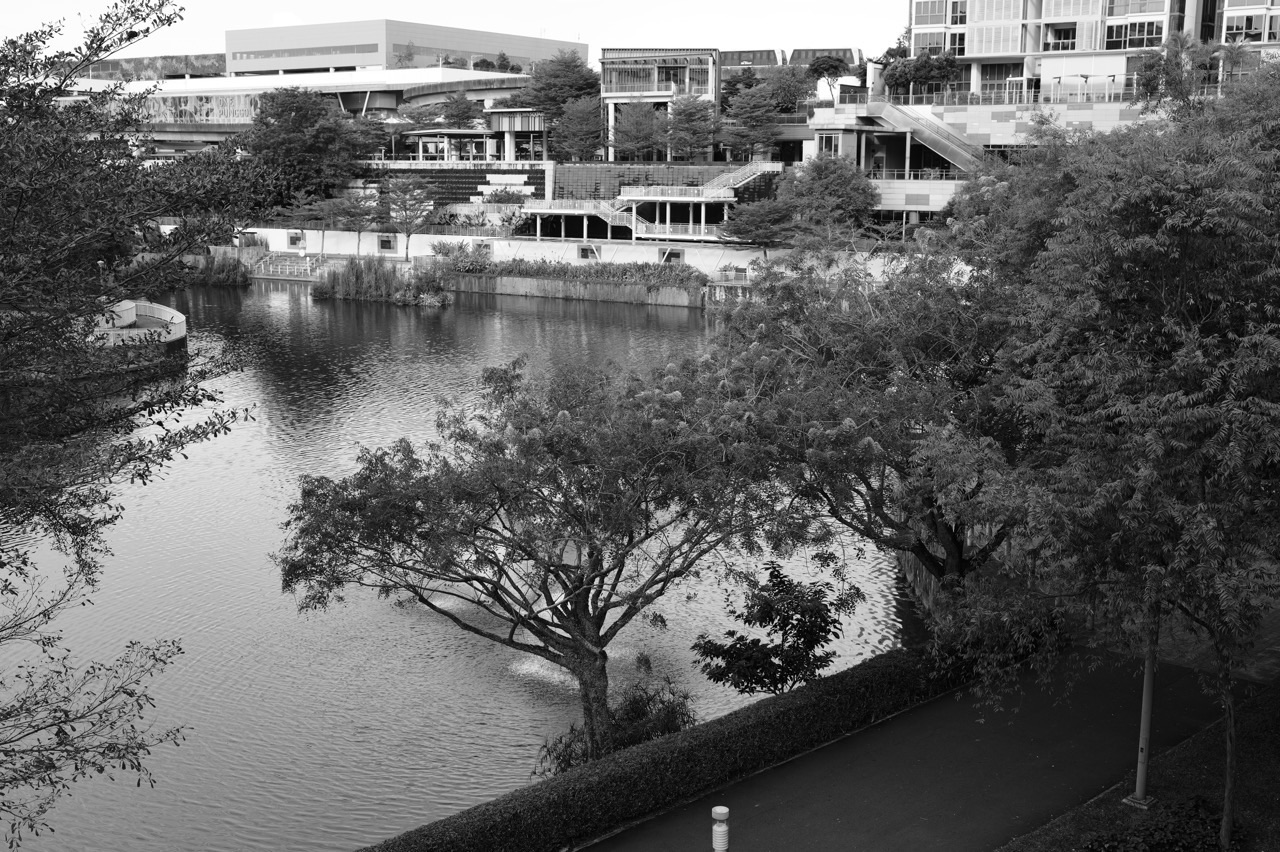
Punggol Waterway and surrounding neighbourhood paths are familiar contexts for thinking about accessibility, shade, recreation and sense of place. Those themes can inspire school-authorised inquiries, but they do not predict the location of a 2027 SEC question. A photograph of one path does not establish daily counts, safety or all residents’ opinions. The value lies in practising geographic questions that could transfer to a very different area.
Use an original or lawfully available local photograph and ask what can be directly observed. Then list two proposed explanations that would need evidence. A pupil who can distinguish the two is beginning to think like a researcher. Avoid inventing current facility hours or drawing a causal conclusion from the image alone.
A hypothetical ten-week sequence
An illustrative school inquiry might use early sessions to clarify the question and methods, middle sessions for supervised data collection and processing, and later sessions for evaluation and reflection. This is not a prescribed week-by-week national timetable. The school determines the actual activities, resources and supervision, and the content area may be chosen from any appropriate part of the K226 syllabus.
At each milestone, ask the teenager what has actually been learned and whether the original hypothesis remains testable. If the method proves impractical, a well-justified revision may be appropriate. Do not fabricate results to preserve the initial plan. The educational objective is transparent inquiry, not a perfectly predictable story.
Exam Question 1: how to answer an unfamiliar fieldwork scenario
A source-based fieldwork question may provide a study aim, a sampling description, survey results or a map. The candidate should read the scope before applying a method. If the task asks how a sample is biased, identify who was selected and how that choice influences the claim. If it asks what a graph shows, describe the data accurately before explaining possible reasons.
Practise a short review routine: research question, method, evidence, limitation and conclusion. Use only the stages relevant to the actual subpart; a one-mark identification question does not need a long essay. A student who chooses the correct intellectual task first is better prepared for varied short-answer questions than one who copies a generic fieldwork paragraph.
The six-mark AO3 task is in Tourism, not Fieldwork Q1
K226 Paper 1 specifies one six-mark judgement-and-decision-making question in Question 2, Tourism. The fieldwork question is compulsory and assessed through other point-marked subparts. Students can practise evaluation in fieldwork, but they should not misstate the national allocation or assume that an extra six-mark fieldwork essay is guaranteed. The correct structure helps with timing and revision.
For Tourism AO3, teach the learner to define criteria, evaluate evidence, recognise environmental and social trade-offs and reach a defensible decision. The same underlying habit of weighing evidence supports fieldwork evaluation. However, the assessed question belongs to the Tourism section under the published scheme, so content and method should be practised in their proper context.
A Punggol-specific diagnostic for parents
Ask for one marked Geography response containing a chart or sampling scenario. Does the child describe the numbers correctly but overgeneralise beyond the sample? Does a suitable method appear without an explanation of why it fits the research aim? Or does the student confuse reliability with validity? Each is a different gap that can be repaired with a short, targeted exercise.
Some pupils have enough school support and need only a careful fifteen-minute review twice a week. Others benefit from a small-group discussion of data or methodology. The right help becomes clear when parents see actual independent work, not when they rely solely on a total subject mark or a list of topical keywords.
A twelve-week fieldwork and exam learning plan
Weeks one and two establish a baseline on Q1 methods and create a clear research question. Weeks three and four develop sampling and ethical questionnaire design. Weeks five and six practise interpreting counts, percentages and averages. Weeks seven and eight address mental maps, interviews, scatter plots and mapping conventions. Short retrieval of earlier skills should continue as new topics are introduced.
Weeks nine and ten focus on reliability, validity and defensible conclusions across different contexts. Weeks eleven and twelve integrate fieldwork Question 1 with the compulsory Tourism Question 2 under realistic Paper 1 timing, while maintaining separate Paper 2 revision. The outcome is a student able to analyse unfamiliar fieldwork evidence rather than recite one completed local project.
School choices, verified references and next steps
Families can check Edgefield Secondary, Greendale Secondary, Punggol Secondary and Yusof Ishak Secondary using MOE SchoolFinder and current school publications. Ask whether standalone K226 is offered for the child’s cohort and how the extended fieldwork is supervised. A national syllabus does not establish identical options for every school. Students should avoid extra field activities outside school safety procedures merely to create more revision material.
The official guide is SEAB’s 2027 G2 directory and the K226 Geography syllabus. For the distinct combined course see K229 Geography in Everyday Life. Begin this week with a fictional survey table and ask what it shows, whom it represents and one reason its conclusion might be limited.


