
A Punggol resident interested in facilities administration, sustainability support or junior building operations in 2027 or 2028 can build an important skill by reading energy-consumption reports carefully without assuming authority to touch electrical equipment. Start with the meter or approved data source, identify the unit and time interval, record the observed or reported value, check whether it is actual or estimated and explain any uncertainty. Kilowatt-hours measure energy used over a period; kilowatts describe power. Confusing the two can produce misleading reports even when every number is copied accurately.
Singapore’s Energy Market Authority (EMA) explains that electricity bills can include estimated consumption where meters are not read in a particular billing period, with later adjustments when actual readings are taken. EMA also advises businesses to use advanced-meter data to understand consumption patterns and consider appropriate energy-saving measures. JTC’s Punggol Digital District uses an Open Digital Platform to support data-enabled district operations, but that does not provide ordinary jobseekers unrestricted access to live meters or guarantee energy-management vacancies in 2028. This article focuses on reliable administrative measurement and safe escalation, not electrical repair, meter tampering or professional engineering certification.
- Role: support authorised energy-data reporting, baseline checks, documentation and facilities communication.
- Energy unit: kWh represents energy consumed, while kW represents rate of power usage.
- Meter reading: identify the correct meter, location, timestamp, unit, source and whether the value is cumulative or interval-based.
- Comparison: use compatible periods, service areas and operating conditions before claiming a trend.
- Estimated versus actual: distinguish provisional billing values from actual observations and later reconciliations.
- Data quality: look for missing intervals, unusual jumps, duplicates, incorrect units and unresolved readings.
- Safety: never open electrical panels, move meters, change wiring or perform live testing without appropriate qualifications and authorisation.
- Privacy: energy use data may reveal operational patterns; follow permitted access and data-sharing rules.
- Career evidence: use fictional meter data or authorised aggregated figures, not confidential building telemetry.
- 2027–2028: verify real job vacancies, specific building practices and applicable EMA rules rather than treating district projections as appointments.
Definition lock: kilowatt, kilowatt-hour, cumulative meter and baseline
A kilowatt measures power, meaning the rate at which energy is transferred or used. A kilowatt-hour measures energy, for example one kilowatt sustained for one hour. A cumulative electricity meter generally increases as electricity is consumed, while an interval meter can record usage in defined time slices. A baseline is an agreed reference period or condition used for comparison. These concepts are related but not interchangeable. A building may show a high instantaneous power demand without that number equalling its total monthly energy. Correct units and context are fundamental to honest reporting.
Why Punggol is a relevant setting without promising vacancies
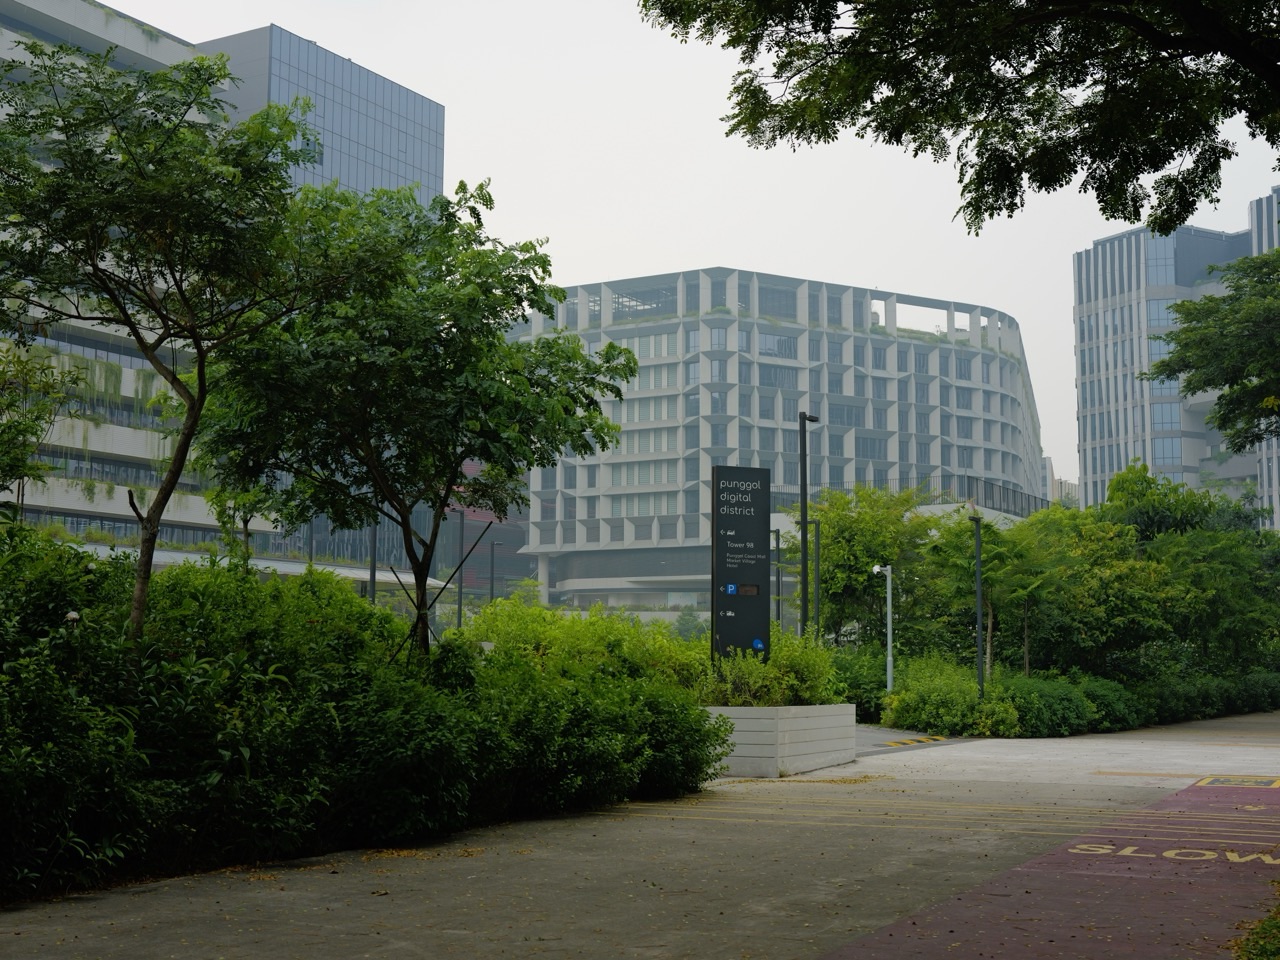
Punggol includes residences, public facilities, shops, university buildings and a developing smart business district. These settings require different energy systems and operating practices. JTC describes the Open Digital Platform as a means of integrating district management data, while GovTech highlights its role in areas such as district cooling. That is useful career context, not an invitation to manipulate live systems or a guarantee of junior energy jobs. An applicant should check actual roles, qualifications and worksite permissions. A facilities administration position may involve reports rather than engineering interventions.
EMA’s advice for business consumers
EMA’s electricity conservation guidance encourages businesses to manage air-conditioning, lighting, equipment schedules and other appropriate operations, and to use advanced-meter data to monitor consumption patterns. These suggestions do not authorise an untrained employee to modify electrical systems or ignore cooling, health or operational requirements. The relevant building owner must assess appropriate settings and safety. A junior worker can help record data and present reliable comparisons, while technical decisions remain with authorised facilities or engineering staff. Energy efficiency is a controlled operational objective, not a contest to make every room as warm or dark as possible.
Meters must be matched to the correct location
A meter identifier may refer to one tenant, distribution point, floor or building system. Without knowing the scope, a report can wrongly compare electricity used by different activities. Check the authorised meter label, account or system mapping before copying a number. A physically nearby meter does not necessarily measure the room beside it. If the mapping is unclear, request facilities support. Do not open cabinets or follow cables to identify the circuit independently. Reliable reporting begins with an accurate relationship between the data source and the service being described.
The difference between a meter reading and consumption
If an approved cumulative meter shows a previous reading of 12,500 kWh and a later reading of 12,780 kWh, the simple difference is 280 kWh over that interval, assuming both readings are comparable and no multiplier or correction applies. The second reading alone is not the energy used in that period. Some meters or billing systems use additional configurations, so a worker must follow the organisation’s actual method. All figures here are fictional. The arithmetic illustrates why copying cumulative totals into a monthly consumption column can create severe errors.
Timestamp and interval are part of the measurement
A figure of 300 kWh has limited meaning without knowing whether it covers a day, week or month. Even two daily readings can differ if one spans twenty-four hours and another spans thirty hours. Record start, end, time zone and any known data gaps where applicable. Avoid relying on a spreadsheet filename as proof of the observation period. A reported value may have been uploaded after the measurement occurred. A data-literate employee distinguishes the measured interval from the time when someone viewed or emailed the report.
Estimated bills can differ from actual usage
EMA explains that some electricity bills may be based on estimated consumption during months when a cumulative meter is not read, with adjustments when an actual reading becomes available. Its public explanation discusses relevant residential billing arrangements and submitted readings; it should not be copied as a universal rule for every commercial or advanced meter. A facilities assistant must identify the actual customer’s meter and billing method. Do not attribute a bill increase automatically to higher usage when estimated and reconciled periods differ. Check the source and dates.
Advanced meters can show more detailed patterns
EMA states that advanced meters can record energy consumption in half-hour intervals for relevant users, with data accessible through applicable services. Such granularity can help reveal when electricity usage is elevated, but it does not establish which appliance caused the change without further evidence. Commercial systems may use separate platforms and access restrictions. A junior worker should not claim every meter in Punggol offers identical data resolution. Check the particular instrument and approved report before comparing measurements or writing recommendations.
Power and energy are different operational questions
A building’s maximum power demand can affect infrastructure or tariff considerations differently from its total electricity energy consumption. A device with high kW demand for a short interval may use less energy than a lower-power device running continuously. Do not compare instantaneous power directly with monthly kWh totals. A proper report labels each axis and interval. An entry-level learner can understand the mathematics without diagnosing load balance or altering equipment. Specialist electrical and billing decisions require the actual technical data and competent oversight.
Consumption and cost are not identical
An electricity bill combines usage with applicable tariff, retailer price or other charges under the real arrangement. If consumption falls while the unit price rises, the total cost may not fall by the same proportion. Conversely, a lower bill can reflect a price change rather than a physical efficiency gain. A report should distinguish kWh, unit price and billed amount. EMA’s consumer guidance discusses different purchasing arrangements, but an employee must inspect the actual organisation’s contract. Do not announce financial savings from a consumption chart without verifying the relevant price and billing conditions.
A baseline must be comparable
Suppose a fictional office operates half as many days during a holiday period. A fall in monthly kWh may reflect fewer operating hours rather than improved equipment efficiency. Before comparing results, note occupancy, operating hours, weather, business activity and changes in measured area. The appropriate normalisation depends on the task. A junior employee can flag important context without inventing an engineering adjustment formula. An honest baseline states what was included and which conditions changed, so management does not treat an obvious calendar effect as a confirmed sustainability achievement.
Why the previous month is not always the right comparison
Energy use can change with season, school calendars, major events and maintenance. Comparing one unusual month with another may overstate progress. A longer reference period or matched operational conditions may be more appropriate, subject to actual data quality. Do not choose whichever month makes the reduction look largest. Record the baseline method before deciding whether an intervention helped. A useful report can say that consumption decreased but the cause remains uncertain. Such caution protects decisions about staffing, equipment and investment.
A missing interval is not zero consumption
An interval data platform may show a blank period when communication with the meter fails. Filling that blank with zero could imply equipment used no energy, even when nobody has checked. Use the approved missing-data convention and flag the gap. Some systems may supply validated estimates; if so, label them correctly. Do not make up a value because a chart requires continuous points. A data-quality problem should be resolved through the responsible provider, not hidden by an elegant graph. The distinction is crucial for any claim about savings.
An unusual spike is a prompt to investigate
A sudden increase could reflect higher demand, a changed operating schedule, a meter-data problem or an equipment issue. A chart alone cannot identify the cause. Check that the timestamp, unit and source are comparable, then report the anomaly to authorised facilities staff. Do not open an electrical cabinet or switch off equipment to test a hypothesis. Safe investigation may require specialists. The employee’s useful contribution is a factual timeline and appropriately scoped evidence, not confident electrical diagnosis from one plot.
Data access itself may have restrictions
An energy dashboard may show operational patterns such as occupancy, business schedules or sensitive equipment behaviour. That information need not be public merely because it is not a customer name. Follow the organisation’s information-security and data-sharing policy. Do not post detailed building telemetry on social media or paste restricted reports into an unapproved AI tool. An authorised user should know which aggregate figures may be used in external sustainability reporting. Data minimisation and professional discretion support a trustworthy energy-management programme.
A report needs the correct chart labels
A simple line chart can show kWh by day, but its axis must identify the unit and time period. A bar chart comparing two buildings may be misleading if the floor area and functions differ. Do not use truncated axes or decorative colour to imply a dramatic trend without explanation. A reliable report specifies the meter scope, data source and known limitations. This overlaps with general KPI literacy but focuses on electricity’s physical units, measurement intervals and building operating context. Good visual design begins with accurate definitions.
Normalisation can reveal a different story
A small shop and a large office may use different total kWh because of size and operating hours. Some analyses consider energy per unit floor area or other relevant activity measure, but such comparisons require suitable definitions and data. A beginner should not divide every consumption value by the number of employees and call it efficiency without evidence. Specialist benchmarking may use accepted methodologies. The appropriate action is to ask what performance question the organisation is trying to answer and which denominator genuinely reflects that question.
Energy reporting cannot replace safety checks
A worker might observe that a room’s consumption is high and suggest switching off ventilation or cooling. The relevant building owner must consider safety, health, equipment requirements and operational needs. Efficiency efforts should not override statutory or technical controls. A junior coordinator may gather authorised data and propose a review, while qualified facilities or engineering personnel evaluate measures. An energy chart is not permission to adjust switchboards, bypass alarms or interrupt critical systems. Safe work comes before a potentially flattering reduction percentage.
Understanding a simple meter-reading log
A practical record can contain approved meter ID, location or service scope, previous reading and time, current reading and time, unit, calculated difference, observation source and any discrepancy. Add an owner or review status if the organisation requires it. Avoid recording unnecessary personal information. A cumulative reading that unexpectedly decreases may indicate a meter replacement, transcription error, reset or configuration change; do not simply take the absolute value. Seek authorised clarification. The log should preserve evidence rather than force every result to appear ordinary.
Meter replacement can break trend comparisons
If a meter is replaced, the new device may begin from a different cumulative value or use a changed configuration. A naive subtraction across the swap could produce a negative or impossible consumption figure. The organisation should retain appropriate change records and use the correct approved reconciliation method. The junior analyst should identify the break and ask the technical owner for the relevant conversion or verified usage data. Inventing a bridging value to keep a graph continuous is not responsible reporting. Physical device changes matter to data interpretation.

A fictional shop comparing energy use
Imagine an invented Punggol retailer with a report showing 1,200 kWh in one month and 1,050 kWh in the next. The observed difference is 150 kWh, but the manager also changed opening hours. A junior administrator should record both facts rather than claim a precise efficiency gain from a lighting campaign. The correct next step might be comparing comparable operating days and verifying the data source. The figures are fictional and do not describe any actual shop. The example shows why a simple subtraction can be accurate while a causal conclusion is unsupported.
A fictional office with a blank interval
A fictional building dashboard has one missing half-hour interval during an otherwise ordinary day. A trainee initially fills the blank with zero so that the chart looks continuous. A supervisor explains that zero means measured non-use while missing data means the source is unavailable. The trainee restores the proper missing flag and asks the authorised system owner whether a validated estimate exists. No live equipment is touched. The case illustrates that data quality is not cosmetic. One small classification decision can affect the apparent consumption and the credibility of a report.
A fictional building meter replacement
An imaginary office changes its electricity meter under an authorised service arrangement. The previous cumulative value and new device’s initial reading cannot be subtracted directly as though they came from one uninterrupted register. The facilities owner provides the correct consumption information or reconciliation method. A junior employee marks the meter change in the log and preserves the separate source periods. The scenario is fictional and not a claim about Punggol Digital District. It shows why physical events must be reflected accurately in the data and why unexplained negative consumption should not be disguised.
A fictional late-evening energy pattern
A team notices that energy use remains elevated after normal office hours. It could reflect approved equipment, cleaning, cooling, server operations or an incorrect schedule assumption. The administrator checks actual occupancy and authorised usage context before suggesting action. They do not shut down a system because a chart makes it look wasteful. The appropriate facilities specialists can review which loads are necessary and which operational settings may be adjusted safely. The lesson is that a pattern is an investigation question, not automatic evidence that staff forgot to switch everything off.
A fictional tenant and landlord comparison
A business shares a building with other tenants and receives an allocation of utility costs. Its own internal energy observations may not match the landlord’s billed total because the records cover different spaces or services. Some common-area systems may be accounted for separately under the actual agreement. A junior worker should identify what each document measures and ask the responsible facilities or finance owner before calling the discrepancy an error. The case illustrates why building-level totals, tenant submeter readings and invoices cannot be compared blindly.
A fictional campus sustainability report
An imaginary university-related activity asks an assistant to prepare a small energy-use summary. The worker uses only authorised aggregated data and notes the time interval, units and source. They do not claim that reduced usage automatically equals a proven carbon-emissions reduction without an appropriate calculation method. If a public sustainability claim is proposed, the responsible owner should verify the methodology. This teaching case does not describe SIT’s real energy records. It shows how accurate operational reporting differs from writing an attractive environmental message.
A fictional sensor with an unexpected reading
A monitoring system suddenly reports an unusually high value. The trainee first checks that the displayed unit and timestamp are correct and whether the number is a measured value or alert classification. If it remains unusual, the issue is referred to the authorised specialist. The worker does not open a live electrical panel, reset the device or change calibration. A suspicious reading may indicate a true issue, a sensor fault or a data-transmission problem. Correct documentation allows the specialist to investigate without losing the original evidence.
A fictional utility bill adjustment
An imaginary customer receives a bill using an estimated value in one period and a later bill reflecting an actual reading. The amounts may be affected by reconciliation rather than a sudden change in equipment use. EMA’s public billing explanation illustrates this principle for relevant metering arrangements. A worker should check the actual account and retailer terms before applying the same explanation to a commercial site. The correct support message distinguishes measured consumption from billing estimates. This scenario is not a report about a real Punggol household.
A meter reading should have provenance
Provenance means being able to identify where information came from. For an energy record, the source may be a certified billing statement, an authorised meter display or a controlled digital export. Each has its own time, scope and limitations. A staff member should not claim they personally observed a meter when they copied a number from another report. Recording the actual origin helps colleagues reproduce the calculation. When multiple sources disagree, preserve the discrepancy and ask which source governs the specific reporting purpose.
When a weekly total is misleading
A weekly comparison can be affected by public holidays, shift changes or major events. A facility open seven days may have a different usage pattern from one open only on weekdays. Before reporting a percentage change, identify the number of comparable operating hours and any known unusual events. An employee should not selectively exclude busy days only when that improves the chart. A sound analysis defines its comparison method consistently. It can still be useful to report raw totals alongside an explanation that they do not measure pure equipment efficiency.
Normalisation must follow the decision
Energy per floor area, per visitor or per unit of output may each answer a different question. There is no universally correct denominator for every building. A food-service kitchen can have a different operational load from a quiet office. A junior worker should ask what management wants to assess and whether the comparison includes genuinely similar activities. If the necessary denominator is missing or unreliable, say so rather than fabricate it. Transparent limitations are part of professional reporting, not an admission that data work has failed.
What can be done without touching equipment
A junior sustainability coordinator can record approved meter information, check chart labels, compare relevant periods, identify missing data and refer anomalies to facilities engineers. They may also help compile an authorised report of operational schedules. They should not alter wiring, calibrate a meter or operate restricted systems without necessary training. Separating data administration from technical intervention makes the role clearer and safer. A well-documented question can save a specialist time by identifying which readings and circumstances need investigation.
Energy-saving recommendations need operational review
EMA advises business consumers on measures such as managing lighting and cooling operating times and choosing efficient equipment. Actual changes must consider occupant comfort, equipment specifications, health, contracts and safety. An employee should not arbitrarily turn off ventilation or lighting to improve a KPI. The correct proposal identifies the observed usage, possible measure, expected constraints and responsible reviewer. A small authorised test may then be planned if appropriate. Savings should be measured honestly after implementation rather than promised based solely on a brochure.
Why electric bills should not be posted publicly
A detailed bill can contain account identifiers, business addresses, costs and operational information. Sharing it in a public portfolio may breach confidentiality even without an employee’s name. Use fictional bills for practice or properly authorised aggregated figures. The organisation’s data policies determine who can inspect and publish actual records. A trainee may demonstrate calculation method without exposing customer contracts or security-sensitive building information. Professional information handling matters as much as being able to create a convincing sustainability chart.
How to write a one-paragraph anomaly note
A useful note states the meter or authorised source, timestamp, observed value, previous comparable context, known limitations and who has been notified. Avoid a speculative conclusion such as ‘air-conditioner failing’ unless the qualified specialist confirms it. For example, the note could say an approved report shows an unusual increase for a particular interval while the operating schedule is being checked. That wording preserves the investigation question. The next worker should know what evidence exists and which action is pending without having to reconstruct an informal conversation.
Energy reporting should not become an employee blame tool
A building’s higher energy use may reflect occupancy, equipment requirements or an unusual service period rather than individual negligence. Avoid publishing staff rankings based on limited observations or blaming the last person in the office without evidence. A manager should investigate patterns fairly and check how the data were collected. The same caution applies to claims that a new team reduced usage dramatically. Appropriate recognition can follow verified outcomes; unsupported personal accusations and inflated savings figures undermine trust and create pressure to manipulate records.
A fictional five-day spreadsheet exercise
Create five days of invented electricity readings with start and end values. Include one deliberate unit error, one missing interval and an apparent drop caused by a hypothetical meter replacement. Calculate only the differences that can legitimately be compared, and mark unresolved cases for review. Add a simple note about operating hours. This exercise demonstrates numeracy and data quality without needing access to a real utility account. Label all data fictional and do not claim it represents any building or actual power consumption in Punggol.
A two-week learning plan
In week one, practise kW versus kWh, timestamps, cumulative differences and estimated versus actual values using harmless sample data. In week two, build a fictional baseline, identify a missing period and write a concise explanation of a potential confounding factor. Read EMA’s conservation and metering guidance, then compare real job descriptions for facilities support or sustainability coordination. Do not pursue electrical testing on live equipment as a learning experiment. The goal is to be an accurate administrative partner to qualified specialists.
An interview answer about a high energy reading
If asked how you would respond to a sudden increase, explain that you would first verify the meter identity, period, unit and source. You would record known occupancy or operating changes, avoid assuming a cause and escalate to the authorised facilities team. You should not promise to fix an electrical system or claim a reduction before a measurement supports it. This answer demonstrates data literacy, safety and respect for role boundaries. Those qualities are useful even where the job does not involve advanced engineering calculations.
What 2028 jobseekers should verify
Some local buildings may introduce more advanced sensors, automated controls or new reporting standards, but public project descriptions do not prove any individual vacancy or device-access entitlement. Read the current employer’s requirements, professional qualifications, worksite and training arrangements. Recheck EMA guidance because energy retail and metering arrangements can evolve. The durable skill is identifying the real source, unit, time and limitation of an energy figure and knowing when a qualified person must investigate the physical system.
Your next step
Make a fictional log showing two comparable cumulative readings and one missing interval. Calculate the supported consumption difference, identify the uncertainty and write a short report that does not guess a cause. Then consult EMA’s business conservation and metering explanations, and note which technical actions would be outside an entry-level operations role. A Punggol sustainability career begins with trustworthy evidence and safety, not a claim of guaranteed savings from an attractive dashboard.
Frequently asked questions
Is kW the same as kWh?
No. Kilowatts measure power; kilowatt-hours measure energy over time.
Can I subtract readings from two unrelated meters?
No. Confirm the same source, configuration and comparable interval before calculating consumption.
Does a lower bill always prove lower usage?
No. Price, estimated readings and adjustments may change the bill.
Can a blank interval be treated as zero consumption?
Not without justified evidence. Missing data and measured zero are different.
Does an unexplained meter spike prove equipment failure?
No. It calls for verified data and appropriate technical investigation.
Can a junior employee open an electrical panel to check a reading?
Not without the required authorisation and competence. Follow safe escalation.
Does every Punggol business have half-hourly smart-meter data?
No. Actual meter type, access and reporting arrangements differ.
Can a reduction in kWh be called carbon savings automatically?
Not without an appropriate calculation method and verified reporting basis.
Should confidential building energy logs go into a public portfolio?
No. Use fictional or properly authorised aggregated data.
Does Punggol Digital District guarantee energy-management jobs?
No. Verify real openings and qualification requirements.
Official sources and related Punggol guides
- EMA: Electricity Conservation Tips for Business Consumers
- EMA: How Electricity Consumption Is Billed
- EMA: Cumulative and Advanced Electricity Meters
- GovTech: Open Digital Platform for Smart City Operations, May 2026
- JTC: Punggol Digital District
- WSH Council: Workplace Risk Management
- PDPC: Data Protection and ICT Guidance
- eduKate Punggol: Reading Dashboards and KPIs
- eduKate Punggol: Mapping Bottlenecks and Small Improvements


