
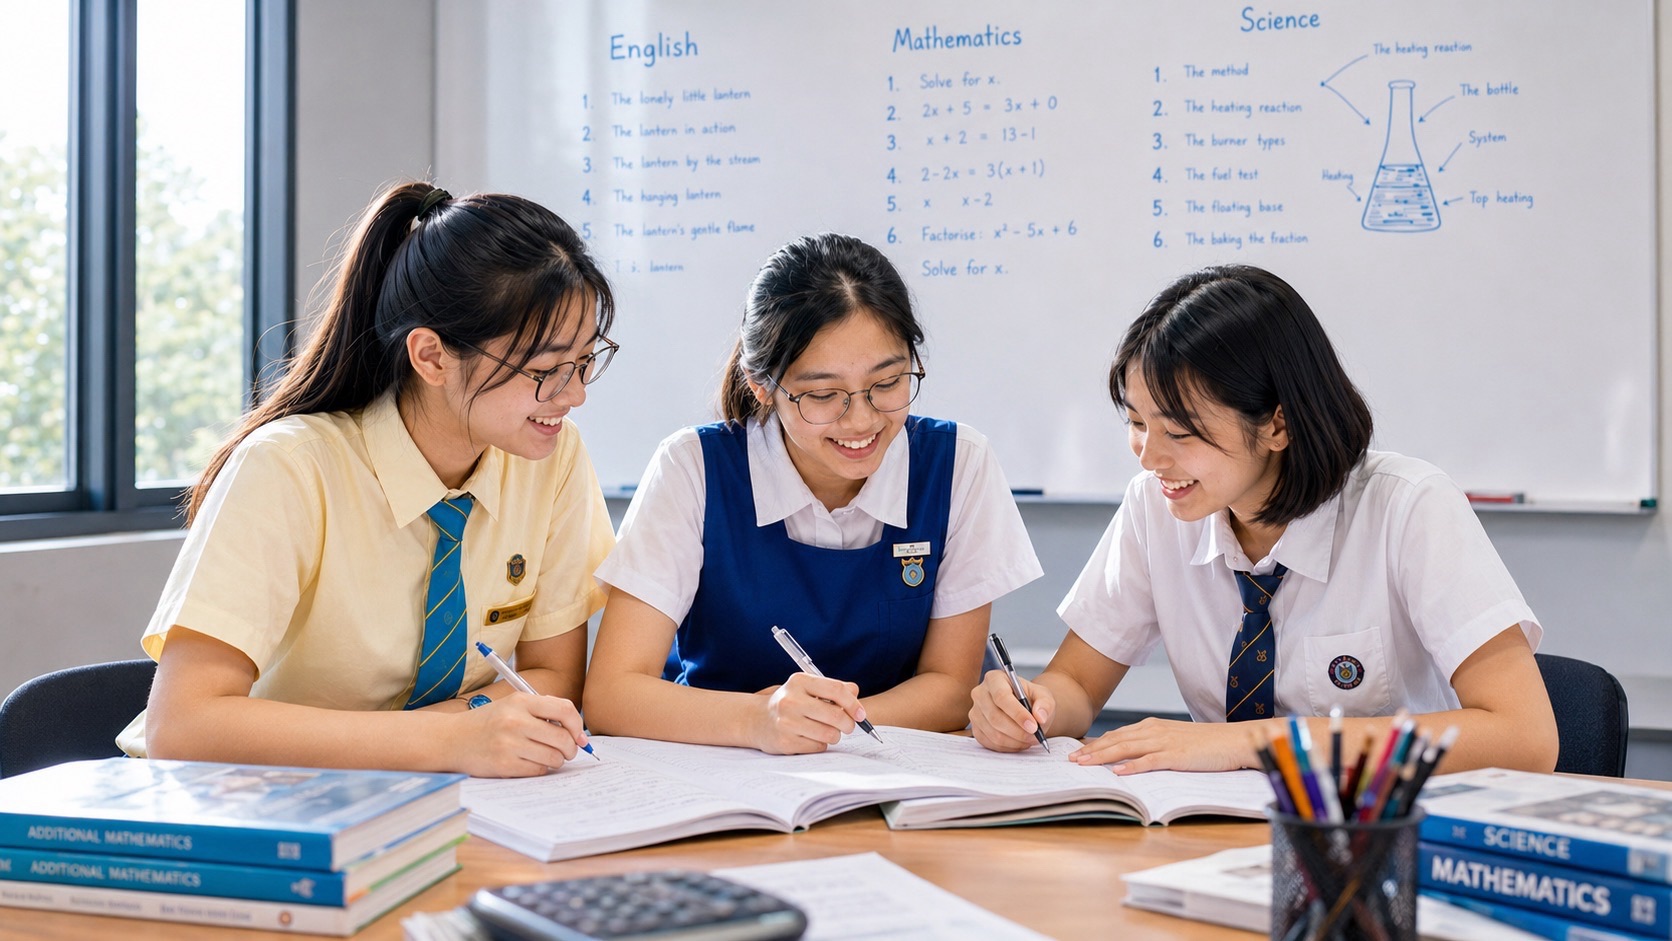
Punggol Science Tuition should teach students to treat Science graphs and data as evidence, not decoration. Students often know the chapter but lose marks because they misread the scale, compare the wrong values, describe instead of explain, or force a memorised answer onto data that says something different.
The core aim of Science graphs and data in Punggol tuition is to build disciplined evidence reading. The student should identify variables, units and scale, describe the pattern accurately, notice anomalies, make valid comparisons and only then apply the scientific model. Strong data reasoning protects students from one of the most common Science mistakes: answering what they expected to see instead of what the evidence actually shows.
Explore related Science guides and choose your next reading step.
Graphs and Data Are a Language of Science
Science does not communicate only through paragraphs.
Measurements become tables. Tables become graphs. Graphs reveal patterns. Those patterns are interpreted using scientific models.
Students therefore need data literacy as a core Science skill.
The Core Aim: Evidence First, Explanation Second
A reliable data routine begins with what is visible.
- Read the title or context.
- Identify the variables.
- Check units.
- Read the scale.
- Describe the pattern.
- Identify anomalies or plateaus.
- Make the relevant comparison.
- Then explain using Science.
This order prevents the model from overriding the evidence.
Read the Axes Before the Shape
Students often look at whether a line rises or falls before checking what the axes represent.
The same visual shape can mean very different things depending on the variables.
Axes first, interpretation second.
Units Can Change the Meaning of the Data
A graph in seconds is different from a graph in minutes. A mass in grams differs from kilograms.
Students should read and use units deliberately.
Unit awareness also supports later calculations.
Scale Errors Are More Common Than Students Think
An axis may increase by 2, 5, 10 or a non-obvious interval.
A student who assumes the scale can build an incorrect explanation from the first line of working.
Scale checking should become automatic.
Describe the Pattern Before Explaining It
“The rate increased as temperature increased” is a description.
“The rate increased because…” begins the scientific explanation.
Keeping these steps separate improves accuracy and clarity.
Use Comparative Language Precisely
Science data often requires comparison.
Students should use language such as greater than, lower than, increases more rapidly, remains constant or reaches a plateau.
The comparison should match the actual evidence.
Primary Science Data Skills Should Begin With Tables
Primary students can learn to read headings, compare rows and identify what changed.
Simple tables are excellent training for later graphs.
The child should know which values answer the question rather than scanning randomly.
PSLE Science Graphs Need Transfer
PSLE contexts may be unfamiliar, but the data-reading routine remains the same.
Students should resist guessing the topic from the picture and instead read the variables first.
See PSLE Science Tuition.
Secondary Science Data Becomes More Quantitative
Secondary students may need to interpret gradients, rates, curves, intercepts, experimental scatter and relationships between variables.
The representation must be understood before the explanation or calculation.
See Secondary Science Tuition.
Physics Graphs Often Encode Quantitative Relationships
In Physics, a gradient or area may carry physical meaning depending on the axes and syllabus context.
Students should not memorise “gradient means…” without checking the graph first.
Representation determines meaning.
Chemistry Graphs Often Show Rate, Temperature or Quantity Changes
Chemistry data may show how a reaction changes over time or with conditions.
Students should describe the observable pattern, then explain using particles, collisions or the relevant chemical model.
Do not skip the data because the theory is familiar.
Biology Graphs Often Show Living-System Responses
Biology data can include variation, optima, plateaus and changing rates.
Students should distinguish what the graph actually demonstrates from what biological knowledge suggests.
The data sets the boundary of the claim.
Anomaly Does Not Mean “Delete It”
An anomalous point may reflect measurement error, biological variation or a real but unexpected effect.
Students should identify why the point looks inconsistent and consider whether it should be repeated or investigated.
Scientific evaluation is more careful than simply removing inconvenient data.
Plateaus Need Interpretation
A plateau means the measured response is no longer changing substantially over that range.
The explanation depends on the scientific context.
Students should avoid applying a memorised “limiting factor” sentence unless the evidence and topic justify it.
Correlation Is Not Automatically Causation
Two variables can change together without proving that one directly causes the other.
This distinction becomes increasingly important in secondary data interpretation.
Students should keep claims proportional to the evidence.
Tables Can Hide Confounding Variables
A valid comparison requires attention to what else changes between conditions.
Students should ask whether the compared rows differ in more than one important factor.
This links data reading with fair-test reasoning.
Graphs and Experiments Should Be Connected
A graph is often the final representation of an experiment.
Students should understand where the data came from, which variable was controlled and what measurement produced each point.
See Science Experiments.
Choose the Right Graph Type
Where students are asked to present data, the graph type should fit the variables and purpose.
A line graph, bar chart or other representation is not chosen because it looks familiar.
The structure of the data should guide the representation.
Plotting Accuracy Matters
Points should be placed accurately, axes labelled and scales chosen sensibly.
Poor plotting can create a false pattern.
Data representation is part of scientific communication.
Best-Fit Thinking Should Follow the Course Requirements
Where appropriate, students may need to recognise overall trends rather than join every noisy point mechanically.
The exact convention depends on the syllabus and task.
The key idea is to represent the evidence honestly.
Data Questions Often Hide an Answering-Technique Problem
A student may read the graph correctly but fail to express the comparison.
Another may explain before describing.
See Science Answering Techniques.
Data Questions Can Also Hide a Calculation Problem
Students may need to calculate a rate, percentage, gradient or another quantity from the data.
The graph-reading and calculation skills should therefore be trained together.
See Science Calculations.
The Graph-and-Data Error Map
- Axes not read.
- Unit missed.
- Scale misread.
- Wrong values compared.
- Trend described inaccurately.
- Anomaly ignored.
- Description confused with explanation.
- Memorised theory forced onto contradictory data.
- Claim stronger than evidence.
- Calculation based on a misread value.
These error categories are highly transferable across Science topics.
Use Data Sets From Different Topics
Graph skill becomes stronger when students practise across Biology, Chemistry and Physics rather than inside one chapter only.
The common reading routine remains stable while the scientific explanation changes.
This is a powerful form of interleaving.
Strong Students Need Messier Data
Perfect textbook graphs can make interpretation too easy.
Strong learners can work with anomalies, uncertainty, competing trends and data that supports more than one plausible explanation.
This develops scientific judgement.
Struggling Students Need Clean Data First
A learner who repeatedly misreads axes may need simple graphs before moving to complex datasets.
Isolate the reading skill first, then add scientific explanation.
This prevents cognitive overload.
A Weekly Data Routine
- One table comparison.
- One graph description.
- One graph explanation.
- One anomaly question.
- One practical-data evaluation.
- One calculation from data.
- One delayed retest.
A short weekly routine can improve many topics at once.
Past Papers Should Be Analysed for Data Errors
After a paper, separate content mistakes from data-reading mistakes.
A student who understood the topic but misread the graph needs different practice from a student who read correctly but lacked the model.
See Science Past Papers.
Assessment Should Track Data Skills as a Separate Category
Graph and data errors often recur across chapters.
Tracking them separately makes progress visible and allows targeted repair.
See Science Assessment.
How Parents Can Support Graph and Data Reading
- Ask what each axis represents.
- Ask what the unit is.
- Ask the child to describe the pattern before explaining it.
- Ask which values are being compared.
- Ask whether any point looks unusual.
- Ask what the evidence cannot prove.
These questions build evidence discipline without giving away the answer.
How the eduKate Ecosystem Connects
The broader practical route is Experiments, Data, Graphs and Practical Reasoning.
For quantitative links, use Mathematics Inside Science — Units, Rates, Graphs and Models.
Frequently Asked Questions
How can students improve Science graphs?
Use a fixed routine: axes, variables, units, scale, pattern, anomaly, comparison and only then explanation.
Why do students misread graphs even when they know the topic?
Graph reading is a separate representation skill. The student may understand the concept but misread scale, axes or the relevant comparison.
Should students describe before explaining?
Usually yes when the task asks for both. Establish what the evidence shows before applying the scientific mechanism.
How should anomalies be handled?
Identify why the point appears inconsistent, consider measurement or natural variation and investigate or repeat where appropriate rather than deleting automatically.
How do we know graph skill is improving?
Students read scales accurately, choose valid comparisons, separate description from explanation and make claims that stay within the evidence.
The Core Aim, in One Sentence
The core aim of Science graphs and data in Punggol tuition is to teach students to read evidence before explanation: identify the variables, respect the scale, describe the pattern, compare validly and let the data constrain the scientific claim.
Good Science begins with looking carefully at what the evidence actually says.


