
Probability and tree diagrams are important Secondary Mathematics search topics because they require students to organise possible outcomes, distinguish independent and dependent events, multiply along branches, add across compatible outcomes and check that probabilities remain logically valid. Students often know basic probability but lose marks when multi-stage events are not represented clearly.
This Mathematics Improvements in Punggol guide sits beneath the broader Statistics and Probability owner. It focuses on sample spaces, complementary events, tree diagrams, independent events, dependent events, with-replacement and without-replacement situations, and systematic checking. The exact depth should always follow the student’s school syllabus and current SEC subject level.
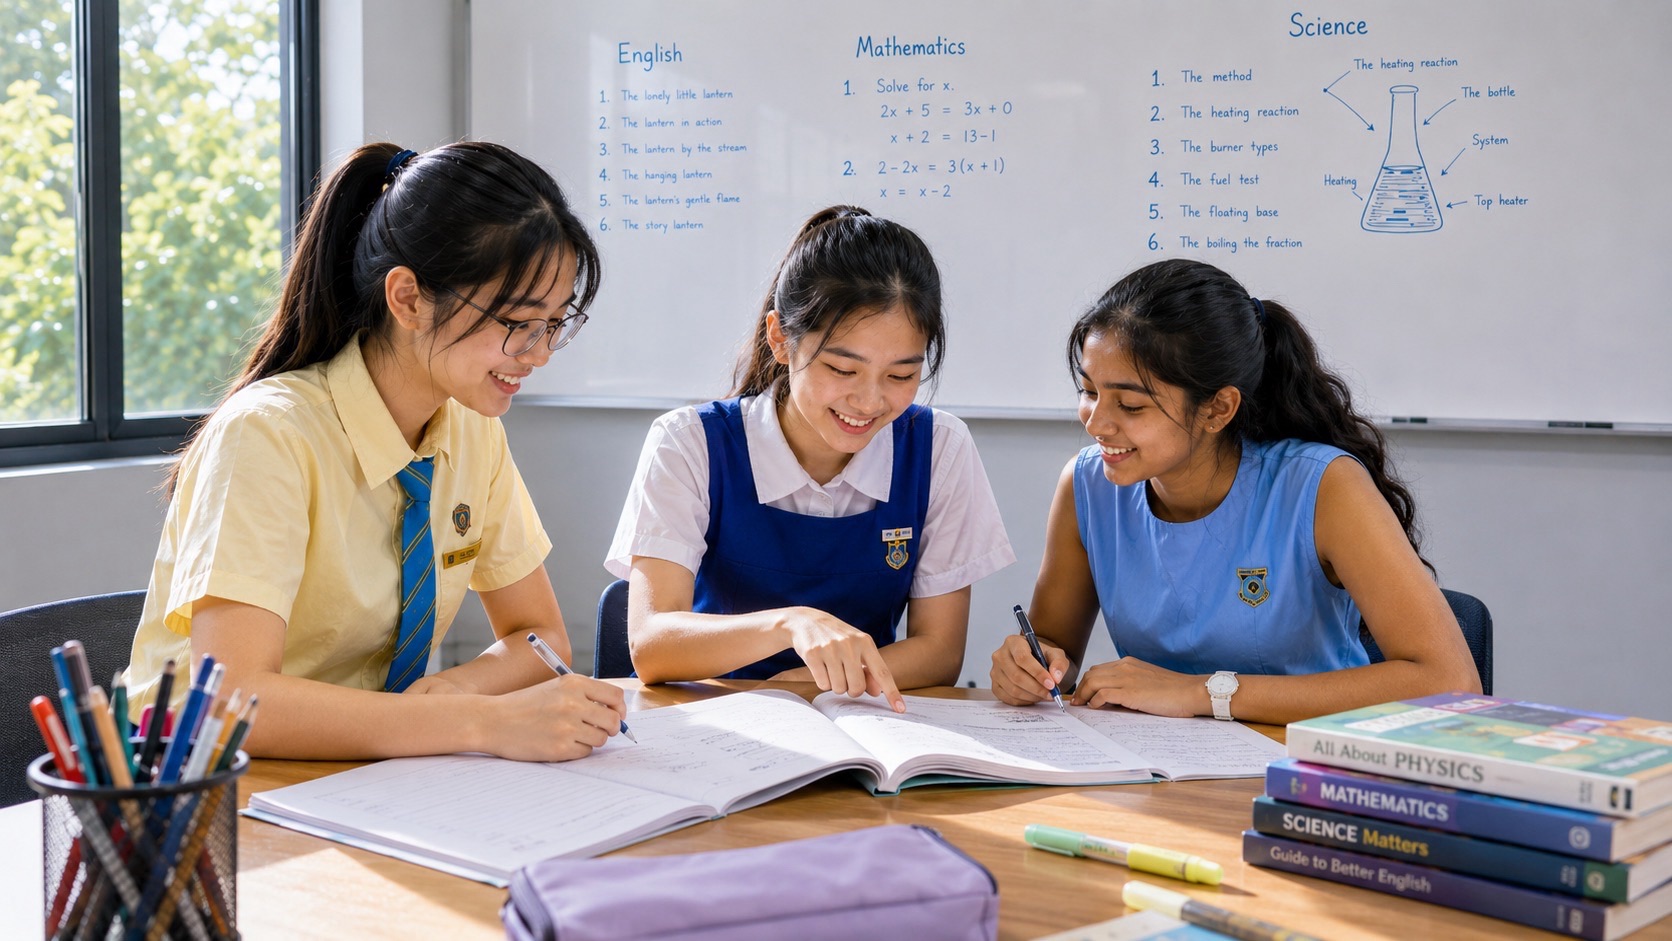
At eduKate Punggol, Mathematics tutorials are held at 83 Punggol Central, Singapore 828761, near Punggol MRT and Waterway Point, in small groups of up to three students. A small group helps because the tutor can see whether the learner’s problem is sample-space construction, branch probabilities, multiplication, addition, or misreading whether an event changes what happens next.
Probability begins with a clear sample space
The sample space is the set of possible outcomes. For a fair six-sided die, the sample space is {1,2,3,4,5,6}. For two coin tosses, the ordered outcomes are HH, HT, TH and TT.
A strong probability solution begins by knowing what can happen before calculating how likely it is.
Probability must stay between 0 and 1
A probability of 0 represents an impossible event and 1 represents a certain event. Equivalent percentages lie between 0% and 100%.
Any result outside this range is automatically a signal to check the calculation.
Complementary events
If an event A has probability P(A), then the probability that A does not occur is 1 − P(A), provided those two outcomes cover all possibilities.
This complement rule is often faster than adding many separate unwanted outcomes.
Tree diagrams organise multi-stage events
A tree diagram shows branches for possible outcomes at each stage. Each complete path represents one sequence of events.
The main advantage is organisation: students can see which probabilities belong together and whether later probabilities change after earlier outcomes.
Multiply along a path
For independent stages, the probability of a specific sequence is found by multiplying the branch probabilities along that path.
If a fair coin is tossed twice, P(H then H) = 1/2 × 1/2 = 1/4.
Add across separate successful paths
If an event can happen through several mutually exclusive paths, add the probabilities of those paths.
For exactly one head in two tosses, the successful paths are HT and TH. Each has probability 1/4, so total probability = 1/2.
Independent events
Events are independent when one outcome does not change the probability of the next event. Repeated fair coin tosses are a standard example.
Each stage of the tree retains the same branch probabilities.
Dependent events
Events are dependent when an earlier outcome changes what remains possible. Drawing objects without replacement is a common example.
The branch probabilities on the second stage must then change because the total number of objects and category counts have changed.
Worked example: with replacement
Question: A bag contains 3 red and 2 blue counters. One counter is drawn, replaced, then another is drawn. Find P(red then red).
P(red) = 3/5 on each draw because the counter is replaced. Therefore P(RR) = 3/5 × 3/5 = 9/25.
Worked example: without replacement
Question: The same bag contains 3 red and 2 blue counters. One counter is drawn and not replaced. Find P(red then red).
First red: 3/5. After one red is removed, 2 red remain out of 4 counters. Therefore P(RR) = 3/5 × 2/4 = 3/10.
The difference between replacement and no replacement is the dependency.
Exactly one, at least one and none
Language matters. “Exactly one” means one and only one successful event. “At least one” means one or more. “None” means zero successful events.
For “at least one,” the complement method can be efficient: 1 − P(none).
Worked example: at least one success
Suppose the probability of success on each of two independent trials is 0.3. P(no success) = 0.7 × 0.7 = 0.49. Therefore P(at least one success) = 1 − 0.49 = 0.51.
Tree diagrams and fractions
Branch probabilities are often fractions. Students need reliable fraction multiplication and addition to use tree diagrams accurately.
The Fractions, Decimals and Percentages guide supports that prerequisite.
Tree diagrams and percentages
Probabilities may also be written as decimals or percentages. Students should keep one representation consistently during a calculation unless conversion helps.
For example, 30% can be written as 0.3 or 3/10. Mixing forms carelessly increases error risk.
Tree diagrams and conditional thinking
Even where formal conditional probability notation is not required, dependent tree diagrams introduce the idea that probability can change after information is known.
Students should ask: after this outcome, what remains? That question is the core of without-replacement reasoning.
The probability/tree-diagram error taxonomy
- Sample-space error — possible outcomes are missing or duplicated.
- Branch-total error — probabilities from one node do not sum to 1.
- Replacement error — second-stage probabilities are not updated correctly.
- Path error — branch probabilities are added instead of multiplied.
- Combination error — separate successful paths are not added.
- Language error — exactly one, at least one and none are confused.
- Complement error — 1 − P(event) is used when the event and its complement do not cover the full space as interpreted.
A reliable tree-diagram routine
- Define the stages.
- Write all branches from each node.
- Check that branch probabilities from each node sum to 1.
- Update probabilities after dependent outcomes.
- Multiply along each relevant path.
- Add the successful paths.
- Check the final probability lies between 0 and 1.
How to check branch probabilities
At every branching point, the probabilities should total 1. This catches missing branches and incorrect fractions before the full calculation is completed.
How to practise efficiently
Start with one-stage sample spaces and complements. Add two independent stages. Then introduce tree diagrams with replacement. Next introduce without-replacement problems. Finally mix “exactly one,” “at least one,” and multi-path outcomes.
The goal is to make representation as reliable as arithmetic.
How this connects to the broader probability lane
The companion Data Analysis, Statistics, Graphs and Probability guide covers the wider interpretation system. This page owns the multi-stage probability and tree-diagram intent.
How to know the topic is improving
- Sample spaces are complete.
- Branch probabilities sum correctly.
- Replacement and non-replacement are distinguished.
- Multiplication is used along paths.
- Addition is used across alternative successful paths.
- Complement methods are chosen appropriately.
- Final probabilities are checked for plausibility.
How small-group tuition can help
One student may build the tree correctly but combine probabilities wrongly; another may forget to update without replacement; another may misread “at least one.” A three-student tutorial allows the tutor to isolate those different reasoning failures.
Frequently asked questions
Why do we multiply along branches?
A path represents a sequence of events that must all occur. Multiplication combines the probability of that sequence under the conditions shown.
Why do we add different paths?
If the desired outcome can happen through separate mutually exclusive paths, their probabilities are added.
What changes without replacement?
The composition of the set changes, so later branch probabilities must be recalculated.
When is complement useful?
It is often efficient for “at least one” questions because calculating the probability of none may be simpler.
Continue the Mathematics Improvements in Punggol lane
- How to Improve Quadratic Equations, Factorisation and Graph Roots.
- How to Improve Pythagoras and Trigonometry.
- How to Improve Circles, Area, Circumference and Mensuration.
- How to Improve Data Analysis, Statistics, Graphs and Probability.
Probability and tree diagrams become reliable when students organise the sample space before calculating. Build complete branches, update dependent probabilities, multiply along paths, add alternative successful paths and use the range from 0 to 1 as a final logic check.
Further learning: Khan Academy Probability · Maths Is Fun Probability Tree Diagrams.
Explore the Punggol Mathematics reading library for related guides.


